Fig. 6.
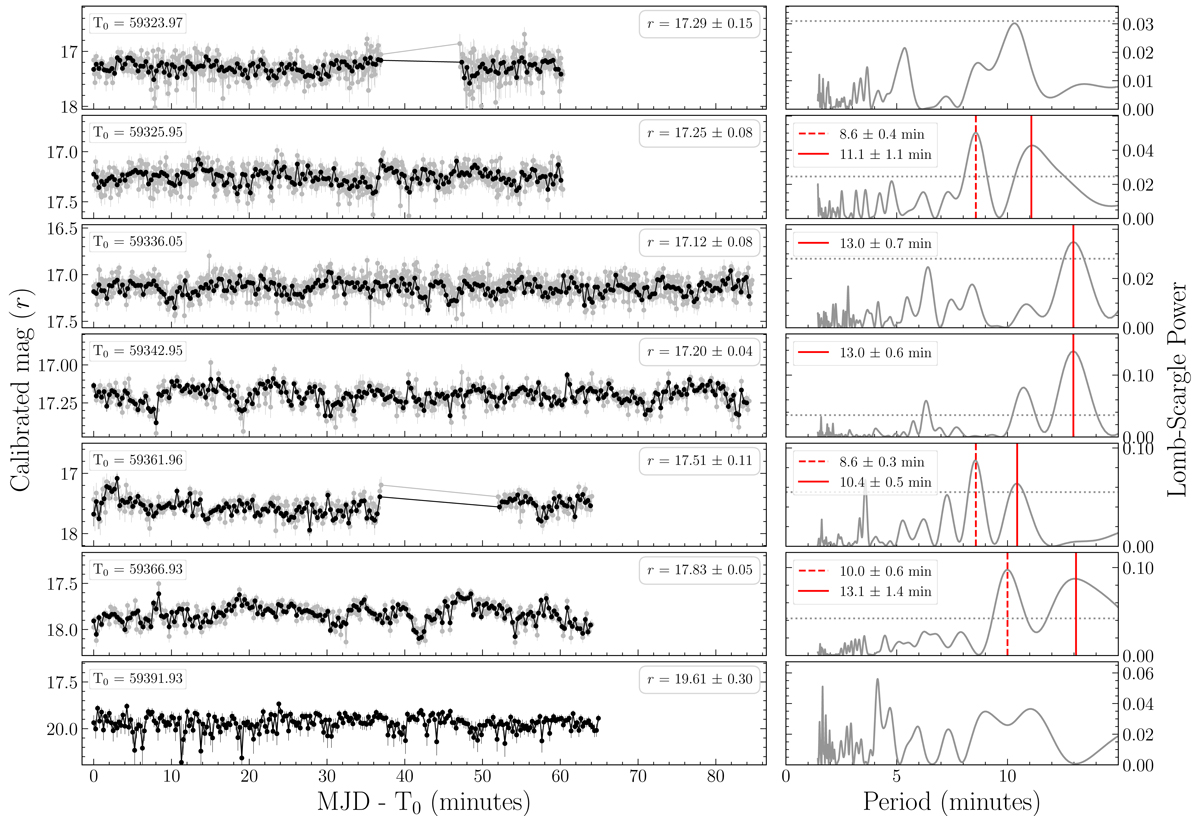
Download original image
Optical light curves (left) and periodograms (right) for the 2021 outburst, using the same colour and line codes than Fig. 5, from top (#1) to bottom (#7). We note that epochs #1 and #7 do not show significant peaks in the LSPs. When the favoured DRP does not correspond to the peak with the highest power (see Sect. 3.3.1), the last one is indicated with a vertical dashed line (#2, #5 and #6). Epoch #7 is not averaged into 20 s bins, as the exposure time was 15 s.
Current usage metrics show cumulative count of Article Views (full-text article views including HTML views, PDF and ePub downloads, according to the available data) and Abstracts Views on Vision4Press platform.
Data correspond to usage on the plateform after 2015. The current usage metrics is available 48-96 hours after online publication and is updated daily on week days.
Initial download of the metrics may take a while.