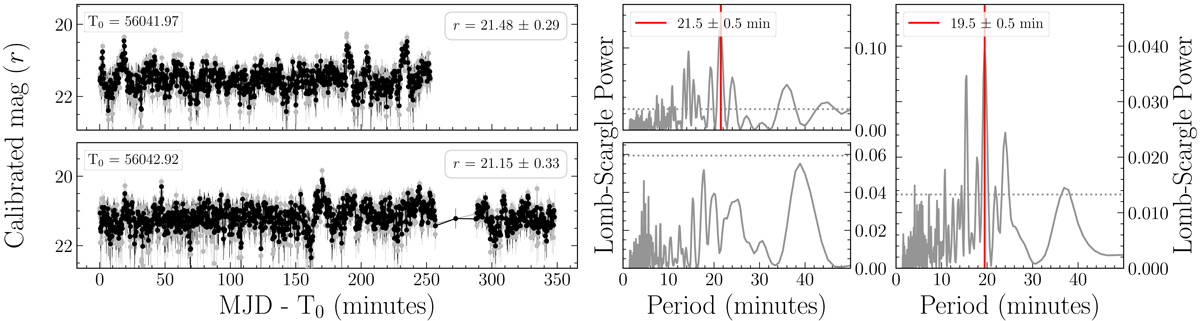
Fig. C.2.
Download original image
Optical r-band light curves for the 2012 quiescence data set (left). Original and combined (to 20 s) data sets are plotted in grey and black, respectively. The LSP is computed for the original data set in each epoch (middle) and for the whole data set (right). The 0.2 FAP (80% significance) and the highest, significant peak are indicated by a horizontal dashed line and a vertical red line, respectively.
Current usage metrics show cumulative count of Article Views (full-text article views including HTML views, PDF and ePub downloads, according to the available data) and Abstracts Views on Vision4Press platform.
Data correspond to usage on the plateform after 2015. The current usage metrics is available 48-96 hours after online publication and is updated daily on week days.
Initial download of the metrics may take a while.