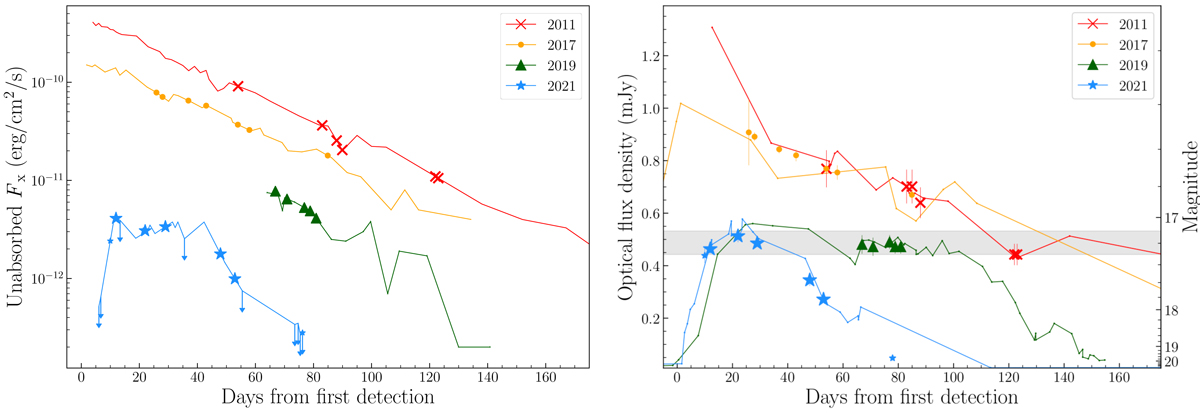
Fig. 2.
Download original image
X-ray (Swift and NICER, left panel) and optical (LCO, right panel) light curves of the four outbursts (solid lines). In both panels, the photometric epochs used in this work are indicated by symbols (crosses, dots, triangles and stars for 2011, 2017, 2019, and 2021 outbursts, respectively), with smaller markers for epochs with no significant DRPs (#1 and #7 in 2021, see Sect. 3.3). The dates of first detections are given in Table 2. The grey band indicates an optical magnitude interval (17.1–17.3) with peculiar DRP evolution (see Fig. 8, and Sect. 4.2.1).
Current usage metrics show cumulative count of Article Views (full-text article views including HTML views, PDF and ePub downloads, according to the available data) and Abstracts Views on Vision4Press platform.
Data correspond to usage on the plateform after 2015. The current usage metrics is available 48-96 hours after online publication and is updated daily on week days.
Initial download of the metrics may take a while.