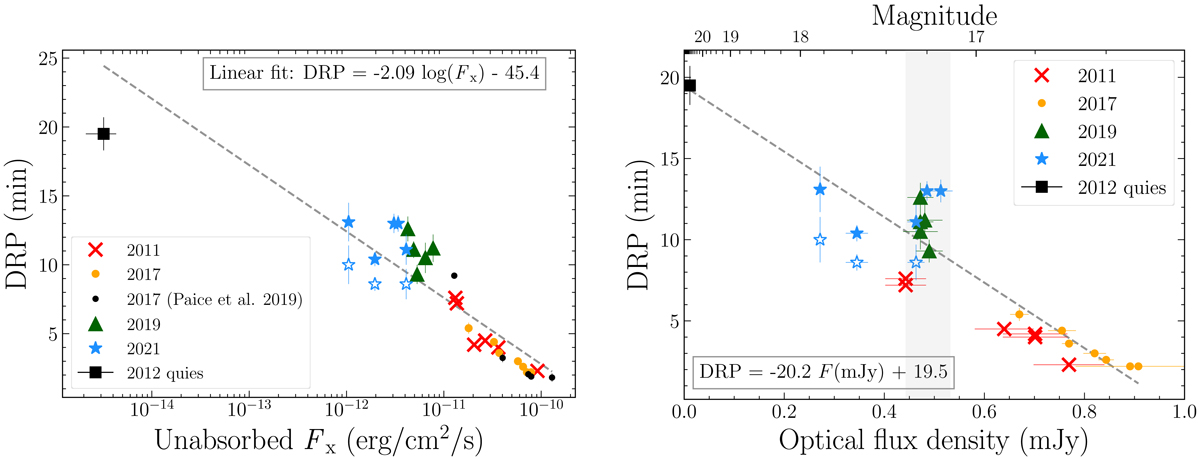
Fig. 9.
Download original image
Same figure as Fig. 8, now including data from 2012 quiescence (black square) and an independent data set from the 2017 outburst (Paice et al. 2019, small black dots in the left panel). In the DRP-Fx plot (left panel) the quiescent Fx value was obtained with XMM-Newton 422 days after the DRP measurement (Armas Padilla et al. 2014b), which could affect its position on the diagram. The coefficients of a linear fit to all the data sets (excluding 2021 open markers) are shown in a text box.
Current usage metrics show cumulative count of Article Views (full-text article views including HTML views, PDF and ePub downloads, according to the available data) and Abstracts Views on Vision4Press platform.
Data correspond to usage on the plateform after 2015. The current usage metrics is available 48-96 hours after online publication and is updated daily on week days.
Initial download of the metrics may take a while.