| Issue |
A&A
Volume 682, February 2024
|
|
|---|---|---|
| Article Number | A133 | |
| Number of page(s) | 22 | |
| Section | Interstellar and circumstellar matter | |
| DOI | https://doi.org/10.1051/0004-6361/202347770 | |
| Published online | 13 February 2024 | |
A radical transition in the post-main-sequence system U Equulei★
1
Nicolaus Copernicus Astronomical Center, Polish Academy of Sciences,
Rabiańska 8,
87-100
Toruń,
Poland
e-mail: This email address is being protected from spambots. You need JavaScript enabled to view it.
2
Nordic Optical Telescope,
Rambla José Ana Fernández Pérez 7,
38711
Breña Baja,
Spain
3
Department of Physics and Astronomy, Aarhus University,
Ny Munkegade 120,
8000
Aarhus C,
Denmark
4
Max-Planck-Institut für Radioastronomie,
Auf dem Hügel 69,
53-121
Bonn,
Germany
5
Astronomical Observatory, University of Warsaw,
Al. Ujazdowskie 4,
00-478
Warszawa,
Poland
Received:
21
August
2024
Accepted:
7
December
2024
Abstract
Context. U Equ is an unusual maser-hosting infrared source discovered in the 1990s. It was tentatively classified as a post-asymptotic giant branch (post-AGB) star with a unique optical spectrum displaying rare emission and absorption features from molecular gas at a temperature of about 500 K. In 2022, we serendipitously discovered that its optical spectrum had drastically changed since the last observations in the 1990s.
Aims. We aim to characterize the drastic change in the spectrum and analyze the photometric behavior of the object since 1989.
Methods. Optical high-resolution spectra of U Equ from the Southern African Large Telescope were supplemented by archival data and near-infrared photometry from the Nordic Optical Telescope. New spectral line observations with the Effelsberg 100 m radio telescope and Atacam Large Millimeter Array are presented. Radiative transfer modeling of multiple epoch spectral energy distributions was performed.
Results. No circumstellar molecular features are present in the contemporary optical spectra of U Equ. Nonphotospheric absorption and emission from neutral and ionized species dominate the current spectrum. Some of the observed features indicate an outflow with a projected terminal velocity of 215 km s−1. Broad H&K lines of [Ca II] indicate a photosphere of spectral type F or similar. For the first time, we find SiO J = 1−0 υ=1 maser emission in U Equ. Our collected photometric measurements show that the source has monotonically increased its optical and near-infrared fluxes since about the beginning of this century and continues to do so. The current rise in the optical regime is about 1 mag. Spectral energy distributions at different epochs show dusty circumstellar material that is very likely arranged in a highly inclined disk. Adopting a distance of 4 kpc, informed by the Gaia parallax of U Equ, we find that the source luminosity is about 104 L⊙. This luminosity has likely increased by a factor of a few in the last decades, which is most probably related to the drastic change in the optical circumstellar spectrum of the object.
Conclusions. The object has changed considerably in the past three decades, either due to geometrical reconfiguration of the circumstellar medium, evolutionary changes in the central star, or owing to an accretion event that started very recently in the system. Observationally, U Equ appears to resemble category 0 of disk-hosting post-AGB stars reported previously, especially the post-common-envelope binary HD 101584. It is uncertain whether the drastic spectral change and the associated optical and mid-infrared rise in brightness witnessed in U Equ are common in post-AGB stars, but this radical change may be related to the real-time onset of the evolution of the system into a planetary nebula. We find that the post-AGB star V576 Car has undergone a similar transformation as U Equ in the past few decades, which means that the phenomenon is not extremely rare.
Key words: stars: AGB and post-AGB / circumstellar matter / stars: individual: U Equ / stars: mass-loss / stars: peculiar
Numeric values used in Fig. 1, Effelsberg spectra from Fig. 2, and optical spectra of U Equ are available at the CDS via anonymous ftp to cdsarc.cds.unistra.fr (130.79.128.5) or via https://cdsarc.cds.unistra.fr/viz-bin/cat/J/A+A/682/A133
© The Authors 2024
 Open Access article, published by EDP Sciences, under the terms of the Creative Commons Attribution License (https://creativecommons.org/licenses/by/4.0), which permits unrestricted use, distribution, and reproduction in any medium, provided the original work is properly cited.
This article is published in open access under the Subscribe to Open model. This email address is being protected from spambots. You need JavaScript enabled to view it. to support open access publication.
1 Introduction
The transition of an asymptotic giant branch (AGB) star into a white dwarf (WD) is a relatively poorly known process. The post-AGB (or pre-planetary nebula; PPN) phase is expected to last about 10–105 yr (Schoenberner 1983; Miller Bertolami 2016), during which the star is thought to shed most of its outer layers and expose them to the harsh radiation of its inner core, which, with time, will cool down to become a proto-WD (Paczyński 1971). Although this phase is short compared to the main-sequence and the AGB time span, the number of evolved AGB stars in the Galaxy is large enough (e.g., Iwanek et al. 2022) for us to be able to catch some objects in this transition stage. The hallmark of this evolutionary shift, as predicted by theory, should be a steep increase in the effective temperature of the photosphere, occurring at a nearly constant luminosity. However, so far, no such objects have been firmly identified in our observations, especially at the onset of the post-AGB evolution when the star is still embedded in a cloud consisting of dust and atomic/molecular gas accumulated during the turbulent and mass-reducing AGB phase. Although a post-AGB star with increasing effective temperature (Teff) cannot yet fully photoionize this circumstellar envelope (which only occurs in the planetary nebula, PN, phase) the evolution off the AGB should have a significant impact on that environment. The effect on the circumstellar medium may be easier to spot than the direct change in the photospheric temperature. In practice, the circumstellar environments of stars classified as post-AGB display an enormous level of complexity (cf. Sanchez Contreras et al. 2022), often caused by interactions with a companion, so that genuine changes caused by the actual evolution of the star may not be easy to recognize.
U Equ (Barnbaum et al. 1996) and V576 Car (Couch et al. 2003) must be some of the most bizarre objects classified as post-AGB stars. When observed at optical wavelengths in the 1990s, their spectra displayed strong molecular bands in absorption (in both objects) or in both emission and absorption (U Equ). The bands arise in warm (≲ 1000 K) molecular gas located relatively close to the stars, which are strongly obscured by dust along our line of sight. Despite the severe obscuration, the main stellar component in both objects was classified as type F–K, which is too hot to be typically associated with circumstellar environments rich in molecules, especially close to the stellar photospheres. U Equ and V576 Car have indeed long been considered very unusual. We focus here especially on U Equ, which showed molecular electronic bands of various metal oxides in emission, most prominently from TiO and VO. This is a very rare spectroscopic feature, and only a handful of other objects have been reported to possess this emission (Lloyd Evans 1997). Red nova remnants, such as V4332 Sgr, V1309 Sco, and V838 Mon, have shown this phenomenon (Kamiński et al. 2015, 2009) for years to decades after their outbursts. Several young stellar objects displayed these molecular emission features as well in relation to an accretion-driven outburst (e.g., Hillenbrand et al. 2012), but it is typically a short-lived feature in the optical spectra. The red supergiant VY CMa is the only known source whose optical spectrum has molecular emission lines permanently in emission, at least since its first spectroscopic observations (Wallerstein 1971; Herbig 1974; Phillips & Davis 1987; Kamiński et al. 2013; Humphreys et al. 2019). U Equ is sometimes singled out as an example of a noneruptive star with molecular emission bands.
To investigate the phenomenon of molecular line emission in different types of stars, we recently included U Equ in a survey in which we acquired high-resolution spectra with the High Resolution Spectrograph1 (HRS) at the Southern African Large Telescope (SALT). To our great surprise, the optical spectra acquired in 2022 and 2023 for U Equ showed a completely different appearance from those described in the literature. This dramatic change is illustrated in Fig. 1, where we compare the recent SALT spectrum to a spectrum obtained in 1994. All molecular features have disappeared and were replaced by numerous atomic lines in absorption and emission. They arise from low-ionization gas at temperatures much higher than required for the historical circumstellar spectra of U Equ. Here, we investigate the nature and cause of this remarkable transformation of U Equ. In Sect. 2, we review what was known about U Equ before our observations. In Sect. 3, we present photometric data that allow us to understand the object behavior over timescales of decades. We analyze and discuss these changes in Sect. 7. Constraints on the physical characteristics of U Equ placed by Gaia observations are briefly presented in Sect. 4. Complementary observations of molecular species at millimeter and radio wavelengths are presented in Sects. 5 and 6, respectively. The SALT observations are described in Sect. 8, and the new spectra are presented and analyzed in Sect. 9. We discuss the essence of the observed changes and the nature of U Equ in Sect. 10. Therein, in Sect. 10.4, we also describe observations of the other post-AGB star that is rich in optical molecular line absorption, V576 Car, whose spectrum and photometric history have undergone changes similar to those of U Equ.
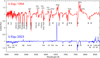 |
Fig. 1 Spectra of U Equ obtained in 1994 (top; extracted from Barnbaum et al. 1996) and in 2022– 2023 (bottom). The spectrum completely changed from being dominated by molecular absorption-emission bands and requiring low excitation temperatures into a circumstellar spectrum of partially ionized atomic gas at a much higher excitation temperature. The bottom spectrum was smoothed to match the resolution of the earlier observations. The Earth symbols mark the positions of the strongest telluric features. |
2 Prior observations and impressions of U Equ
2.1 Optical and infrared studies
Although it was first reported by Reinmuth (1925) in a list of variable stars, the modern history of U Equ can be traced back to the late 1980s, when a far-infrared (FIR) source that had been detected by the Infrared Astronomical Satellite (IRAS 20547+0247) was recognized as a host of OH and H2O masers. The maser observations of U Equ are described separately in Sect. 2.2. In addition to photometric measurements, IRAS took a spectrum of U Equ with the Low Resolution Spectrograph in the 8–22 µm range (Joint IRAS Science Working Group 1997). The spectrum was described as having a strong 10 µm silicate feature. As a bright infrared (IR) source with IRAS fluxes (epoch 1983.5) of 45.6, 33.7, 9.98, and 2.7 Jy at 12, 25, 60, and 100 µm, respectively, it was often classified as an OH/IR star. However, several authors reported that its location well below the Galactic plane, with l = −26°.11, was rather unusual for this class of stars and might indicate a halo object.
Barnbaum et al. (1996, hereafter BOM96) drew attention to U Equ when they acquired the first optical spectra of the object in 1994. Their medium-resolution spectra showed a multitude of absorption and emission features, the majority of which were assigned to electronic bands of TiO, VO, and AlO. While the emission bands were most likely produced by fluorescence, the absorption spectrum was nonphotospheric given the narrow width and low inferred excitation temperatures of the lines, that is, Tex = 700–1500 K (most of the bands were from transitions related to the ground electronic level and low vibrational states). A spectrum like this appeared very unusual to the observers at that time (cf. Lloyd Evans 1997).
Based on the observation of the 10 µm silicate feature in absorption and on IRAS colors, BOM96 postulated that U Equ has a circumstellar disk seen edge-on and that this dusty disk was obscuring the star along our line of sight. The optical molecular features were interpreted as arising in the inner parts of the circumstellar medium, but BOM96 did not locate them in the disk itself.
Little could be inferred on the photospheric spectrum of U Equ, as it was strongly contaminated by the omnipresent circumstellar features. Based on the highly contaminated spectral features present in the 1994 spectra, BOM96 proposed the central star to be a giant (luminosity class III) with a spectral type of mid-G to early-K. This was mainly based on a few absorption lines of hydrogen and of a few metals. We consider these estimates highly uncertain based on the nature and quality of their spectra. The radial velocity of the photospheric features could not be measured reliably in the spectra either.
BOM96 also combined photometric observations from different epochs to construct a spectral energy distribution (SED) of the system. While an FIR continuum excess, traced by the emission in the IRAS bands, indicated warm dust at a temperature of about 350 K, the intrinsic stellar spectrum and extinction components cannot easily be read from their data. With their preferred spectral type, however, BOM96 estimated the circumstellar reddening, E(B – V), as 0.68 mag (which corresponds to a visual extinction, AV of 2.1 mag); this is higher than their adopted interstellar reddening of E(B – V)=0.09 mag. Assuming a luminosity of 103 L⊙, from the SED, they obtained a distance of 1.5 kpc. BOM96 concluded that a dust-obscured evolved giant was the most likely identification of the star, especially given the presence of OH and H2O masers. The high Galactic latitude of the object, in their opinion, excluded a young stellar object.
Geballe et al. (2005) observed U Equ spectroscopically in the near-IR in 1997–2003. They found absorption features of CO and H2O, which arise at temperatures of 500–1000 K, similar to the temperature of the gas probed by the optical bands of metal oxides. The resolved lines had a full width at half maximum (FWHM) of 35 km s−1 and were centered at −91 km s−1 in the heliocentric rest frame (−78 km s−1 in the LSR). A weak rovibrational absorption line υ=1−0 S (1) of H2 was also observed at a similar velocity. The line ratios of the 12CO and 13CO isotopologs suggest a 12C/13C ratio of 4, but corrected for opacity effects, it may be significantly higher. The value of 4 would be very perplexing in an O-rich object. Geballe et al. (2005) estimated column densities for the three molecular species. The values they obtained (e.g., 2 × 1020 cm−2 for CO) appear to be too low compared to what would be inferred from the circumstellar extinction of AV = 2 1 mag assumed by BOM96. One possible interpretation is an extremely low dust content in the circumstellar material, which would contradict the FIR excess, but the uncertainties in both quantities are very large. The central velocity of the absorption lines was interpreted by Geballe et al. (2005) as representing that of the stellar photosphere. However, we note that the width and excitation temperature characterizing these lines readily imply a circumstellar origin.
Several imaging experiments in the visual and infrared, including one with the Hubble Space Telescope (HST) and Very Large Telescope (VLT), did not spatially resolve the U Equ system (Barnbaum et al. 1996; Geballe et al. 2005; Siódmiak et al. 2008; Lagadec et al. 2011).
2.2 Masers in the OH/IR phase
The masers in U Equ have long been thought to be very unusual. The H2O and OH masers have been observed in U Equ at least since 1985 (Zuckerman & Lo 1987) and have been known to be variable in intensity and velocity. While variability is a common phenomenon for maser lines, the variability observed toward U Equ was quite remarkable. The first observations of the H2O 22 GHz masers revealed a single-peak spectral feature at VLSR = −75.0 km s−1. However, later observations in 1995 showed two weaker features, at −79.9 and −90.0 km s−1, demonstrating behavior untypical for a circumstellar maser source. The OH masers at lower frequencies have been observed much more often. In May 1987, the 1612 and 1667 MHz OH masers were observed at LSR velocities of −80.4 and −75.7 km s−1 (Sivagnanam et al. 1990), but only the 1612 MHz feature was clearly double. The OH and H2O lines showed little overlap in velocities, and only one component had a similar velocity in both species. Two components of OH 1612 MHz masers were also detected in August 1985 by Chengalur et al. (1993) at −79.4 and −75.3 km s−1 (LSR). Barnbaum et al. (1996) observed the OH 1667 MHz masers in 1995 and reported profile changes on timescales of months. No double structure, known from the earlier epochs, was found then. Etoka & Le Squeren (2004) observed both OH transitions around the same time (in 1994) and found only single-peaked features as well. In the 1994–1995 observations, the OH profile was centered near −75.7 km s−1, with an error of about a few km s−1 (the errors are not indicated in the original papers). In these observations, the OH masers were becoming weaker. The 1612 MHz emission was not detected in 1995. In a survey by Lewis (2002), the same OH transition was targeted but not detected in 1999–2001. This led B. M. Lewis to conclude that U Equ (= OH 051.3+26.1) is an example of a dead OH/IR star, a fate he predicted for all OH/IR stars on timescales of ≈ 1700 yr. Based on the OH maser observations alone, it is clear that the object was experiencing a radical change at least since the beginning of the 1990s. We compare the literature reports on the spectral positions OH and H2O maser lines in Fig. 2.
No SiO masers have ever been reported in U Equ. Deguchi et al. (2010) place only upper limits with an rms of 0.06 Jy for the J = 1−0 rotational lines in the υ =1 and 2 vibrationally-excited states in 2001. Any earlier reports would be valuable, but we were not able to find any. Post-AGB objects are almost never associated with SiO masers (Engels 2001), but we note the prominent case of the pre-planetary nebula OH231.8+4.2 containing a Mira component (Morris et al. 1987).
3 Archival photometry
To understand the transition that occurred in the optical spectrum of U Equ, we tried to reproduce its multiband light curves from all available sources. In Appendix A, we summarize and critically evaluate the archival materials that we found. The reproduced light curves are shown in Fig. 3.
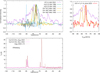 |
Fig. 2 Radio and submillimeter molecular lines in U Equ. Top left: maser emission of OH and H2O extracted from the literature data compared to the CO J = 3−2 profile obtained more recently with ALMA. The spectra were acquired with different spectral resolutions and are shown here normalized to the peak. Right: on a reduced LSR velocity axis, the spectrum of the SiO J = 1−0 υ=1 maser (red) is compared to that of the 1667 MHz OH maser (observed in 1987, orange) and to the CO J = 3−2 line (purple). Bottom: spectra of the water masers acquired recently with the Effelsberg telescope. They are shown on the absolute intensity scale to demonstrate the variability in the line fluxes. Part of the 2023 spectrum is shown scaled by a factor of 10 to better show the weak component near −61.4 km s−1 (dashed). The velocity in the heliocentric rest frame is 13.1 km s−1 lower than in the LSR frame adopted here. Some of the displayed spectra are available at the CDS. |
4 Constraints from Gaia mission
Gaia measured a U Equ trigonometric parallax of 0.1891 ± 0.0539 mas and a proper motion of (δRA, δDec) = (10.3512 ± 0.0671, −10.5706 ± 0.0447) mas yr−1 (all from DR3 Gaia Collaboration 2023). The parallax indicates a geometric distance of  kpc and a photogeometric distance of
  kpc (Bailer-Jones et al. 2021), more than two to three times larger than assumed by BOM962. We adopt here 4 kpc as a compromise between the geometric and photogeometric method. Like for many other evolved and potentially binary stars, the formal errors in both methods may be underestimated.
Then, the Galactic latitude of U Equ implies that it is located 1.9 kpc below the plane of the Galaxy, and its projected motion is mainly away from the Galactic plane; the proper motion in the Galactic frame is (δl, δb) = (−3.4, −14.4) mas yr−1. For a radial velocity of −78 km s−1 (Geballe et al. 2005), the Galactocentric motion3 of (υx, υy, υz) = (−65.0, 11.8, −282.5) km s−1 shows a relatively high speed away from the Galactic center. This means that U Equ very likely is a near-halo object, and it may therefore also be metal poor. Other halo objects have been identified near the position of U Equ (e.g. Malhan et al. 2018), and the Phlegethon stream is located nearby (Ibata et al. 2021). The interstellar extinction toward U Equ, however, is very low. Using the maps of Schlafly & Finkbeiner (2011)4, we find the most likely value E(B – V) = 0.078 mag (or AV = 0.24 mag). BOM96 adopted a similarly low reddening of 0.09mag. A more recent 3D dust map of Green et al. (2019) provides a slightly higher value, E(B – V) = 0.115 mag (or AV = 0.36 mag).
In the 120 yr between the Gaia observations and the first photographic plates, U Equ should have moved by about 1″.5. This figure is consistent with the appearance of the plates, but their seeing is of a similar order.
Gaia DR3 results for U Equ include a flux-calibrated spectrum in the range 3330–10 200 Å at a low spectral resolution. In Sect. 9 and Fig. 5, we make use of a combined BP/RP averaged spectrum.
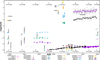 |
Fig. 3 Photometric evolution of U Equ. Data used in the figure are available in tabular form at the CDS. |
5 ALMA observations
For reference, we also extracted observations of the CO 3–2 pure rotational transition near 345.8 GHz. It was found in the archive of the Atacama Large sub-Millimeter Array (ALMA). The data were obtained for the NESS collaboration (PI P. Sciculna; Scicluna et al. 2022) on 10 August 2021 with the Atacama Compact Array (ACA) at an angular resolution of 3″.5. The data were processed with the CASA pipeline using default calibration tables. Next, data for spectral range covering the CO transition were imaged using tCLEAN with various visibility weighting schemes. In Fig. 2, we present the source-averaged spectrum of CO 3–2. With a 302 s exposure, the spectrum has a modest signal-to-noise ratio (S/N) and Fig. 2 shows a smoothed version.
The same line was observed by us with the Atacama Pathfinder Experiment 12 m submillimeter telescope (APEX) with the FLASH instrument (Heyminck et al. 2006) on 29 June 2012 and was detected at an even lower S/N of ≤10. Its intensity was close to that measured with ALMA (7.1 ± 0.5 Jy km s−1), but the uncertainties are large. This indicates, however, that the CO feature did not change much since 2012.
The ALMA dataset shows a weak continuum source of 8.07 ± 0.92 mJy (1σ error). The continuum was integrated within 330.2–333.7 and 343.2–346.2 GHz, avoiding the CO 3–2 emission. The continuum flux corresponds to an average wavelength of 885 µm.
6 Effelsberg observations
SiO maser. U Equ was observed with the 100 m Effelsberg radio telescope on 11 June 2023 using the S7mm double-beam receiver covering 40–45 GHz. The data were acquired and calibrated using standard procedures. After 47 min of observing time on source, we detected a weak (0.24 K TA) and narrow (FWHM = 1.4 km s−1) line of SiO υ =1 J = 1−0 at VLSR = −75.0 km s−1. Given the narrow width, it is readily a maser line. It is shown in Fig. 2. Although other transitions (from SiO and other molecules) were covered in the same spectrum, for example, SiO υ = 0 J = 1−0, they were not detected at a nominal rms noise level of 25 mK (TA).
H2O masers. The 100 m telescope also observed the water transition JKa,Kc = 61,6−52,3 at 22.2 GHz (or 1.35 cm) using the S14mm double-beam receiver and the WFFTS backend. On 2 November 2022, an integration of 19.5 min resulted in an rms noise of 28 mK (in TA) and displayed at least three emission lines centered at LSR velocities of −88.2, −68.3, and −66.4 km s−1; three other features are seen near −93.6, −62.8, and −53.4 km s−1 at an S/N of 6–8. The stronger lines have FWHMs between 0.6– 1.1 km s−1 , indicative of masers. The strongest component has a peak intensity of 8.7 K. The observations were repeated on 14 August 2023 with a total integration time of 29.4 min and a resulting noise rms of 79 niK. The spectrum of U Equ showed much stronger lines at this later epoch. The spectra are compared in Fig. 2. In August 2023, four strong components are seen at −89.6, −87.8, −68.7, and −66.6 km s−1. A weaker line is centered at −61.4 km s−1. The strongest component reaches 36.4 K at the peak. The line widths are in the range 0.6–0.8 km s−1 but the weakest feature appears broader, with an FWHM of 1.9 km s−1. The strong variability in intensity and position of the H20 maser components is obvious between 2022 and 2023, but is even more striking when compared to the literature data (Sect. 2.2). Some of the early observations might not even cover the most redshifted components. Overall, the H20 maser components appear over the velocity range spanning from about −90.5 to −60.0 km s−1, with the midpoint near −75 km s−1, which is also the position of the SiO maser line.
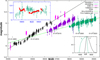 |
Fig. 4 Rise in brightness of U Equ in visual bands. The blue inset shows the variability documented by arbitrarily scaled TESS data. The inset in the lower right corner compares the transmission curves of the V and 𝑔 filters. |
7 Photometric analysis
The collected archival data in Fig.3 show that U Equ is currently brightest at visual and IR wavelengths since observations of this object started in 1904. Although it is not straightforward to compare the multiepoch data obtained in different photometric systems and without the knowledge of proper measurement uncertainties, it is apparent, especially in the visual bands, that the brightness of U Equ has monotonically increased since about 2009. The JHK measurements probe a long period (1989– 2006 and 2023), but unfortunately, they do not cover the period of the gradual visual rise well. The NOT JHK measurements from 2023 are 1.1–1.5 mag lower than in 1989, indicative of an increased near-IR flux by a factor of 2.8–4.0. The steady rise is also evident in the WISE and NEOWISE observations, but it is visibly steeper in the W1 band, that is, at shorter wavelengths.
The steady rise is best documented by combined observations obtained with different visual filters, but it is not covered entirely by consecutive observations in a single band. The visual rise is shown in more detail in Fig. 4. There, linear fits to the Catalina V data after 2006 and to all ASASSN 𝑔-band data demonstrate that the rise was steeper at its onset and has flattened at the time of the most recent observations. The total magnitude change in the visual is probably ≳ 1 mag. Although at a low photometric accuracy, the rise appears to be relatively steady, the TESS data show small-amplitude flux variations of ≈5% on a timescale of days, as shown by the inset in Fig. 4.
To illustrate changes in the SED of U Equ, we selected three effective epochs that contain mid-IR data. They are compared in Fig. 5. We compiled the SEDs from the data presented in Appendix A.
Epoch 2023. The 2023 compilation is defined by the epoch of the NOT JHK measurements on 25 April 2023. We extrapolated the NEOWISE data to the same date by fitting linear functions to NEOWISE data alone. We assigned these points large uncertainties of 0.5 mag, which reflect the fit and the large scatter in the input data. We selected ASASSN 𝑔-band measurements from two dates closest to the date of the NOT observations (22 and 29 May) and averaged them to obtain a representative optical wavelength value. Finally, we also added to the SED the ALMA continuum measurement from 2021. Although it was obtained nearly 2yr earlier, the submillimeter flux is not expected to have changed much. Even with a large uncertainty, its addition to the 2023 SED places useful constraints on the models attempting to explain the source energetics in the most recent epoch.
Epoch 2010. For the defining moment of the 2010 SED, we selected the epoch of WISE observations in all four bands. Nearly simultaneous with the WISE measurements (within a week), observations were made in the yz bands as part of PAN-STARRS and in V within the Catalina survey. We also added to this epoch JHK fluxes obtained from linear interpolations between the latest measurements from the Arecibo survey and those from NOT. Again, we assigned large uncertainties to these data points.
Epoch 1989. The earliest SED worth considering is defined by the simultaneous JHKLM measurements obtained with the ESO 1 m telescope in 1989. Although the IRAS flux measurements were obtained a few years before this, we added them to the 1989 epoch as well, assuming no significant changes in the mid- and far-IR had occurred over the relevant time period. We also include the magnitude from 1990 measured on the red POSS plate.
All data used in the SEDs were corrected for the interstellar extinction, assuming AV = 0.24 mag (see Sect. 4). In order to understand the nature of the changes taking place in U Equ, we modeled these three SEDs using different dust radiative transfer tools. First, we attempted to reproduce the SEDs with models in which the central star is surrounded by a spherical shell of silicate dust. Although solutions were found, they were hardly satisfactory. The spherical models with different dust opacities always predict too strong fluxes at near-IR wavelengths, producing a spectral slope that is not observed in U Equ. Therefore, we used the grid of circumstellar SEDs compiled in Robitaille (2017) to characterize U Equ as a system with a dusty disk. Even though we used only models with four to nine free parameters, the models were too degenerate to provide solid constraints on the system parameters. The only common feature of all models is the luminosity of about 104 L⊙. The observed SEDs are too sparsely spaced to allow us to recover the geometrical configuration of the circumstellar dust.
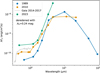 |
Fig. 5 Comparison of SEDs at three epochs and to the Gaia average DR3 spectrum. For clarity, error bars are omitted and data points are connected by lines. The connectors do not represent the actual shape of the SEDs. The ALMA measurement is omitted for display reasons. The data were corrected for interstellar extinction. |
8 Spectroscopy with SALT
We used the High Resolution Spectrograph (HRS; Crause et al. 2014) at the Southern African Large Telescope (SALT) to observe U Equ on 5, 12, and 13 May 2022, 5, 8, and 9 August 2022, and 28 May and 30 June 2023. The typical exposure time was 1862 s. The HRS is a dual-beam échelle spectrograph operating in two arms that cover 370–550 and 550–890 nm. We used the high-resolution mode with a resolution of about 65 000. Because HRS is a fiber-fed instrument with a separate fiber observing the sky at a certain angular distance from the science target, the subtraction of sky emission lines is not always perfect, which affected our spectra. The telluric lines, however, are easily recognizable when spectra from different epochs are compared at the heliocentric rest frame. The data were reduced and wavelength calibrated using an HRS pipeline5 with default settings (Kniazev et al. 2017). Échelle orders and spectra from different arms were merged. Owing to the telescope design and mode of operations, SALT observations are not calibrated in flux. The pipeline-processed spectra were thus normalized to the continuum, that is, were divided by high-order polynomials. The spectra presented here were shifted to the heliocentric velocity frame. Normalized spectra from different dates were averaged. Due to a significant difference in the heliocentric velocity correction during different observing seasons, the telluric features are severely broadened in the combined spectra. No reddening correction was applied.
9 Analysis of the visual spectra
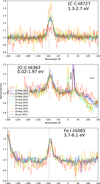
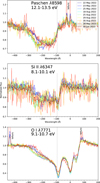
The full spectrum of U Equ averaged over all 2022–2023 exposures is shown in Fig. C.1. As mentioned, the spectrum changed dramatically since its observations in the 1990s. Instead of a plethora of molecular bands in emission and in absorption, mainly circumstellar features of atomic gas of a low ionization are visible. The atomic spectrum is very rich. We identified more than 600 features, most of which are absorption lines, but pure emission lines and composite P Cyg profiles are present as well. We identified the lines using several catalogs, chiefly from NIST6, which provides an interface for grouping lines in multiplets. A list of the identified lines is available from the authors upon request, but the identification is also graphically presented in Appendix C. The identified species include H I, Fe I, Fe II, Ti I, Ti II, Cr I, Cr II, Sr II, V I, Ca I, Ca II, Ni I, Mg I, Si I, Si II, O I, C I, N I, Ba II, Co I, K I, and Na I. We found no helium lines. Below, we highlight main groups of lines that are visible in the spectrum.
The Balmer and Paschen series of H I are clearly recognizable in the spectra of U Equ. The lowest Balmer transitions, including Hα and Hβ, have strong emission centered near a heliocentric velocity of −94 km s−1. Pure absorption is seen in lines from higher-energy levels in both series. Based on the profiles, the absorption components in most cases are nonphotospheric and form in an outflow crossing the line of sight. Additionally, Hα has a complex emission-dominated profile with extended wings (≈50 Å wide at the base) that were very likely formed due to photon scattering on electrons in the recombining plasma. Although Hα is the strongest emission feature in the entire spectrum by far, it only contributes 9% to the total flux in the R band. The Hβ line has a classic P Cyg profile, but photospheric absorption may be recognizable in the blueshifted part.
The only other lines showing broad emission wings comparable to those of Hα are lines of the Ca II IR triplet (rest wavelengths at 8498, 8542, and 8662 Å). These lines have complex profiles, with multiple overlapping absorption components. Additionally, each line of the triplet is contaminated by H emission of the Paschen series.
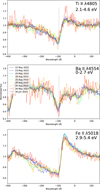
The H&K lines of Ca II near 3950 Å are dominated by broad absorption components. These photospheric features are somewhat contaminated in the line cores by circumstellar emission. By comparing H I and Ca II H&K features to a grid of stellar spectra with known spectral types, we find that a type close to F6 best represents U Equ’s photosphere. However, all F types and early-G types of different luminosity classes match these noisy photospheric features comparably well. In Fig. 6, spectra of U Equ and two other F-type stars are compared. The stellar photospheric temperature is likely about 5700 K, but the small number of photospheric features and a modest S/N make this number very uncertain.
Spectral features of CNO elements are of special interest. Neutral carbon is seen through the forbidden emission near 8725 Å. Other lines of C I may be present, but lack an unambiguous identification. No features of N I were found. Neutral oxygen is traced with two [O I] emission lines near 5577 (weak), 6300, and 6363 Å, and with three permitted multi-plets in absorption. The upper energy levels of the triplets at about 7775 and 8446 Å lie near 11 eV, while the weaker multiplet near 6155 Å arises from relatively highly excited (13 eV) states. These features are dominated by absorption, and because the lines of a given multiplet blend, they form very distinct wide features, known to spectroscopists mainly from spectra of post-AGB stars. Future studies may attempt to derive the relative abundances of the CNO elements in the circumstellar gas using these CNO tracers.
By the number of individual transitions, the spectrum is dominated by lines of Fe I–II (≈270 lines) and of Ti I–II (≈170 lines). (We find no forbidden lines of Fe II.) These rich spectra hinder a unique identification of individual lines. The Fe and Ti spectra primarily show absorption at shorter wavelengths and pure emission in the red part of our spectra, but mixed, P Cyg, profiles are also observed. Chromium, Cr I–II, has a similar spectrum. The analysis of the Fe I pure emission lines under the assumption of local thermodynamic equilibrium (LTE) presented in Appendix D suggests that the neutral gas is excited at a temperature of about 4200 K.
Several lines from the ground level are observed. Of these, the Na I doublet, studied in more detail below, is the most complex and displays several absorption components that overlap with weak emission. The K I optical doublet is present as well, mainly in weak absorption, but is severely contaminated by telluric features. Two resonance lines of Ba II at 4554 and 4934 Å are identified in absorption. Other clear resonance lines include the absorption lines of Ti I, Sr II, and Fe I. The resonance lines of Fe I have double profiles.
Based on the described characteristics of the optical spectra, the circumstellar medium of U Equ has a low ionization degree, but is certainly more ionized than it appeared 28 yr ago. A low-ionization circumstellar spectrum like this is common among post-AGB stars. In Appendix C, we compare the 2022–2023 average spectrum of U Equ to that of the post-AGB star HD 101584 (Olofsson et al. 2019). The spectrum of HD 101584 that we use was extracted from the Xshooter Spectral Library7 (XSL; Chen et al. 2014). The visual spectrum of HD 101584 has been well described in the literature, for instance, in Sivarani et al. (1999, 2001) and in Kipper (2005)8. The spectra of UEqu and HD 101584 are remarkably similar in terms of the presence of atomic features and their general profiles, that is, when a feature has a P Cyg profile in U Equ, it often has this type of profile in HD 101584 as well. Some differences exist and are partially related to the better quality of the Xshooter spectrum. A few pure absorption and pure emission features can be found in HD 101584, but not in U Equ. Some of the differences can be attributed to the difference in the relative abundances of the CNO elements, but a dedicated study would need to confirm this. There are other spectra of well-known post-AGB stars that are very similar to what is currently observed in U Equ, including the spectrum of the protoplanetary nebula M1-92 (Minkowski’s Footprint Arrieta et al. 2005), which has an F2 central star.
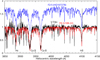 |
Fig. 6 Comparison of the spectra of the F-type stars HD167278 (blue) and G188–222 (red) from XSL to the current spectrum of UEqu (black). U Equ is likely to have a spectral type F as well. |
9.1 Kinematic components
As mentioned, Hα, Hβ, and the Ca II IR triplet contain an absorption component centered at a heliocentric velocity −94 ± 3kms−1 and with an FWHM of about 26 ± 5kms−1. This is shown in Fig. E.1. This component extends below the local continuum level in several of these lines, which means that it definitely represents an absorption component and not a gap between two emission components. At the same velocity appears the red edge of some absorption lines, for instance, that of the Paschen lines (Fig. E.3) and the Na I doublet (Fig. E.4), but not of the absorption lines of Si II whose blue edge lies at a velocity that is a few kms−1 higher. Near −94kms−1 also lies the crossover point from emission to absorption for several P-Cygni profiles, for instance, in the profile of K I (Fig. E.4; but not in the P-Cyg profiles of Fe II); the same velocity is also exactly in between the two absorption components of some of the Fe I lines, which display a double absorption feature (e.g., Fig. E.4). The heliocentric velocity of −94kms−1 corresponds to an LSR velocity −81 km s−1, which is close to the velocity of the blue component of the 1612 MHz OH maser observed in 1987 and to the red component of the H2O maser observed in 1995 (see Sect. 2.2). Based on the inventory of optical lines in which the component is seen, it may represent the coolest circumstellar gas on the line of sight toward the star. Hereafter, we call it component A.
Pure emission lines such as those of [C I] λ8727 and [O I] λ6363 are centered at a heliocentric velocity of −87 ± 2kms−1, that is, they are redshifted with respect to the absorption component described above by ≈7kms−1. The center of the pure emission lines is also the crossover point between absorption and emission in the P-Cyg lines of Fe II and Ti II (Fig. E.5); it also sets the red edge of absorption in Si II (Fig. E.3). Converted into an LSR velocity of −74 km s−1, it matches the position of the red component of the OH masers and the position of the water masers observed in 1986 very well (see Sect. 2.2); it also matches the velocity of the SiO maser discovered in U Equ in 2023 and the midpoint of the H2O maser components detected with the Effelsberg telescope (Sect. 6). Hereafter, we call it component B.
The CO line observed by ALMA is centered exactly between components A and B. It is uncertain which (if any) of thes represents the systemic velocity of U Equ, but since millimeter-wave emission of CO is undoubtedly thermally excited and is not subject to circumstellar extinction, it may best represent the average systemic velocity. Unfortunately, the absorption lines that we interpret as photospheric are too strongly contaminated and the S/N is too low to provide the stellar velocity. However, the cross correlation of the average spectrum near the Ca II H and K lines against a synthetic spectrum of a giant with an effective temperature of 6000 K yields a heliocentric velocity of −96.8 ± 24.8 km s−1. The large uncertainty means that this result is of limited use, but the stellar velocity seems to be closer to component A. This is puzzling because circumstellar SiO masers are usually considered to be very good indicators of the stellar velocity. There might be two or more dynamical centers of the system, for instance, two stars, which could account for this complex kinematic structure.
Many of the lines of neutral and ionized species contain a broad absorption feature that in some cases is combined with emission, forming classical P-Cyg profiles. This is undoubtedly the signature of an outflow. In the hydrogen lines of the Paschen series, as well as in Na I, Fe II, Si II, and the two O i triplets the absorption component spans from approximately −85 down to nearly −300 km s−1 (see Figs.E.1–E.5). The outflow thus has a maximum (projected) expansion velocity of 215 km s−1. This value is comparable to the escape velocity of a giant of about one solar mass and a radius of 5−10R⊙. Not all absorption tracers reach this high velocity. For instance, the main absorption component in the resonance line of Fe I λ5110 only extends to an expansion velocity of 35km s−1 (Fig.E.4). It would thus appear that the high-velocity outflow is mainly visible in lines requiring higher excitation. This is not a strict rule, however, because the high-velocity component is readily seen in the doublet of Na I, an element that is highly ionized at higher temperatures.
9.2 Reddening
In both lines of the sodium D1D2 doublet, we find an additional absorption component centered at a heliocentric velocity of about −8 km s−1 with an FWHM of 13 km s−1 (at an instrumental FWHM of about 7.5kms−1, its intrinsic with is 10.6kms−1). This narrow component, although weak (with an equivalent width, EW, of 0.034 A), is also recognizable in the K I resonance lines (see Fig. E.4), but not in other lines. It may represent a cool circumstellar or interstellar component. Given the Galactic position of U Equ, the low radial velocity of this component supports its interstellar origin. An H I spectrum at 21 cm toward U Equ obtained by the Leiden-Argentina-Bonn survey (Kalberla et al. 2005) shows a single feature at the same velocity as the sodium lines. The depth of the component in both lines of NaI is nearly the same, with EWs of 0.269 and 0.229 Å. Because the line ratio in the optically thin case should be 2.0, the observed lines must be saturated. The line of K I, however, is optically thin. Using the E(B – V) versus EW calibration from Munari & Zwitter (1997) for Na I and K I, we obtain E(B – V) of 0.10 ± 0.2mag or AV ≈0.3 mag. This extinction is slightly higher than derived from the extinction maps in Sect. 4.
We also attempted to constrain the total extinction by comparing the intensities of the Balmer lines. The Balmer lines are too complex to disentangle emission and absorption, and the entire normalized profiles were measured for the comparison. The corresponding continuum levels (of 2.08 ± 0.05 and 2.34 ± 0.06 in units of 10−14 erg cm−2 s−1 A−1) were taken from flux-calibrated Gaia spectra near the two lines. The Hα to Hβ flux ratio we obtain, 3.0 ± 0.1, is within the uncertainties consistent with the case B ratio of these lines at temperatures between 5000–10000 K. It is thus consistent with none or minimum extinction between us and the recombining gas, wich agrees with the AV = 0.24 mag we assumed.
10 Discussion
10.1 Are the molecules gone? Not quite
The main result of this study is the realization that U Equ has undergone a major transition and lost its unique molecular optical spectrum that drew attention to the object in the first place. The disappearance of molecules could be perhaps most naturally explained if intensified or hardened radiation of the central star (or stars) completely dissociated the molecules in the cir-cumstellar environment. However, our observations at longer wavelengths, obtained with ALMA and the Effelsberg telescope, seem to contradict this naive interpretation.
The ALMA observations show that some cool molecular gas remains around U Equ. Estimating its mass would require information on the (distance and) gas temperature, which is not available at the moment. The survival of this cool molecular gas with the simultaneous disappearance of optical molecular bands may suggest that perhaps only the inner parts of the molecular envelope or disk were dissociated. The weak rotational emission in CO 3–2 also shows that the cool molecular outflow has a higher expansion velocity than assumed in the literature for the wind of U Equ (based mainly on OH maser spectra). Half of the full width of the CO line is about 30 km s–1, consistent with normal winds of AGB stars and OH/IR objects. Our Effelsberg observation of the water maser lines show that the masers are still present tin the system, but they display a most bizarre variability. Circumstellar H2O masers are often linked to shocks (e.g., Tafoya et al. 2014), but are known to be present in systems with a relatively hard spectrum, for instance, near high-mass protostars.
The rather surprising discovery of an SiO maser (v = 1) made with the Effelsberg telescope complicates the picture even further because for an evolved star, the masing action is expected to occur at only a few stellar radii from the stellar surface, as typically observed near M-type giants and supergiants (see, for example Cotton et al. 2004; Reid & Menten 2007). Optical spectra definitely show a hotter photosphere in U Equ, of F type (Sect. 9) or even hotter if the unconstrained SED models can be credited (Sect. 7). Any imaginable drastic deactivation of the molecular emission, which is seen in the optical and at an excitation temperature of ≈500 K, would also likely switch the SiO maser off. These paradoxa can partially be explained if U Equ is a binary and contains an M-type mass-losing giant whose luminosity is at least one order of magnitude lower than that of the F-type giant and thus does not show any photospheric features. Then, the observed spectral changes would be related to a clearing of the surroundings of the hotter star, while leaving the envelope of the M giant unaffected. However, we find this interpretation rather unlikely because an M giant with a wind thick enough to produce an SiO maser (densities of 109 cm−3) would also be luminous and should show some spectral features in the optical SALT spectra.
Alternatively, SiO may arise in a disk or disk-wind, like in the peculiar young stellar object Source I in the Orion Kleinmann Low nebula (KL; Matthews et al. 2010; Issaoun et al. 2017). Therein, the central source is thought to be a progenitor of a B-type star (Goddi et al. 2011; Ginsburg et al. 2018) and may be characterized by a radiation field that is harsher than that of M-type giants and closer to that of the main stellar component of U Equ. The SiO masers are excited in an expanding and rotating disk-wind region with a size of 40 AU with a possible involvement of circumstellar shocks. Because Source I belongs to a disintegrated multiple system whose former members depart from a place of a major eruption that took place ≈500 yr ago, it was proposed that Source I underwent a major dynamical interaction at this time (Gómez et al. 2008). Some authors even proposed that Source I is the product of a merger (Farias & Tan 2018). SiO masers such as those in Source I are very rare, however (Zapata et al. 2009). The questions now are whether U Equ is in some aspect similar to this rare occurrence of circumstel-lar SiO masers, whether the transition in U Equ has triggered the maser emission only recently, and what the relation is of the SiO maser to the OH and H2O masers observed decades ago in U Equ. Although much is unclear, it is apparent that U Equ is important for our understanding of maser evolution in post-main sequence systems.
U Equ has lost its molecular emission bands that sparked interest in this object in the 1990s. Now, only a handful of objects remain with this type of spectrum. Lloyd Evans (1997) discussed this small, but diverse group of objects, which includes the RV Tauri stars and the red supergiant VY CMa. However, in the 26 yr since that discussion, the list of objects has grown somewhat longer. VY CMa remains the poster child of this phenomenon, with variable but persistent emission bands of TiO, AlO, ScO, and VO (Wallerstein & Gonzalez 2001; Kamiński et al. 2013). The Galactic red nova remnants, V838Mon, V4332 Sgr, V1309 Sco, products of stellar merger events, show similar emission bands (e.g., Kamiński et al. 2015), but they are fading on timescales of decades. A few young stellar objects display emission bands after outbursts (Herczeg & Hillenbrand 2014; Hillenbrand et al. 2012), but they are usually weak and fade away relatively fast. Mira stars also occasionally show transient emission bands from material that is shocked by pulsations (e.g., Kamiński et al. 2016). Molecular emission bands are therefore a very rare and for most objects a short-lived transient phenomenon. This was likely the case of U Equ.
10.2 Nature of the photometric rise
The remarkable reconfiguration of the optical spectrum associated with the seemingly modest ≈1 mag change in the optical and near-IR fluxes could have been caused by several phenomena. It appears to be possible that the change was simply caused by a geometric effect, namely, a reorganization of the circum-stellar medium on the line of sight due to disk rotation or inhomogeneous and anisotropic mass loss. In some scenarios, a reconfiguration like this would change the extinction and optical spectrum without any major changes in the physical properties of the star. However, the simultaneous rise at visual and mid-IR bands that we observe (with the caveat that the behavior at longer wavelengths is unknown) could suggest an increase in the bolometric luminosity of the object. Therefore, we rather favor a scenario in which the transition was more fundamental than a very small change in the circumstellar arrangement along the line of sight. We find it more likely that it is related to a major change in the circumstellar medium and to an increase in the total luminosity of the system due to physical changes in the star or due to activation of an accretion episode (on the main star or on its hypothetical companion).
The amplitudes of the rise in photometric brightness in the visual and near-IR bands that we find in U Equ are higher than the amplitudes of typical long-term flux changes in other post-AGB stars. Photometric monitoring projects targeting several post-AGB stars show typical optical variations of ≲0.5 mag (e.g., Mesler & Henson 2008; Arkhipova et al. 2010; Hrivnak et al. 2010, 2022). There are reports of changes that reach a higher amplitude, but these are almost always short-lasting drops in brightness with unremarkable changes in the optical spectrum. They can often be ascribed to eclipses, trivial episodes of obscuration (e.g., by dusty wind material), or to pulsations (cf. Sahin & Jeffery 2007; Hrivnak et al. 2022). These cases do not require any activation of an additional energy source. The case of UEqu is different because it has shown a continued, monotonic, long-lasting rise by 1 mag associated with a dramatic change in the visual spectrum. A high-amplitude monotonically rising brightness like this is certainly uncommon among post-AGB objects, as it requires an additional energy sources. Even if the relative change in the magnitudes scale is not huge, like ≈1 here, it implies an increase in flux by a factor of a few, which at the luminosity of 104 L⊙ implies a considerable amount of additional energy.
The possibility that we caught the central star of U Equ at the onset of the fast transformation from an AGB object into a proto-WD is most fascinating. However, with the current data, we have no solid evidence of an increasing temperature at a nearly constant luminosity of the star. The quality and coverage of the available data is insufficient. However, we calculate that a blackbody with a fixed luminosity would increase its optical flux near 5000 Å with an increasing temperature, which means that the observed photometric changes we observe are consistent with an early transformation on the post-AGB. (E.g., a change from 4000 to 8000 K increases the flux by a factor of 2.3.)
The best observed fast transition in post-AGB stars is a manifestation of a late He flash, where a cooling central star of a planetary nebula returns to a configuration with a temperature and luminosity characteristic of a post-AGB object. Several such born-again (also known as late-thermal-pulse) objects are known (e.g., V4334 Sgr, V605 Aql, and FG Sge), and they all are quickly evolving carbon stars (e.g., Van Winckel 2003). UEqu is a descendant of an O-rich OH/IR star (thus likely more massive than carbon stars), and the characteristics of its photometric changes cannot be ascribed to a late He-shell flash. A thermal pulse in an evolved massive AGB is another scenario that can be considered for U Equ, but is hard to verify with the data currently in hand.
Like in many other post-AGB stars, we may be witnessing in U Equ an activation of an accretion episode that increased the luminosity of the system, possibly triggered by binarity and matter being accreted from a circumbinary disk. These systems are often associated with fast jets (Bollen et al. 2022). There is no direct evidence of a binary companion to U Equ, but there hardly ever is for post-AGB stars with dwarf companions of a much lower luminosity. Any observational indication of jets in U Equ would confirm active accretion episodes, and thus can explain some of the changes seen in this object over the past decades. The short-term low-amplitude light variations observed in U Equ by TESS (Sect. 3) are similar to the flickering observed in accretion-active sources (Scaringi et al. 2015), supporting our hypothesis of activated accretion.
10.3 U Equ as a post-AGB object
The general observational characteristics of U Equ, primarily its SED and its spectral type, make it most similar to the class of post-AGB and post-RGB objects known to harbor dusty disks. This class of objects has recently been reviewed by Kluska et al. (2022). More specifically, U Equ resembles their category 0 sources, which are associated with disks seen at high inclinations. If confirmed as a member, U Equ would be the first halo object in this group. The post-AGB systems discussed by Kluska et al. (2022) show a chemical anomaly whereby refractory metals are underabundant in the stellar atmosphere due to selective accretion from a circumbinary disk. Future studies of U Equ should investigate whether it displays a similar chemical peculiarity.
As noted in Sect. 9, we find a particularity strong resemblance of the contemporary spectra of U Equ to those of the post-common-envelope binary system HD 101584. Multiple lines in the spectrum of HD 101584 are variable (Kipper 2005) at a level similar to the changes observed in our SALT spectra. The spectral features arising in the circumstellar medium of HD 101584 have multiple components, with a maximum projected expansion velocity of 130 km s−1. This velocity is only slightly lower than the extreme components of UEqu (215 km s−1), and it is comparable to the outflow velocity measured for many strong absorption lines (it is very likely that we look at the two systems from different angles, and projection effects are important). The central stars of both systems may also be similar. Early UV spectra of HD 101584 seemed to suggest a hot B9 II star (Bakker et al. 1996), but later studies, based mainly on visual data, preferred a cooler star, of spectral types A–F (Kipper 2005), which again agrees with what we know about U Equ. HD 101584, just like U Equ, has OH 1667 MHz masers.9 They are located in a bipolar structure and display exceptionally broad line profiles (te Lintel Hekkert et al. 1992). The projected OH expansion velocity of 42 kms–1 is much lower than the velocity of the CO outflow traced at (sub)millimeter wavelengths (Olofsson et al. 2019) and the outflow probed by optical lines. These unique masers bear strong resemblance to the unusual masers of UEqu (except for the spatial distribution, which for UEqu is unknown; see Sect.2.2). It is unclear whether HD 101584 has ever gone through spectral and photometric transformations such as those reported in this paper for UEqu. Because HD101584 has been considered to be a rare example of a system that has recently gone through a common-envelope phase (Olofsson et al. 2019), we should consider UEqu as another unique system of similarly interesting recent evolution and therefore worth of further studies.
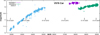 |
Fig. 7 Visual light curve of V576 Car extracted from ASAS and ASASSN data. The rise in brightness has continued since at least 1989 (Couch et al. 2003). |
10.4 V576 Car
The closest known analog to UEqu as it was known to 1990s observers is V576 Car ( = IRAS 08182–6000). Its optical spectrum, dominated by molecular absorption bands, but devoid of emission features seen earlier in U Equ, was described in detail in Couch et al. (2003). The circumstellar absorption bands of all the main electronic systems of TiO, AlO, and VO were seen in the spectra of V576 Car. The underlying stellar photosphere was not easy to identify (as in U Equ), but the best efforts indicated an F–G supergiant, similar to what we find for U Equ (Sect. 9). Additionally, Couch et al. (2003) reported that the J-band fluxes monotonically increased over the 1990s, totaling to a 2.5 mag amplitude over 10 yr. We found that visual photometric data display a continuation of this rise in brightness over the past two decades by another 2.5 mag. The data taken from the All Sky Automated Survey (ASAS; Pojmanski 1997) and ASAS-SN sky patrol are presented in Fig. 7. The steady rise in brightness seen in V576Car is reminiscent of the light curve of UEqu, although the amplitude is larger. Additionally, TESS data for V576Car (not shown) display the same small-amplitude erratic variability as that we found in U Equ (Fig. 4). Most importantly, when we obtained a spectrum of this object on 16 May 2023 with HRS-SALT, the absorption bands of the molecules had completely disappeared and been replaced by a spectrum that is remarkably similar to the current spectrum of U Equ. The contemporary spectra of both objects are shown together in Fig. C.1. With little doubt, the changes in both stars are very similar and in both cases resulted in an object with a spectrum that is now more typical for post-AGB stars. The question that arises is how common the behavior is when a post-AGB star switches from a spectrum dominated by molecular bands into the atomic spectrum. The absence of masers around V576 Car (Couch et al. 2003) needs to be revisited with new sensitive observations.
A larger sample of stars exhibiting the U Equ phenomenon would definitely help to understand the nature of the changes better. Smith (2006) searched the southern sky for objects with similar characteristics to UEqu and V576Car (i.e., as it appeared in the 1990s) but found none that would exhibit cir-cumstellar molecular features. The phase in which U Equ and V576 Car were caught must therefore be short, as expected for fast-evolving dust-embedded post-AGB stars. Perhaps future searches can focus on the steady rise in brightness over timescales of ≳ 3 decades as the identifying feature of the U Equ phenomenon.
10.5 Summary and outlook
More observations are needed to explain the changes in UEqu and V576 Car. Continued photometric and spectroscopic monitoring can reveal for how long and to what end the reported changes will occur. Multiwavelength observations and interfer-ometric imaging would be particularly useful for understanding the current configuration of the star or binary with respect to the disk and other circumstellar features. We should be also searching for more objects experiencing the UEqu phenomenon because these studies have the potential to expose the genuine and long-sought transition from AGB or OH/IR phase into a planetary nebula, or they can deepen our understanding of common-envelope interactions.
Acknowledgements
T.K. acknowledges funding from grant SONATA BIS no. 2018/30/E/ST9/00398 from the Polish National Science Center. K.I. was supported by Polish National Science Center grant Sonatina 2021/40/C/ST9/00186. Based on observations collected at the European Organization for Astronomical Research in the Southern Hemisphere under ESO program 266.D-5655(A). This work made use of the HDAP which was produced at Landessternwarte Heidel-berg-Konigstuhl under grant no. 00.071.2005 of the Klaus-Tschira-Foundation. Some observations reported in this paper were obtained with the Southern African Large Telescope (SALT). Polish participation in SALT is funded by grant no. MNiSWDIR/WK/2016/07. Based on data from the OMC Archive at CAB (INTA-CSIC), pre-processed by ISDC and further processed by the OMC Team at CAB. The OMC Archive is part of the Spanish Virtual Observatory project. Both are funded by MCIN/AEI/10.13039/501100011033 through grants PID2020-112949GB-I00 and PID2019-107061GB-C61, respectively. This research has made use of the SIMBAD database, operated at CDS, Strasbourg, France. This research made use of hips2fits, https://alasky.u-strasbg.fr/hips-image-services/hips2fits a service provided by CDS. This paper makes use of the following ALMA data: ADS/JAO.ALMA#2019.2.00120.S. ALMA is apartnership of ESO (representing its member states), NSF (USA) and NINS (Japan), together with NRC (Canada), MOST and ASIAA (Taiwan), and KASI (Republic of Korea), in cooperation with the Republic of Chile. The Joint ALMA Observatory is operated by ESO, AUI/NRAO and NAOJ. The CSS survey is funded by the National Aeronautics and Space Administration under Grant No. NNG05GF22G issued through the Science Mission Directorate Near-Earth Objects Observations Program. The CRTS survey is supported by the US National Science Foundation under grants AST-0909182 and AST-1313422. The Pan-STARRSl Surveys (PS1) and the PS1 public science archive have been made possible through contributions by the Institute for Astronomy, the University of Hawaii, the Pan-STARRS Project Office, the Max-Planck Society and its participating institutes, the Max Planck Institute for Astronomy, Heidelberg and the Max Planck Institute for Extraterrestrial Physics, Garching, The Johns Hopkins University, Durham University, the University of Edinburgh, the Queen’s University Belfast, the Harvard-Smithsonian Center for Astrophysics, the Las Cumbres Observatory Global Telescope Network Incorporated, the National Central University of Taiwan, the Space Telescope Science Institute, the National Aeronautics and Space Administration under Grant No. NNX08AR22G issued through the Planetary Science Division of the NASA Science Mission Directorate, the National Science Foundation Grant No. AST-1238877, the University of Maryland, Eotvos Lorand University (ELTE), the Los Alamos National Laboratory, and the Gordon and Betty Moore Foundation. This research has made use of the VizieR catalogue access tool, CDS, Strasbourg, France (DOI: 10.26093/cds/vizier). The original description of the VizieR service was published in Ochsenbein et al. (2000). Based on observations made with the Nordic Optical Telescope, owned in collaboration by the University of Turku and Aarhus University, and operated jointly by Aarhus University, the University of Turku and the University of Oslo, representing Denmark, Finland and Norway, the University of Iceland and Stockholm University at the Observatorio del Roque de los Muchachos, La Palma, Spain, of the Instituto de Astrofisica de Canarias This research has made use of the Spanish Virtual Observatory (https://svo.cab.inta-csic.es) project funded by MCIN/AEI/10.13039/501100011033/through grant PID2020-112949GB-I00.
Appendix A Photometric data
Appendix A.1 Visual
The Heidelberg-Konigstuhl plates reported by Reinmuth (1925) provide two measurements of a source at the location of U Equ (the coordinates of his source 95 converted into J2000 are RA = 20:57:16.31 and Dec = 02:58:44.78, i.e., within 2″ from the current position). Magnitudes of <15.5 in 1902, and of 14.5 in 1904 and 1915 were measured. These measurements are from unfiltered observations with blue photographic plates.
More Heidelberg-Konigstuhl blue plates were scanned and assigned an astrometric solution. From those available at the Heidelberg Digitized Astronomical Plates service10, we selected plates in which U Equ and nearby fields stars are readily seen. These digitalized plates are from 1902,1904,1915, and 1927, and do not show any considerable variation (within the photometric accuracy) in the brightness of U Equ compared to the field stars (see Fig. B.1). On these dates, and likely in the entire 1902–1927 period, the star did not experience any sudden flux increase by several magnitudes. It is reasonable to assume that the magnitudes stayed close to those reported by Reinmuth, that is, near 14.5 mag, in the first quarter of the twentieth century. Some variability was reported, however, since the star received a variable star designation.
Plates of the first Palomar Observatory-National Geographic Sky Survey (POSS) provide two measurements in 1951, 16.05 mag on a red E plate and 21.77 mag on a blue O plate. These magnitudes were measured by McMahon et al. (2000). The second POSS survey yielded a red magnitude of 13.86 in September 1990, a blue magnitude of 15.88 in June 1993, and I = 12.41 in August 1994 (Monet et al. 2003). The same catalog specifies the first-epoch red magnitude as 15.28 and not 16.05 mag. We interpret this discrepancy as a result of intrinsic uncertainties in the photometry from these plates. Based on these measurements, the photographic magnitudes did not change by more than 1 mag between 1951 and 1990.
According to Geballe et al. (2005), the visual magnitude of U Equ in 1994 was 9. No source of this measurement is given, and we find it very unlikely the star had risen to such a low magnitude, especially given the photometric constraints from the second POSS survey. Geballe at al. also reported a magnitude 13 for 1996, 1998, and 1999, but again without details of how those measurements were acquired. We include these photometric points in Fig. 3 but consider them very doubtful.
A V-band light curve spanning from 2004 to 2016 was extracted from the INTEGRAL Optical Monitoring Camera (IOMC) data11. We used their V3 measurements.
We extracted another set of visual magnitudes from the Catalina Survey12 (Drake et al. 2009) for the period 2005-2013. These are unfiltered magnitudes very roughly transformed into V.
Several measurements in the ɡrizy bands from 2009–2014 were found in the detection catalog of Pan-STARRS113 (Chambers et al. 2016). In a similar time period, measurements were taken by the AAVSO Photometric All-Sky Survey (APASS)14, mainly in the BVɡgri bands.
The ongoing Sky Patrol of the All-Sky Automated Survey for Supernovae (ASASSN)15 has been observing U Equ in Vɡ bands since 2012 (Shappee et al. 2014; Kochanek et al. 2017). We include data obtained until June 2023.
Several single-epoch measurements in various bands were found. We list them here for completeness, but not all are included in our analysis.
A Johnson B magnitude of 15.75 mag was derived from the Ukrainian glass archive (Andruk et al. 2016)16 for July 1991. This value is close to that from the blue plate POSS-II measurement of 1993.
Gaia DR3 measurements of G = 12.730 ± 0.004, BP = 13.184 ± 0.011, and RP = 12.091 ± 0.010mag. The exact epochs of these measurements are unknown.
The AAVSO archive has a single V measurement of 12.5 mag for November 2021.
Siódmiak et al. (2008) provided HST magnitudes of <14.94 and 14.12 in the F606W and F814W filters based on observations from May 2003. The F606W image was saturated.
Public data of the TESS mission are available from August and September 2022. We extracted the data using the Lightkurve package (Lightkurve Collaboration et al. 2018) and scaled the raw instrumental intensity to the corresponding observational data from ASASSN. The TESS data have a high cadence and show the short-term variability of the source better.
Multiband visual colors are mainly available for the period 2010–2013. Essentially no colors are known prior to 2005. The archival plates, although they only sparsely probe the photometric behavior, seem to indicate unchanged magnitudes in the blue and red. If there were any variations, they must have been lower than about 1 mag between 1904 and 1994. It is always possible that significant changes occurred in the large windows when no one observed U Equ.
Measurement uncertainties were rarely given in the above quoted sources. The combined photometric data are shown in Fig. 3.
Appendix A.2 Near-infrared
A collection of JHK measurements between 1999 and 2005 were taken from the Optical and Near Infrared Atlas of the Arecibo Sample of OH/IR Stars17 (Jiménez-Esteban et al. 2021). Hereafter and in Fig. 3, we call these points the Arecibo data.
Fouque et al. (1992) performed JHKLM photometry of the object in August 1989 using the ESO 1 m telescope.
BOM96 presented measurements in the J and Ks bands for October 1995. They were obtained with the Shane telescope.
The 2MASS measurements in JHKS were obtained in July 2000 (Cutri et al. 2003).
Lagadec et al. (2011) used the VISIR instrument on the ESO Very Large Telescope (VLT) on 29 June 2008 to image U Equ at 8.59, 11.85, and 12.81 µm that is, in the PAH1, SiC, and NeII filters, respectively. We transformed the measured flux densities of 21.3, 35.7, and 41.7 Jy into Vega system magnitudes of 0.94, −0.27, and −0.63, respectively, in these filters.
Observations in all four WISE bands (i.e., at W1 = 3.4, W2 = 4.6, W3 = 12, and, W4 = 22 µm) were extracted from the AllWISE Multiepoch Photometry Table18 (Wright et al. 2010). These observations were made in May and November 2010.
A much longer time sequence of photometric measurements at 3.4 and 4.6 μm was extracted from the NEOWISE Reactivation Single Exposure (L1b) Source Table (Mainzer et al. 2011). The W1 and W2 data were taken over the period from 2014 May 2014 to October 2022. For better clarity, in Fig. 3 we rebinned the data by averaging measurements obtained within seven days (the original data are shown in gray).
The most recent JHKS photometry is not archival, but was obtained by ourselves on 25 April 2023 with the NOTCam instrument (Abbott et al. 2000) at the Nordic Optical Telescope (NOT; Djupvik & Andersen 2010). The seeing during the observation was about 078. Owing to the relatively high brightness of the target, the high-resolution (HR) camera of NOTCam (0″.7079/pixel) was used and exposure times were kept short: 30 s for the J-band, 10.8 s for the H band, and 3.6 s for the KS band. Moreover, for the KS band, the telescope was slightly defocused to avoid saturation. The images were obtained by dithering in a 3×3 pattern, and they were reduced with the IRAF package notcam.cl to correct for nonlinearity, flat-field, background sky, and to finally align, shift, and calculate the median-combined images. A nearby field with six 2MASS stars, observed right after U Equ with the same setup, was used for the photometric calibration. We converted the 2MASS photometry of these stars into the Maunakea Observatory (MKO) system using the transformations in Leggett et al. (2006). Aperture photometry yielded J = 10.37 ± 0.01 mag, H = 9.05 ± 0.04 mag, and K = 7.00 ± 0.03 mag, where the errors reflect the uncertainty in the photometric calibration. The JHK systems used in earlier epochs may not be the same.
Appendix B Photographic plates
The field around U Equ was captured by photographic plates throughout the first half of the twentieth century. A sample of them is shown in Fig. B.1.
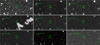 |
Fig. B.1 Sample of the Heidelberg-Königstuhl blue plates. The cutouts are centered near U Equ (encircled). The observation dates are given. For reference, a deeper POSS image is shown in the lower right corner. The images are displayed in a linear intensity scale. |
Appendix C Spectral atlas
Here we present an atlas of spectra of U Equ and V576 Car compared to that of HD 101584. Spectra of U Equ are available at the CDS.
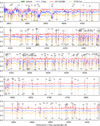 |
Fig. C.1 Average normalized spectrum of U Equ (blue) compared to that of HD 101584 and of V576 Car (orange). The main telluric bands are marked in green. The vertical dashed lines and corresponding labels identify the main spectral features (“1” corresponds to neutral atoms and “2” to the first-ionization state). |
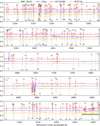 |
Fig. C.1 Continued. |
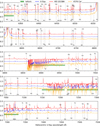 |
Fig. C.1 Continued. |
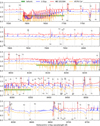 |
Fig. C.1 Continued. |
Appendix D Local thermal equilibrium analysis of the Fe I lines
Using the Saha-LTE spectrum tool available from the NIST online database, we simulated the intensities of the Fe I lines at different temperatures between 4000–10 000 K with a step of 200 K. As the calculated line intensities are measured in arbitrary units, the intensities were scaled to the relative intensity of the line near 8514 Å, which has the highest S/N and is a blend of two strong transitions. We analyzed only lines in pure emission, without blending or contamination from telluric or other features. The observed line intensities were measured in IRAF. A χ2 test was run to find the best-fitting line ratios. The test yielded a temperature of 4200 ± 200 K.
As a test of opacity, we also compared the line ratios of lines in the same multiplet with the ratios of the transition probabilities, Aki. If the Fe I emission is mostly optically thin, the scaled fluxes and Aki values should be comparable. The resulting comparison shows some agreement of the NIST models within 5σ errors, but not for all line pairs. The goodness of fit shows no trend with upper energy level, but the majority of lines used for this test originate from relatively close energy levels in range of 2–6eV. Out of the nine Fe I ratios measured, four fit well within the 5σ errors, while three more do not lie much farther from the observed values. Only two line ratios vary significantly (6230/7748 and 6494/9593). We conclude that the Fe I emission is not very optically thick.
Appendix E Line profiles
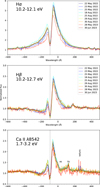 |
Fig. E.1 Profiles of the selected lines. The dotted vertical lines mark the center of the narrow absorption component discussed in the text. |
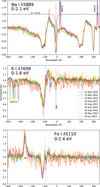 |
Fig. E.4 As Fig. E.1. Additionally, the scaled and inverted profile of the H I emission line at 21 cm is shown with a black line. The interstellar component is marked with a dashed line. |
References
- Abbott, T. M., Aspin, C., Sorensen, A. N., et al. 2000, SPIE Conf. Ser., 4008, 714 [NASA ADS] [Google Scholar]
- Andruk, V. M., Pakuliak, L. K., Golovnia, V. V., et al. 2016, Kinematics Phys. Celest. Bodies, 32, 260 [CrossRef] [Google Scholar]
- Arkhipova, V. P., Ikonnikova, N. P., & Komissarova, G. V. 2010, Astron. Lett., 36, 269 [NASA ADS] [CrossRef] [Google Scholar]
- Arrieta, A., Torres-Peimbert, S., & Georgiev, L. 2005, ApJ, 623, 252 [NASA ADS] [CrossRef] [Google Scholar]
- Bailer-Jones, C. A. L., Rybizki, J., Fouesneau, M., Demleitner, M., & Andrae, R. 2021, AJ, 161, 147 [Google Scholar]
- Bakker, E. J., Lamers, H. J. G. L. M., Waters, L. B. F. M., & Waelkens, C. 1996, A&A, 310, 861 [Google Scholar]
- Barnbaum, C., Omont, A., & Morris, M. 1996, A&A, 310, 259 [NASA ADS] [Google Scholar]
- Bollen, D., Kamath, D., Van Winckel, H., et al. 2022, A&A, 666, A40 [NASA ADS] [CrossRef] [EDP Sciences] [Google Scholar]
- Chambers, K. C., Magnier, E. A., Metcalfe, N., et al. 2016, ArXiv e-prints [arXiv:1612.05560] [Google Scholar]
- Chen, Y.-P., Trager, S. C., Peletier, R. F., et al. 2014, A&A, 565, A117 [NASA ADS] [CrossRef] [EDP Sciences] [Google Scholar]
- Chengalur, J. N., Lewis, B. M., Eder, J., & Terzian, Y. 1993, ApJS, 89, 189 [NASA ADS] [CrossRef] [Google Scholar]
- Cotton, W. D., Mennesson, B., Diamond, P. J., et al. 2004, A&A, 414, 275 [NASA ADS] [CrossRef] [EDP Sciences] [Google Scholar]
- Couch, P. A., Lloyd Evans, T., & Sarre, P. J. 2003, MNRAS, 346, 153 [NASA ADS] [CrossRef] [Google Scholar]
- Crause, L. A., Sharples, R. M., Bramall, D. G., et al. 2014, SPIE Conf. Ser., 9147, 91476T [Google Scholar]
- Cutri, R., Skrutskie, M., Van Dyk, S., et al. 2003, 2 MASS All-Sky Catalog of Point Sources, NASA/IPAC Infrared Science Archive [Google Scholar]
- Deguchi, S., Shimoikura, T., & Koike, K. 2010, PASJ, 62, 525 [NASA ADS] [Google Scholar]
- Djupvik, A. A., & Andersen, J. 2010, in Highlights of Spanish Astrophysics V, eds. J. M. Diego, L. J. Goicoechea, J. I. Gonzalez-Serrano, & J. Gorgas, 211 [CrossRef] [Google Scholar]
- Drake, A. J., Djorgovski, S. G., Mahabal, A., et al. 2009, ApJ, 696, 870 [Google Scholar]
- Engels, D. 2001, Astrophys. Space Sci. Lib., 265, 417 [NASA ADS] [CrossRef] [Google Scholar]
- Etoka, S., & Le Squeren, A. M. 2004, A&A, 420, 217 [NASA ADS] [CrossRef] [EDP Sciences] [Google Scholar]
- Farias, J. P., & Tan, J. C. 2018, A&A, 612, L7 [NASA ADS] [CrossRef] [EDP Sciences] [Google Scholar]
- Fouque, P., Le Bertre, T., Epchtein, N., Guglielmo, F., & Kerschbaum, F. 1992 A&AS, 93, 151 [NASA ADS] [Google Scholar]
- Gaia Collaboration (Vallenari, A., et al.) 2023, A&A 674, A1 [NASA ADS] [CrossRef] [EDP Sciences] [Google Scholar]
- Geballe, T. R., Barnbaum, C., Noll, K. S., & Morris, M. 2005, ApJ, 624, 983 [NASA ADS] [CrossRef] [Google Scholar]
- Ginsburg, A., Bally, J., Goddi, C., Plambeck, R., & Wright, M. 2018, ApJ, 860, 119 [NASA ADS] [CrossRef] [Google Scholar]
- Goddi, C., Humphreys, E. M. L., Greenhill, L. J., Chandler, C. J., & Matthews, L. D. 2011, ApJ, 728, 15 [Google Scholar]
- Gómez, L., Rodríguez, L. F., Loinard, L., et al. 2008, ApJ, 685, 333 [CrossRef] [Google Scholar]
- Green, G. M., Schlafly, E., Zucker, C., Speagle, J. S., & Finkbeiner, D. 2019, ApJ, 887, 93 [NASA ADS] [CrossRef] [Google Scholar]
- Herbig, G. H. 1974, ApJ, 188, 533 [NASA ADS] [CrossRef] [Google Scholar]
- Herczeg, G. J., & Hillenbrand, L. A. 2014, ApJ, 786, 97 [Google Scholar]
- Heyminck, S., Kasemann, C., Güsten, R., de Lange, G., & Graf, U. U. 2006, A&A, 454, L21 [NASA ADS] [CrossRef] [EDP Sciences] [Google Scholar]
- Hillenbrand, L. A., Knapp, G. R., Padgett, D. L., Rebull, L. M., & McGehee, P. M. 2012, AJ, 143, 37 [NASA ADS] [CrossRef] [Google Scholar]
- Hrivnak, B. J., Lu, W., Maupin, R. E., & Spitzbart, B. D. 2010, ApJ, 709, 1042 [NASA ADS] [CrossRef] [Google Scholar]
- Hrivnak, B. J., Lu, W., Bakke, W. C., & Grimm, P. J. 2022, ApJ, 939, 32 [NASA ADS] [CrossRef] [Google Scholar]
- Humphreys, R. M., Ziurys, L. M., Bernal, J. J., et al. 2019, ApJ, 874, L26 [NASA ADS] [CrossRef] [Google Scholar]
- Ibata, R., Malhan, K., Martin, N., et al. 2021, ApJ, 914, 123 [NASA ADS] [CrossRef] [Google Scholar]
- Issaoun, S., Goddi, C., Matthews, L. D., et al. 2017, A&A, 606, A126 [NASA ADS] [CrossRef] [EDP Sciences] [Google Scholar]
- Iwanek, P., Soszynski, I., Kozlowski, S., et al. 2022, ApJS, 260, 46 [NASA ADS] [CrossRef] [Google Scholar]
- Jiménez-Esteban, F. M., Engels, D., Aguado, D. S., González, J. B., & García-Lario, P. 2021, MNRAS, 505, 6051 [CrossRef] [Google Scholar]
- Joint IRAS Science Working Group 1997, IRAS Low Resolution Spectra (Centre de Données astronomiques de Strasbourg (CDS)) [Google Scholar]
- Kalberla, P. M. W., Burton, W. B., Hartmann, D., et al. 2005, A&A, 440, 775 [NASA ADS] [CrossRef] [EDP Sciences] [Google Scholar]
- Kamiński, T., Schmidt, M., Tylenda, R., Konacki, M., & Gromadzki, M. 2009, ApJS, 182, 33 [Google Scholar]
- Kamiński, T., Schmidt, M. R., & Menten, K. M. 2013, A&A, 549, A6 [Google Scholar]
- Kamiński, T., Mason, E., Tylenda, R., & Schmidt, M. R. 2015, A&A, 580, A34 [NASA ADS] [CrossRef] [EDP Sciences] [Google Scholar]
- Kamiński, T., Wong, K. T., Schmidt, M. R., et al. 2016, A&A, 592, A42 [NASA ADS] [CrossRef] [EDP Sciences] [Google Scholar]
- Kipper, T. 2005, Balt. Astron., 14, 223 [NASA ADS] [Google Scholar]
- Kluska, J., Van Winckel, H., Coppée, Q., et al. 2022, A&A, 658, A36 [NASA ADS] [CrossRef] [EDP Sciences] [Google Scholar]
- Kniazev, A. Y., Gvaramadze, V. V., & Berdnikov, L. N. 2017, ASP Conf. Ser., 510, 480 [NASA ADS] [Google Scholar]
- Kochanek, C. S., Shappee, B. J., Stanek, K. Z., et al. 2017, PASP, 129, 104502 [Google Scholar]
- Lagadec, E., Verhoelst, T., Mékarnia, D., et al. 2011, MNRAS, 417, 32 [NASA ADS] [CrossRef] [Google Scholar]
- Leggett, S. K., Currie, M. J., Varricatt, W. P., et al. 2006, MNRAS, 373, 781 [NASA ADS] [CrossRef] [Google Scholar]
- Lewis, B. M. 2002, ApJ, 576, 445 [NASA ADS] [CrossRef] [Google Scholar]
- Lightkurve Collaboration (Cardoso, J. V. d. M., et al.) 2018, Astrophysics Source Code Library [record ascl:1812.013] [Google Scholar]
- Lloyd Evans, T. 1997, Ap&SS, 251, 239 [NASA ADS] [CrossRef] [Google Scholar]
- Mainzer, A., Bauer, J., Grav, T., et al. 2011, ApJ, 731, 53 [Google Scholar]
- Malhan, K., Ibata, R. A., & Martin, N. F. 2018, MNRAS, 481, 3442 [Google Scholar]
- Matthews, L. D., Greenhill, L. J., Goddi, C., et al. 2010, ApJ, 708, 80 [NASA ADS] [CrossRef] [Google Scholar]
- McMahon, R. G., Irwin, M. J., & Maddox, S. J. 2000, VizieR Online Data Catalog: I/267 [Google Scholar]
- Mesler, R. A., & Henson, G. D. 2008, J. Southeastern Assoc. Res. Astron., 2, 10 [NASA ADS] [Google Scholar]
- Miller Bertolami, M. M. 2016, A&A, 588, A25 [NASA ADS] [CrossRef] [EDP Sciences] [Google Scholar]
- Monet, D. G., Levine, S. E., Canzian, B., et al. 2003, AJ, 125, 984 [Google Scholar]
- Morris, M., Guilloteau, S., Lucas, R., & Omont, A. 1987, ApJ, 321, 888 [NASA ADS] [CrossRef] [Google Scholar]
- Munari, U., & Zwitter, T. 1997, A&A, 318, 269 [NASA ADS] [Google Scholar]
- Ochsenbein, F., Bauer, P., & Marcout, J. 2000, A&AS, 143, 23 [NASA ADS] [CrossRef] [EDP Sciences] [Google Scholar]
- Olofsson, H., Khouri, T., Maercker, M., et al. 2019, A&A, 623, A153 [NASA ADS] [CrossRef] [EDP Sciences] [Google Scholar]
- Paczyński, B. 1971, Astrophys. Lett., 9, 33 [Google Scholar]
- Parthasarathy, M., Kounkel, M., & Stassun, K. G. 2022, RNAAS, 6, 210 [NASA ADS] [Google Scholar]
- Phillips, J. G., & Davis, S. P. 1987, PASP, 99, 839 [NASA ADS] [CrossRef] [Google Scholar]
- Pojmanski, G. 1997, Acta Astron., 47, 467 [Google Scholar]
- Reid, M. J., & Menten, K. M. 2007, ApJ, 671, 2068 [NASA ADS] [CrossRef] [Google Scholar]
- Reinmuth, K. 1925, Astron. Nachr., 225, 385 [NASA ADS] [CrossRef] [Google Scholar]
- Robitaille, T. P. 2017, A&A, 600, A11 [NASA ADS] [CrossRef] [EDP Sciences] [Google Scholar]
- Şahin, T., & Jeffery, C. S. 2007, Astron. Nachr., 328, 848 [CrossRef] [Google Scholar]
- Sanchez Contreras, C., Alcolea, J., Rodriguez Cardoso, R., et al. 2022, A&A, 665, A88 [CrossRef] [EDP Sciences] [Google Scholar]
- Scaringi, S., Maccarone, T. J., Kording, E., et al. 2015, Sci. Adv., 1, e1500686 [NASA ADS] [CrossRef] [Google Scholar]
- Schlafly, E. F., & Finkbeiner, D. P. 2011, ApJ, 737, 103 [Google Scholar]
- Schoenberner, D. 1983, ApJ, 272, 708 [NASA ADS] [CrossRef] [Google Scholar]
- Scicluna, P., Kemper, F., McDonald, I., et al. 2022, MNRAS, 512, 1091 [NASA ADS] [CrossRef] [Google Scholar]
- Shappee, B. J., Prieto, J. L., Grupe, D., et al. 2014, ApJ, 788, 48 [Google Scholar]
- Siódmiak, N., Meixner, M., Ueta, T., et al. 2008, ApJ, 677, 382 [CrossRef] [Google Scholar]
- Sivagnanam, P., Le Squeren, A. M., Minh, F. T., & Braz, M. A. 1990, A&A, 233, 112 [NASA ADS] [Google Scholar]
- Sivarani, T., Parthasarathy, M., García-Lario, P., Manchado, A., & Pottasch, S. R. 1999, A&AS, 137, 505 [NASA ADS] [CrossRef] [EDP Sciences] [Google Scholar]
- Sivarani, T., Parthasarathy, M., García-Lario, P., Manchado, A., & Pottasch, S. R. 2001, Astrophys. Space Sci. Lib., 265, 295 [NASA ADS] [CrossRef] [Google Scholar]
- Smith, A. 2006, PhD Thesis, University of Nottingham, UK [Google Scholar]
- Tafoya, D., Franco-Hernández, R., Vlemmings, W. H. T., Perez-Sánchez, A. F., & Garay, G. 2014, A&A, 562, L9 [NASA ADS] [CrossRef] [EDP Sciences] [Google Scholar]
- te Lintel Hekkert, P. T. L., Chapman, J. M., & Zijlstra, A. A. 1992, ApJ, 390, L23 [CrossRef] [Google Scholar]
- Van Winckel, H. 2003, ARA&A, 41, 391 [Google Scholar]
- Wallerstein, G. 1971, ApJ, 169, 195 [NASA ADS] [CrossRef] [Google Scholar]
- Wallerstein, G., & Gonzalez, G. 2001, PASP, 113, 954 [NASA ADS] [CrossRef] [Google Scholar]
- Wright, E. L., Eisenhardt, P. R. M., Mainzer, A. K., et al. 2010, AJ, 140, 1868 [Google Scholar]
- Zapata, L. A., Menten, K., Reid, M., & Beuther, H. 2009, ApJ, 691, 332 [Google Scholar]
- Zuckerman, B., & Lo, K. Y. 1987, A&A, 173, 263 [NASA ADS] [Google Scholar]
For definitions of geometric and photogeometric distance determinations, see Bailer-Jones et al. (2021).
Whether HD 101584 is a post-RGB or post-AGB star is a matter of debate and depends on the object’s true luminosity/distance, but the post-AGB status of this F0 supergiant has been recently reaffirmed by Parthasarathy et al. (2022).
The most recent detection observations are from te Lintel Hekkert et al. (1992).
All Figures
|
Fig. 1 Spectra of U Equ obtained in 1994 (top; extracted from Barnbaum et al. 1996) and in 2022– 2023 (bottom). The spectrum completely changed from being dominated by molecular absorption-emission bands and requiring low excitation temperatures into a circumstellar spectrum of partially ionized atomic gas at a much higher excitation temperature. The bottom spectrum was smoothed to match the resolution of the earlier observations. The Earth symbols mark the positions of the strongest telluric features. |
| In the text | |
|
Fig. 2 Radio and submillimeter molecular lines in U Equ. Top left: maser emission of OH and H2O extracted from the literature data compared to the CO J = 3−2 profile obtained more recently with ALMA. The spectra were acquired with different spectral resolutions and are shown here normalized to the peak. Right: on a reduced LSR velocity axis, the spectrum of the SiO J = 1−0 υ=1 maser (red) is compared to that of the 1667 MHz OH maser (observed in 1987, orange) and to the CO J = 3−2 line (purple). Bottom: spectra of the water masers acquired recently with the Effelsberg telescope. They are shown on the absolute intensity scale to demonstrate the variability in the line fluxes. Part of the 2023 spectrum is shown scaled by a factor of 10 to better show the weak component near −61.4 km s−1 (dashed). The velocity in the heliocentric rest frame is 13.1 km s−1 lower than in the LSR frame adopted here. Some of the displayed spectra are available at the CDS. |
| In the text | |
|
Fig. 3 Photometric evolution of U Equ. Data used in the figure are available in tabular form at the CDS. |
| In the text | |
|
Fig. 4 Rise in brightness of U Equ in visual bands. The blue inset shows the variability documented by arbitrarily scaled TESS data. The inset in the lower right corner compares the transmission curves of the V and 𝑔 filters. |
| In the text | |
|
Fig. 5 Comparison of SEDs at three epochs and to the Gaia average DR3 spectrum. For clarity, error bars are omitted and data points are connected by lines. The connectors do not represent the actual shape of the SEDs. The ALMA measurement is omitted for display reasons. The data were corrected for interstellar extinction. |
| In the text | |
|
Fig. 6 Comparison of the spectra of the F-type stars HD167278 (blue) and G188–222 (red) from XSL to the current spectrum of UEqu (black). U Equ is likely to have a spectral type F as well. |
| In the text | |
|
Fig. 7 Visual light curve of V576 Car extracted from ASAS and ASASSN data. The rise in brightness has continued since at least 1989 (Couch et al. 2003). |
| In the text | |
|
Fig. B.1 Sample of the Heidelberg-Königstuhl blue plates. The cutouts are centered near U Equ (encircled). The observation dates are given. For reference, a deeper POSS image is shown in the lower right corner. The images are displayed in a linear intensity scale. |
| In the text | |
|
Fig. C.1 Average normalized spectrum of U Equ (blue) compared to that of HD 101584 and of V576 Car (orange). The main telluric bands are marked in green. The vertical dashed lines and corresponding labels identify the main spectral features (“1” corresponds to neutral atoms and “2” to the first-ionization state). |
| In the text | |
|
Fig. C.1 Continued. |
| In the text | |
|
Fig. C.1 Continued. |
| In the text | |
|
Fig. C.1 Continued. |
| In the text | |
|
Fig. E.1 Profiles of the selected lines. The dotted vertical lines mark the center of the narrow absorption component discussed in the text. |
| In the text | |
|
Fig. E.4 As Fig. E.1. Additionally, the scaled and inverted profile of the H I emission line at 21 cm is shown with a black line. The interstellar component is marked with a dashed line. |
| In the text | |
Current usage metrics show cumulative count of Article Views (full-text article views including HTML views, PDF and ePub downloads, according to the available data) and Abstracts Views on Vision4Press platform.
Data correspond to usage on the plateform after 2015. The current usage metrics is available 48-96 hours after online publication and is updated daily on week days.
Initial download of the metrics may take a while.