Fig. 2
Download original image
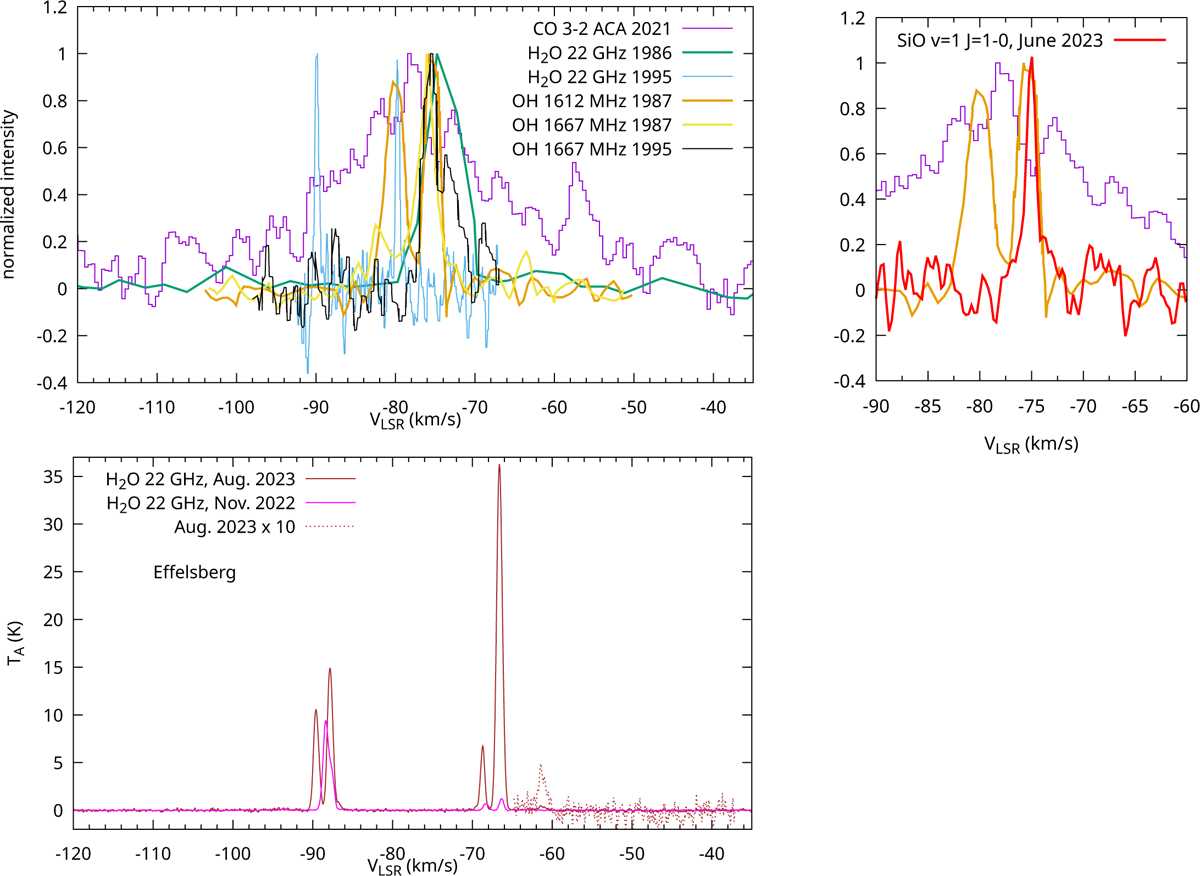
Radio and submillimeter molecular lines in U Equ. Top left: maser emission of OH and H2O extracted from the literature data compared to the CO J = 3−2 profile obtained more recently with ALMA. The spectra were acquired with different spectral resolutions and are shown here normalized to the peak. Right: on a reduced LSR velocity axis, the spectrum of the SiO J = 1−0 υ=1 maser (red) is compared to that of the 1667 MHz OH maser (observed in 1987, orange) and to the CO J = 3−2 line (purple). Bottom: spectra of the water masers acquired recently with the Effelsberg telescope. They are shown on the absolute intensity scale to demonstrate the variability in the line fluxes. Part of the 2023 spectrum is shown scaled by a factor of 10 to better show the weak component near −61.4 km s−1 (dashed). The velocity in the heliocentric rest frame is 13.1 km s−1 lower than in the LSR frame adopted here. Some of the displayed spectra are available at the CDS.
Current usage metrics show cumulative count of Article Views (full-text article views including HTML views, PDF and ePub downloads, according to the available data) and Abstracts Views on Vision4Press platform.
Data correspond to usage on the plateform after 2015. The current usage metrics is available 48-96 hours after online publication and is updated daily on week days.
Initial download of the metrics may take a while.