Open Access
Fig. 4
Download original image
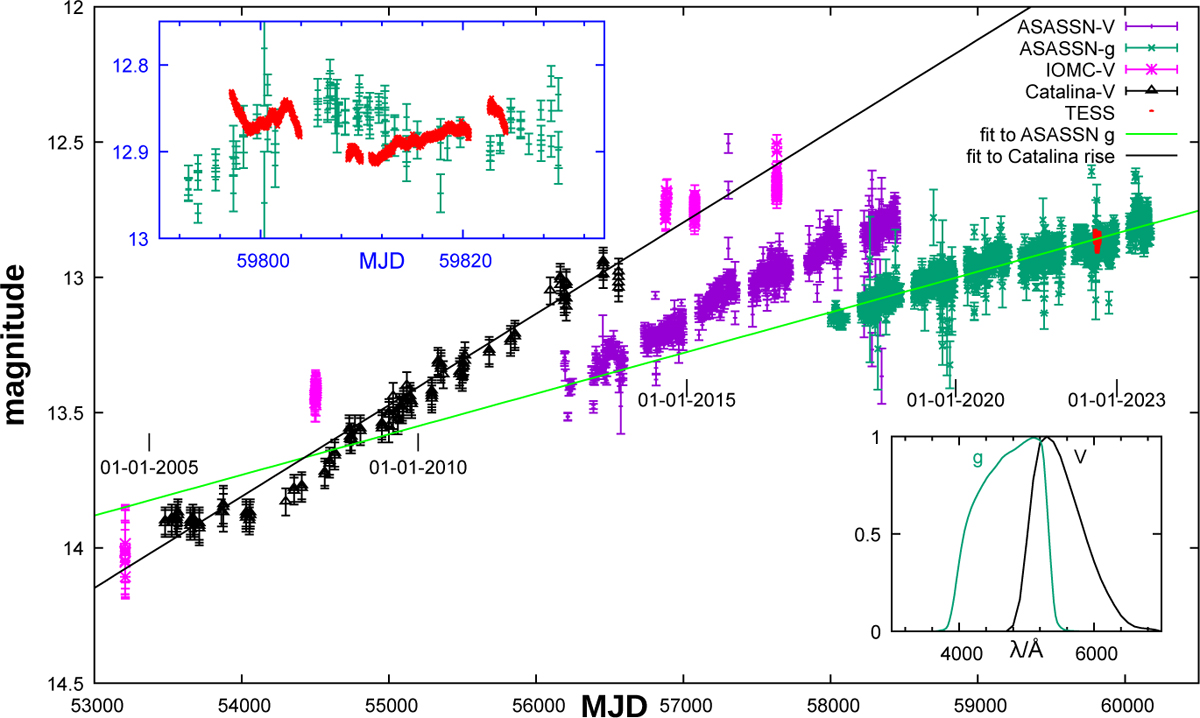
Rise in brightness of U Equ in visual bands. The blue inset shows the variability documented by arbitrarily scaled TESS data. The inset in the lower right corner compares the transmission curves of the V and 𝑔 filters.
Current usage metrics show cumulative count of Article Views (full-text article views including HTML views, PDF and ePub downloads, according to the available data) and Abstracts Views on Vision4Press platform.
Data correspond to usage on the plateform after 2015. The current usage metrics is available 48-96 hours after online publication and is updated daily on week days.
Initial download of the metrics may take a while.