Open Access
Fig. 5
Download original image
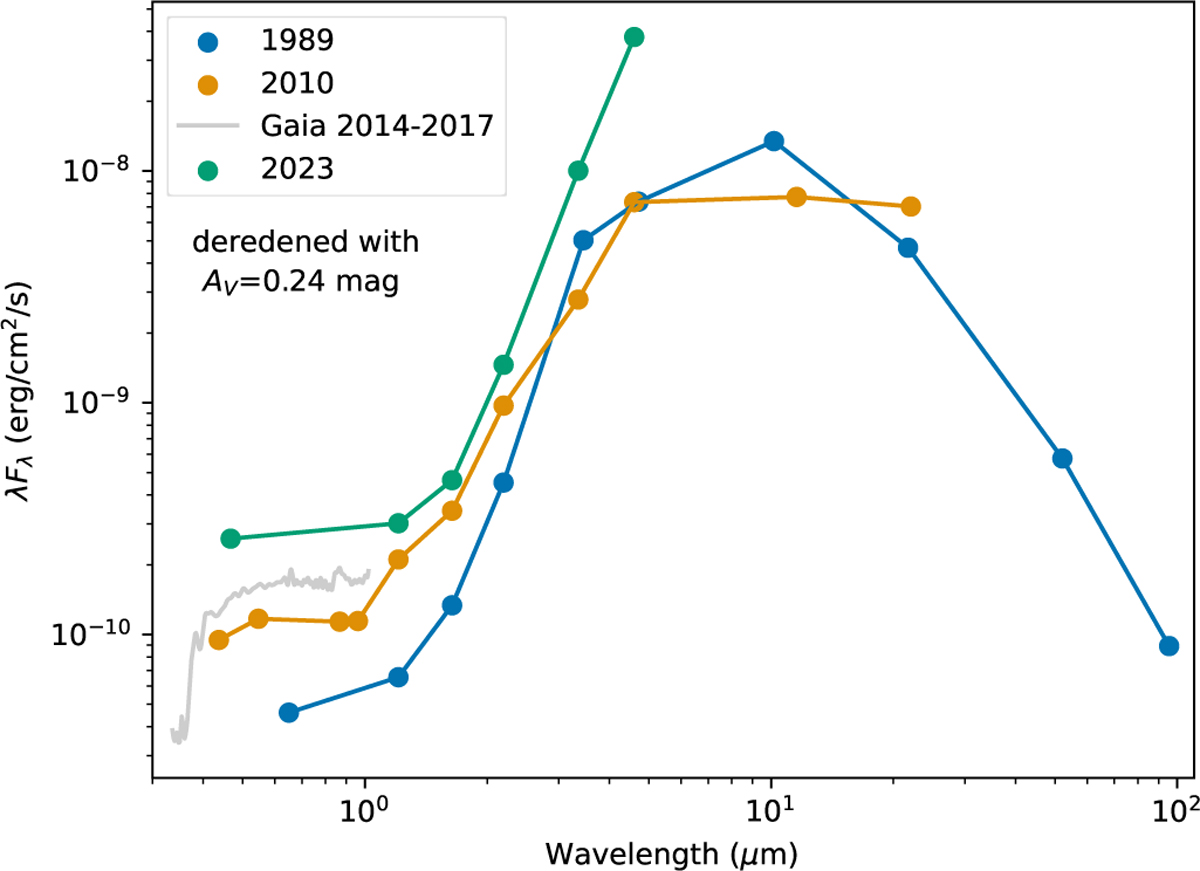
Comparison of SEDs at three epochs and to the Gaia average DR3 spectrum. For clarity, error bars are omitted and data points are connected by lines. The connectors do not represent the actual shape of the SEDs. The ALMA measurement is omitted for display reasons. The data were corrected for interstellar extinction.
Current usage metrics show cumulative count of Article Views (full-text article views including HTML views, PDF and ePub downloads, according to the available data) and Abstracts Views on Vision4Press platform.
Data correspond to usage on the plateform after 2015. The current usage metrics is available 48-96 hours after online publication and is updated daily on week days.
Initial download of the metrics may take a while.