Fig. 1
Download original image
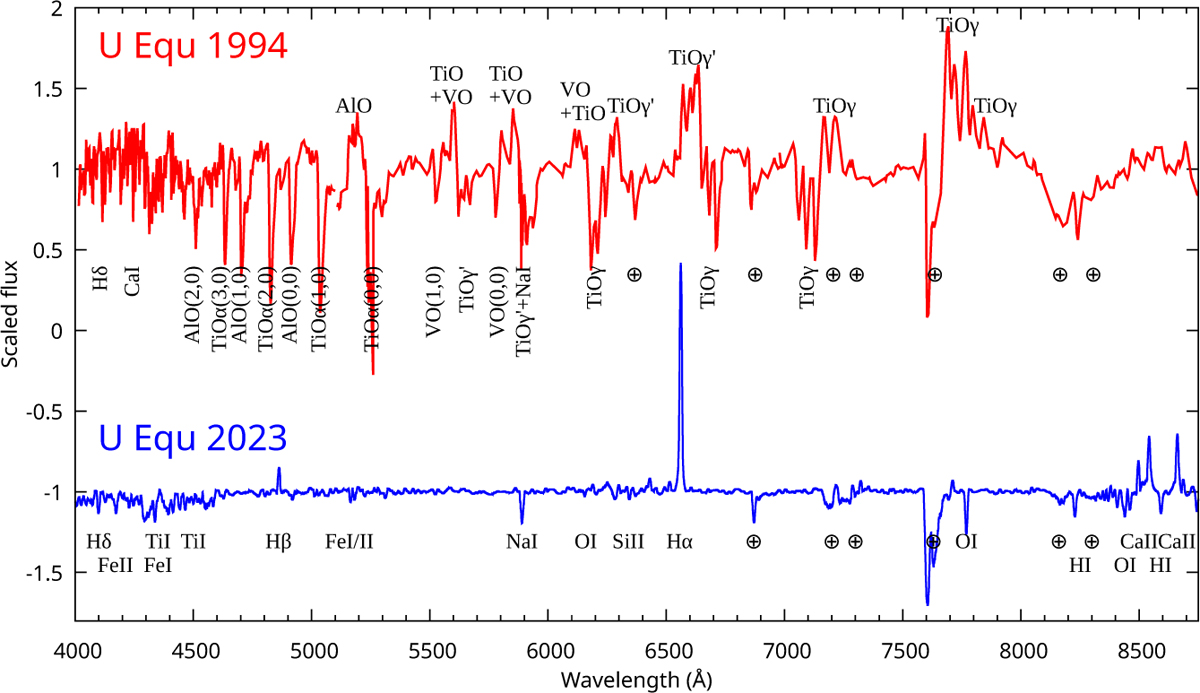
Spectra of U Equ obtained in 1994 (top; extracted from Barnbaum et al. 1996) and in 2022– 2023 (bottom). The spectrum completely changed from being dominated by molecular absorption-emission bands and requiring low excitation temperatures into a circumstellar spectrum of partially ionized atomic gas at a much higher excitation temperature. The bottom spectrum was smoothed to match the resolution of the earlier observations. The Earth symbols mark the positions of the strongest telluric features.
Current usage metrics show cumulative count of Article Views (full-text article views including HTML views, PDF and ePub downloads, according to the available data) and Abstracts Views on Vision4Press platform.
Data correspond to usage on the plateform after 2015. The current usage metrics is available 48-96 hours after online publication and is updated daily on week days.
Initial download of the metrics may take a while.