| Issue |
A&A
Volume 681, January 2024
|
|
|---|---|---|
| Article Number | L8 | |
| Number of page(s) | 10 | |
| Section | Letters to the Editor | |
| DOI | https://doi.org/10.1051/0004-6361/202348365 | |
| Published online | 04 January 2024 | |
Letter to the Editor
Insights from super-metal-rich stars: Is the Milky Way bar young?
1
Leibniz-Institut für Astrophysik Potsdam (AIP), An der Sternwarte 16, 14482 Potsdam, Germany
2
Institut für Physik und Astronomie, Universität Potsdam, Karl-Liebknecht-Str. 24/25, 14476 Potsdam, Germany
e-mail: This email address is being protected from spambots. You need JavaScript enabled to view it.
3
Zentrum für Astronomie der Universität Heidelberg, Landessternwarte, Königstuhl 12, 69117 Heidelberg, Germany
4
Max Planck Institute for Astronomy, Königstuhl 17, 69117 Heidelberg, Germany
5
Instituto de Astronomía, Universidad Nacional Autónoma de México, A.P. 106, C.P. 22800 Ensenada, B.C., Mexico
6
Dipartimento di Fisica e Astronomia, Università degli Studi di Bologna, Via Gobetti 93/2, 40129 Bologna, Italy
7
Freie Universität Berlin, Fachbereich Physik, Arnimallee 14, 14195 Berlin, Germany
Received:
23
October
2023
Accepted:
28
November
2023
Abstract
Context. Bar formation and merger events can contribute to the rearrangement of stars within the Galaxy in addition to triggering star formation (SF) epochs. Super-metal-rich (SMR) stars found in the solar neighbourhood (SNd) can be used as tracers of such events as they are expected to originate only in the inner Galaxy and to have definitely migrated.
Aims. We study a homogeneous and large sample of SMR stars in the SNd to provide tighter constraints on the epoch of the bar formation and its impact on the Milky Way (MW) disc stellar populations.
Methods. We investigated a sample of 169 701 main sequence turnoff (MSTO) and subgiant branch (SGB) stars with 6D phase space information and high-quality stellar parameters coming from the hybrid-CNN analysis of the Gaia-DR3 RVS stars. We computed distances and ages using the StarHorse code with a mean precision of 1% and 11%, respectively. Of these stars, 11 848 have metallicity ([Fe/H]) above 0.15 dex.
Results. We report a metallicity dependence of spatial distribution of stellar orbits shown by the bimodal distribution in the guiding radius (Rg) at 6.9 and 7.9 kpc, first appearing at [Fe/H] ~ 0.1 dex, becoming very pronounced at higher [Fe/H]. In addition, we observe a trend where the most metal-rich stars, with [Fe/H] ~ 0.4 dex, are predominantly old (9–12 Gyr), but show a gradual decline in [Fe/H] with age, reaching approximately 0.25 dex about 4 Gyr ago, followed by a sharp drop around 3 Gyr ago. Furthermore, our full dataset reveals a clear peak in the age–metallicity relationship during the same period, indicating a SF burst around 3–4 Gyr ago with slightly sub-solar [Fe/H] and enhanced [α/Fe].
Conclusions. We show that the SMR stars are good tracers of bar activity.We interpret the steep decrease in the number of SMR stars at around 3 Gyr as the end of the bar formation epoch. In this scenario the peak of bar activity also coincides with a peak in the SF activity in the disc. Although the SF burst around 3 Gyr ago has been reported previously, its origin was unclear. Here we suggest that the SF burst was triggered by the high bar activity, 3–4 Gyr ago. According to these results and interpretation, the MW bar could be young.
Key words: stars: abundances / stars: fundamental parameters / Galaxy: abundances / Galaxy: evolution / Galaxy: kinematics and dynamics
Note to the reader: In the HTML version, the missing part of the Abstract was added on 10 January 2024.
© The Authors 2024
 Open Access article, published by EDP Sciences, under the terms of the Creative Commons Attribution License (https://creativecommons.org/licenses/by/4.0), which permits unrestricted use, distribution, and reproduction in any medium, provided the original work is properly cited.
This article is published in open access under the Subscribe to Open model. This email address is being protected from spambots. You need JavaScript enabled to view it. to support open access publication.
1. Introduction
Stars are the luminous storytellers of our Galactic saga. By studying the properties of these stars, their ages, chemical abundances, and motions, we can trace the history of our Galaxy (Pagel 1997; Matteucci 2001, 2021; Freeman & Bland-Hawthorn 2002). Among the different stellar populations in the Milky Way (MW), super-metal-rich (SMR1) stars are very interesting as they are expected to form only in the inner regions of our Galaxy out of materials enriched by previous generations of stars (Grenon 1972; Steinmetz & Mueller 1994; Trevisan et al. 2011; Casagrande et al. 2011; Kordopatis et al. 2015; Anders et al. 2017; Miglio et al. 2021). These SMR stars currently residing in the solar neighbourhood (SNd) definitely migrated from the inner Galaxy (Feuillet et al. 2018; Chen et al. 2019; Dantas et al. 2023), and their study can inform us about the processes that bring them to the outer disc. Queiroz et al. (2021) have shown that the inner kiloparsec of the Galaxy provides a large reservoir of high-metallicity stars (either as part of an inner thin disc or on bar-shaped orbits), and these are primarily good candidates for migration.
The Galactic bar is considered an important perturber for generating radial motion of stars and gas in the galactic disc (e.g. Sellwood 2014). According to N-body simulations, during the formation and the phase of strong bar activity, stars in the disc are significantly redistributed, with the highest probability of migration at the bar resonances (Minchev & Famaey 2010; Halle et al. 2015; Khoperskov et al. 2020a). However, an open question still remains on the epoch of MW bar formation.
Old to young formation times for the MW bar have been proposed in both observational and simulation studies conducted to date. Bovy et al. (2019) and Wylie et al. (2022), using red giant stars in the inner Galaxy with ages estimated using astroNN (Leung & Bovy 2019), proposed an older bar, at least 7 to 8 Gyr old, based on the mean and peak of the age distribution. Cole & Weinberg (2002), using carbon stars that trace the bar, suggested that the bar likely formed ∼3 Gyr ago. However, it is important to recognise that the bar is a cumulative entity; it will indiscriminately contain older stars and stars born during bar formation. So care has to be taken to differentiate older stars from those formed during bar formation (see e.g. de Sá-Freitas et al. 2023a). Tepper-Garcia et al. (2021), using a tailored N-body model of barred MW, suggested that the bar formed 3–4 Gyr ago. In context of external galaxies, de Sá-Freitas et al. (2023b) recently reported the discovery of young bars, formed 4.5 and 0.7 Gyr ago, for spiral galaxies NGC 289 and NGC 1566 using the star formation (SF) history of nuclear discs. This suggests that some disc galaxies, with stellar mass comparable to MW, could settle on longer timescales.
However, because SMR stars are rare, we still lack a statistically significant sample to constrain this process. This situation has radically changed thanks to the third data release (DR3) of the ESA Gaia mission (Gaia Collaboration 2023). Gaia-DR3 has provided about one million spectra from the Radial Velocity Spectrometer (RVS)2, of which only ∼178 000 stars have good-quality stellar parameters after the applying the recommended flags (Recio-Blanco et al. 2023). A large portion of the published RVS spectra have a low signal-to-noise ratio (S/N; 15–25 per pixel), which can be challenging for traditional spectroscopic pipelines. Guiglion et al. (2023, G23) using a hybrid convolutional neural network (CNN) method, reanalysed the RVS sample to derive the atmospheric parameters (Teff, log(g), and overall [M/H]) and chemical abundances ([Fe/H] and [α/M]), by supplementing extra information from Gaia magnitudes (Riello et al. 2021), parallaxes (Lindegren et al. 2021), and XP coefficients (De Angeli et al. 2023). The hybrid-CNN was trained with a high-quality training sample based on APOGEE DR17 (Abdurro’uf et al. 2022) labels, and show precision and accuracy comparable to external datasets such as GALAH and asteroseismology. Thanks to the novel method, G23 significantly improved the number of reliable targets that can be used for Galactic archaeology. The G23 catalogue, has a large number of SMR stars, including a sample of MSTO and SGB stars, enabling the use of these traces to constrain the epoch of MW bar formation.
In this Letter we explore the age–[Fe/H] (AMR) and the age–[α/Fe] (AAR) relationships along with the chemo-dynamics for a sample of MSTO and SGB stars selected from the RVS-CNN catalogue of G23. In Sect. 2 we describe our sample, focusing on the methods used to obtain the stellar ages and kinematics. In Sect. 3 we present our results, and in Sect. 4 we present the main conclusions.
2. Data
We obtained a sample of stars, with −0.7 < [Fe/H] < 0.5 including a large set of the SMR stars, from the catalogue of G23. We selected MSTO and SGB stars (see Queiroz et al. 2023) after the application of the G23 recommended flags. We kept only the MSTO-SGB stars as the stellar ages from isochrone fitting methods are most reliable for these evolutionary stages (e.g. Soderblom 2010). We computed the distances and stellar ages with the StarHorse Bayesian isochrone-fitting method (Queiroz et al. 2018, 2023) and integrate the orbits of the stars using Galpy (Bovy 2015). For details on these computations see Appendix A.
We selected stars with a relative age uncertainty less than 20%, distance uncertainty less than 5%, and extinction uncertainty less than 0.2 Mag. We were left with a sample with mean uncertainty of 11% for age and 1% for distance, due to the very low parallax errors in the extended SNd thanks to Gaia. We further removed any stars with poor astrometric solutions by limiting RUWE < 1.4, and we also removed known variable stars by using Gaia flag ‘phot_variable_flag’≠‘VARIABLE’ (see Gaia Collaboration 2023).
This gave us a final sample of 169 727 stars, including 19 367 stars with [Fe/H] > 0.1 dex. As a test, we applied the 13 recommended flags on the GSP-Spec parameters (Recio-Blanco et al. 2023) to find a total sample reduced to 20 269 stars with only 4853 stars with [Fe/H] > 0.1 dex.
In Fig. 1 we present our sample properties. Although the stars are widely distributed in Z vs. R space, the number of stars decreases as we move away from the SNd, as expected for a sample of MSTO+SGB stars (see Queiroz et al. 2023). Therefore, the sample is essentially dominated by thin disc stars (low-[α/Fe] population).
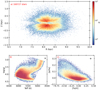 |
Fig. 1. Properties of our selected sample: (a) Distance from the Galactic mid-plane (Z) vs. the Galactocentric distance (R); (b) the Kiel diagram (log(g) vs. Teff); and (c) the [α/Fe] vs. [Fe/H] diagram for the sample, colour-coded by number density. |
3. Results and discussion
3.1. Super-metal-rich stars as tracers of MW bar activity
Figure 2 shows the distribution of guiding radius (Rg), in bins of metallicity, for stars in the range −0.3 < [Fe/H] < 0.5. The [Fe/H] values increase as we move from panel a to panel i. These histograms show that a clear bimodality in the distribution of Rg appears as we move from sub-solar [Fe/H] to SMR stars. The bimodality visibly appears first in the bin 0.10 < [Fe/H] < 0.15, as seen in panel d, and becomes stronger for the higher [Fe/H] bins. An inner and an outer peak is seen at 6.9 and 7.9 kpc for all super-solar bins. We validate this finding with an external sample of red-giant stars in Appendix D. We note that the two peaks are not equally populated; there is a higher number of stars near the solar radius, which we attribute to the Gaia selection function.
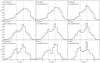 |
Fig. 2. Distribution of the guiding radii (Rg) in bins of metallicity ([Fe/H]). The [Fe/H] values increase from top left to bottom right, from panel a to panel i; the number of stars and the [Fe/H] range are shown. The two dotted lines at 6.9 and 7.9 kpc represent the two peaks of the Rg distribution. |
Unlike SMR stars, sub-solar to solar [Fe/H] stars are equally plausibly formed in the SNd, and in the inner and outer galaxy, so their actual birth location can be uncertain due to radial migration (e.g. Minchev et al. 2013, 2014 and references therein). We also know that the innermost regions of the MW are populated by very metal-rich stars (see e.g. Barbuy et al. 2018 and references therein). In particular, Queiroz et al. (2021), using APOGEE and Gaia surveys to study the bar and bulge regions, found a large cache of metal-rich stars in the inner Galaxy. These metal-rich stars, found in cold to highly eccentric orbits, could be a source of origin for our local SMR stars.
The question is what mechanism could have brought them here. The SMR stars in our sample, most of them in cold orbits and 96% with ecc < 0.3, distributed favourably at certain Rg, entices us to view their distribution in the context of evolution and dynamical process in the Galaxy (see Appendix B for a comparison of velocity dispersion of metal-rich stars with the full sample). The Galactic bar has long been considered an efficient source of radial migration (Combes & Sanders 1981; Pfenniger & Norman 1990). Galaxy models and N-body simulations have shown that a slow down of Galactic bars can lead to migration of stars from the inner to the outer galaxy by trapping them in resonances as they travel outwards in the disc (e.g. Athanassoula 2003; Khoperskov et al. 2020a; Chiba & Schönrich 2021).
Although dependent on the exact dynamical recipe, many recent studies have placed bar corotation (CR) in the radius range of 6–7 kpc (e.g. Portail et al. 2017; Khoperskov et al. 2020b; Chiba & Schönrich 2021) and the local arm at around 8 kpc (e.g. Palicio et al. 2023) linking it to outer Lindbald resonances (OLRs; Fragkoudi et al. 2019; Khoperskov et al. 2020b). Furthermore, Chen et al. (2022) using SMR stars, find ridges and undulations in the ϕ versus LZ plane similar to the orbits trapped in resonances of a slow bar as in the model of Monari et al. (2019; see Appendix F for the test on how metal-rich stars are more suitable for probing bar activity). Therefore, the inner and outer Rg peaks, observed for the SMR stars at 6.9 and 7.9 kpc, most probably correspond to the imprints of the Galactic bar.
From our observations (see Fig. 2) we conclude that the SMR stars, currently in the SNd, trace the signatures of bar activity. In the next subsection we employ these SMR stars, with good ages, to study the formation epoch of the MW bar.
3.2. Timing the bar formation epoch with the youngest super-metal-rich stars
In the left panel of Fig. 3 we present stellar age as a function of Rg for the 19 367 metal-rich stars for which bimodality is clearly seen in Fig. 2 (i.e. for [Fe/H] > 0.1 dex). The plot shows that the metal-rich stars have a wide range of ages with higher prevalence at older ages (11 to 6 Gyr). This hints to the fact that a large number of metal-rich stars were formed at early times in our Galaxy’s history. The bimodal nature of Rg, with peaks at 6.9 and 7.9 kpc, is clearly seen for all ages, and the spread in Rg is narrower for the younger stars. Although some of these older stars could have already dispersed to the outer galaxy at earlier times through various processes such as merger events (e.g. Helmi 2020), most of them are still in cold orbits. Interestingly, we see a near absence of metal-rich stars with ages younger than ∼2.7 Gyr (dashed line in Fig. 3; also see Fig. E.1). This cannot be attributed to selection effects on our sample such as colour or magnitude limits (see Appendix C). A significant number younger stars with sub-solar [Fe/H] are also present in our sample (see Figs. 4 and E.1). Therefore, the dearth of younger SMR stars could be related to the mechanism that brought these stars formed in the inner Galaxy to the SNd.
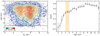 |
Fig. 3. Age dependence of Rg and [Fe/H] for the metal-rich stars. Left panel: stellar ages as a function of guiding radii for stars with [Fe/H] > 0.1 dex. The colours represent the number of stars per bin. A kernel density estimate (KDE) is overplotted. A dashed black line at 2.7 Gyr is also shown. Right panel: Upper envelope of the age–metallicity relation traced by our full sample. The triangles represent the median [Fe/H] of the 20 most metal-rich stars in each age bin and the error bars show the scatter in [Fe/H]. |
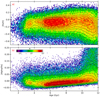 |
Fig. 4. Star formation history from the AMR and AAR. Top (a): 2D density distribution showing [Fe/H] as a function of stellar age for the full sample. Bottom (b): 2D density distribution showing [α/Fe] as a function of stellar age. A kernel density estimate (KDE) is also overplotted to highlight the density features in the AMR and AAR relationships. The colours represent number of stars per bin in log scale. |
In the right panel of Fig. 3 we present the time evolution of the upper envelope of the metallicity for our whole sample. The plot reveals that our Galaxy quickly attained the highest levels of metallicity enrichment, levelling around [Fe/H] = 0.4 dex, already at ∼10 Gyr ago. Then starting at 8.5 Gyr ago we observe a slow decrease, at −0.04 dex Gyr−1 up to 4 Gyr. Then for a period of 1 Gyr, from 4 to 3 Gyr ago, we see a plateau at [Fe/H] = 0.25 dex, highlighted by an orange band. After 3 Gyr we see a steep decline in the [Fe/H] envelope at a rate of −0.15 dex Gyr−1 (see Appendix D for a validation with an asteroseismic sample). This decline of the [Fe/H] envelope further confirms that the mechanism, which brought the majority of these metal-rich stars to the SNd, has ceased. We note here that Minchev et al. (2011) identified a radial migration mechanism, via bar and spiral structure interaction, that can migrate stars throughout the disc of MW-like galaxy in < 1 Gyr period. However, the migration induced by the bar is most effective at the epoch of bar growth, and therefore the stars in the inner Galaxy can be moved en masse to larger Rg (e.g. Halle et al. 2015).
Considering the MW bar growth and the outward propagation of the resonances as the transport mechanism of these SMR stars to the SNd (Minchev & Famaey 2010; Khoperskov et al. 2020a; Iles et al. 2024), we can use the stellar ages of these youngest SMR stars to place a constraint on the epoch of intense bar growth following bar formation. It is worth noting that the MW bar, and inner Galaxy in general, when currently observed contains stars of all ages from very old in higher number to very young, including those formed before, during, and after the epoch of bar formation. However, only the youngest metal-rich stars, formed during the epoch of bar formation, can be confidently employed to constrain the age of the bar. Based on this absence of younger SMR stars, we place the intense bar growth for the MW ending at 2.5 to 3 Gyr ago.
3.3. Enhanced star formation triggered by the bar formation
Considering that intense bar growth for MW ended ∼3 Gyr ago (see previous section), we can expect an epoch of bar enhanced SF succeeding this event (e.g. Baba & Kawata 2020). In this section we explore SF in the age–[Fe/H] and age–[α/Fe] relationships (AMR and AAR) and look for possible imprints of such an event.
Figure 4 shows the AMR (panel a) and AAR (panel b) stellar density distributions for the whole sample. The AMR shows three distinct density features at three different age regimes.
At the oldest regime, from 12 to ∼9–10 Gyr, an oblique feature shows a steep rise in [Fe/H] with age with the broadest [Fe/H] distribution. This oblique feature depicts an epoch of intense SF that leads to a rapid chemical enrichment in the early MW from the lowest to the highest [Fe/H] (i.e. from −0.7 to 0.4 dex). In the accompanying AAR, at this regime, we see the high values of [α/Fe] corresponding to the SF burst in the early galaxy leading to the formation of the chemical thick disc and old bulge (e.g. Fuhrmann 1998; Anders et al. 2018; Miglio et al. 2021; Montalbán et al. 2021; Queiroz et al. 2023; Xiang & Rix 2022). In addition, this epoch is also attributed to the merger of MW with Gaia-Sausage-Enceladus (GSE; Belokurov et al. 2018; Helmi et al. 2018).
Between 9 to 5 Gyr we see a horizontal blob with most of the stars between −0.2 < [Fe/H] < 0.0. This epoch reflects a slow and steady SF and is attributed to the growth of the thin disc (e.g. Chiappini et al. 1997; Minchev et al. 2013). This regime shows a birth of a large number of stars with sub-solar [Fe/H]. A trend of decreasing [α/Fe] with age is seen, also a sign of slow but continued SF. Growth of the MW thin disc in an inside-out manner, due to steady gas infall, is expected in this regime (see Matteucci 2021 and references therein).
Between 5 to 4 Gyr we see a decline in SF, followed by another feature between 4 to 2.7 Gyr. This oblique feature shows an enhanced SF with a slight decrease in metallicity at younger ages. An increase in the [α/Fe] is also seen, showing a signature of SF burst. This result further confirms the enhanced SF during similar epoch previously reported (Rocha-Pinto et al. 2000; Isern 2019; Mor et al. 2019; Sysoliatina & Just 2021; Sahlholdt et al. 2022; Imig et al. 2023). These previous works have not conclusively attributed any physical process to this SF phase. Considering that intense bar growth period ended ∼3 Gyr ago (see Sect. 3.2), we deduce that this star-burst is caused by the high activity of the bar evolution.
A likely scenario one could consider is that this high bar activity is simply a buckling of an old bar. However, there is still no consensus on whether the bar-buckling triggers SF in the disc (see Fragkoudi et al. 2020, and for an opposite view, see Debattista et al. 2006; Łokas 2020).
Interestingly, in their study of the outer bar region, Wylie et al. (2022) also find an abrupt decline of younger stars followed by a significant fraction of stars at 2–4 Gyr for the inner disc and ring region (see their Fig. 3). Additionally, bar formation triggered star bursts have typically been seen to last for a duration of ∼1 Gyr (see e.g. Baba & Kawata 2020), which corroborates our assessment. Furthermore, bars have been observed to enhance SF in external galaxies, for example the study by Lin et al. (2020) on low-redshift galaxies using integral field spectroscopy (also see Ellison et al. 2011). Hence, we conclude that MW bar formation occurred ∼4 Gyr ago, and that the strong bar activity ended ∼2.7 Gyr ago.
4. Conclusion
We have explored a large and homogeneous sample of 169 701 MSTO and SGB stars with 6D phase space information and high-quality stellar parameters coming from the Gaia-DR3 RVS analysis of Guiglion et al. (2023). We supplemented the chemical abundances with stellar ages, distances, and kinematics to study the epoch of MW bar formation. Thanks to Gaia DR3 we obtain a mean distance uncertainty of 1%, which greatly contributes to the findings of this Letter.
The new data shows two new results, a clear bimodality in Rg at all ages (> 3 Gyr) of SMR stars, and a dearth of SMR stars younger than 3 Gyr. These results imply the following:
-
The Milky Way bar had a strong activity phase lasting ∼1 Gyr ending ∼3 Gyr ago. During the phase of strong bar activity, stars that formed in the inner region (bulge/bar), are significantly redistributed across the outer disc, with the highest probability of migration around bar resonances. We verify this with a dearth of SMR stars younger than 3 Gyr and an observed bimodality in the Rg around the bar resonances for the SMR stars, which, with high confidence, formed in the inner galaxy and migrated here during the strong activity phase of bar formation.
-
We detect an enhancement in the global SF (around −0.3 < [Fe/H] < 0.0) at around 3 Gyr which by that time had already declined in the local thin disc. Although this SF enhancement has been detected previously in the literature, the age coincidence with our estimate of the bar age suggests that these events are related.
-
Because of mixing and strong gas inflow due to bar, we suggest that there was an epoch of enhanced SF (see Fig. 4). The gas inflow during this phase lowers the upper floor of [Fe/H] versus age distribution, while causing an increase in the [α/Fe] due to intense SF.
Future spectroscopic surveys such as 4MIDABLE-LR (Chiappini et al. 2019) will enable a large increase in the number of super-metal-rich stars with full 6D phase space and chemical information. In addition, the Japan Astrometry Satellite Mission for INfrared Exploration (JASMINE; Kawata et al. 2023) will be able to provide additional constraints on the age of the MW bar by precisely measuring the age of the nuclear stellar disc.
A SMR star is defined as having a metal abundance that exceeds the metallicity of the local present-day interstellar medium; because of the negative radial abundance gradient in the MW, its value varies with galactocentric distance.
The RVS spectra were originally analysed during Gaia DR3 (10.17876/gaia/dr.3) by the General Stellar Parametriser for spectroscopy (GSP-Spec, Recio-Blanco et al. 2023) module of the Astrophysical parameters inference system (Apsis, Creevey et al. 2023).
Acknowledgments
S.N. thanks the E-science & IT team for COLAB service, computational clusters and research infrastructure at AIP. S.N. thanks Sergey Khoperskov, Friedrich Anders and Ivan Minchev for the helpful suggestions. G.G. acknowledges support by Deutsche Forschungs-gemeinschaft (DFG, German Research Foundation) – project-IDs: eBer-22-59652 (GU 2240/1-1). This project has also received additional funding from the European Research Council (ERC) under the European Union’s Horizon 2020 research and innovation programme (Grant agreement No. 949173). A.P.V. acknowledges the DGAPA-PAPIIT grant IA103122. A.M. acknowledges support from the ERC Consolidator Grant funding scheme (project ASTEROCHRONOMETRY, G.A. n. 772293). This work has made use of data from the European Space Agency (ESA) mission Gaia (https://www.cosmos.esa.int/gaia), processed by the Gaia Data Processing and Analysis Consortium (DPAC, https://www.cosmos.esa.int/web/gaia/dpac/consortium). Funding for the DPAC has been provided by national institutions, in particular the institutions participating in the Gaia Multilateral Agreement. This work made use of overleaf (https://www.overleaf.com/), and of the following PYTHON packages: MATPLOTLIB (Hunter 2007), NUMPY (Harris et al. 2020), PANDAS (McKinney 2010), SEABORN (Waskom 2021). This work also benefited from TOPCAT (Taylor 2005).
References
- Abdurro’uf, Accetta, K., Aerts, C., et al. 2022, ApJS, 259, 35 [NASA ADS] [CrossRef] [Google Scholar]
- Anders, F., Chiappini, C., Minchev, I., et al. 2017, A&A, 600, A70 [NASA ADS] [CrossRef] [EDP Sciences] [Google Scholar]
- Anders, F., Chiappini, C., Santiago, B. X., et al. 2018, A&A, 619, A125 [NASA ADS] [CrossRef] [EDP Sciences] [Google Scholar]
- Antoja, T., Helmi, A., Romero-Gómez, M., et al. 2018, Nature, 561, 360 [Google Scholar]
- Astropy Collaboration (Price-Whelan, A. M., et al.) 2022, ApJ, 935, 167 [NASA ADS] [CrossRef] [Google Scholar]
- Athanassoula, E. 2003, MNRAS, 341, 1179 [Google Scholar]
- Baba, J., & Kawata, D. 2020, MNRAS, 492, 4500 [NASA ADS] [CrossRef] [Google Scholar]
- Barbuy, B., Chiappini, C., & Gerhard, O. 2018, ARA&A, 56, 223 [Google Scholar]
- Belokurov, V., Erkal, D., Evans, N. W., Koposov, S. E., & Deason, A. J. 2018, MNRAS, 478, 611 [Google Scholar]
- Bovy, J. 2015, ApJS, 216, 29 [NASA ADS] [CrossRef] [Google Scholar]
- Bovy, J., Leung, H. W., Hunt, J. A. S., et al. 2019, MNRAS, 490, 4740 [Google Scholar]
- Bressan, A., Marigo, P., Girardi, L., et al. 2012, MNRAS, 427, 127 [NASA ADS] [CrossRef] [Google Scholar]
- Buder, S., Sharma, S., Kos, J., et al. 2021, MNRAS, 506, 150 [NASA ADS] [CrossRef] [Google Scholar]
- Casagrande, L., Schönrich, R., Asplund, M., et al. 2011, A&A, 530, A138 [NASA ADS] [CrossRef] [EDP Sciences] [Google Scholar]
- Chen, Y. Q., Zhao, G., Zhao, J. K., et al. 2019, AJ, 158, 249 [NASA ADS] [CrossRef] [Google Scholar]
- Chen, Y., Zhao, G., & Zhang, H. 2022, ApJ, 936, L7 [NASA ADS] [CrossRef] [Google Scholar]
- Chiappini, C., Matteucci, F., & Gratton, R. 1997, ApJ, 477, 765 [Google Scholar]
- Chiappini, C., Minchev, I., Starkenburg, E., et al. 2019, The Messenger, 175, 30 [NASA ADS] [Google Scholar]
- Chiba, R., & Schönrich, R. 2021, MNRAS, 505, 2412 [NASA ADS] [CrossRef] [Google Scholar]
- Cole, A. A., & Weinberg, M. D. 2002, ApJ, 574, L43 [NASA ADS] [CrossRef] [Google Scholar]
- Combes, F., & Sanders, R. H. 1981, A&A, 96, 164 [NASA ADS] [Google Scholar]
- Creevey, O. L., Sordo, R., Pailler, F., et al. 2023, A&A, 674, A26 [NASA ADS] [CrossRef] [EDP Sciences] [Google Scholar]
- Dantas, M. L. L., Smiljanic, R., Boesso, R., et al. 2023, A&A, 669, A96 [NASA ADS] [CrossRef] [EDP Sciences] [Google Scholar]
- De Angeli, F., Weiler, M., Montegriffo, P., et al. 2023, A&A, 674, A2 [NASA ADS] [CrossRef] [EDP Sciences] [Google Scholar]
- Debattista, V. P., Mayer, L., Carollo, C. M., et al. 2006, ApJ, 645, 209 [Google Scholar]
- de Sá-Freitas, C., Fragkoudi, F., Gadotti, D. A., et al. 2023a, A&A, 671, A8 [NASA ADS] [CrossRef] [EDP Sciences] [Google Scholar]
- de Sá-Freitas, C., Gadotti, D. A., Fragkoudi, F., et al. 2023b, A&A, 678, A202 [NASA ADS] [CrossRef] [EDP Sciences] [Google Scholar]
- Ellison, S. L., Nair, P., Patton, D. R., et al. 2011, MNRAS, 416, 2182 [NASA ADS] [CrossRef] [Google Scholar]
- Feuillet, D. K., Bovy, J., Holtzman, J., et al. 2018, MNRAS, 477, 2326 [NASA ADS] [CrossRef] [Google Scholar]
- Fragkoudi, F., Katz, D., Trick, W., et al. 2019, MNRAS, 488, 3324 [NASA ADS] [Google Scholar]
- Fragkoudi, F., Grand, R. J. J., Pakmor, R., et al. 2020, MNRAS, 494, 5936 [Google Scholar]
- Freeman, K., & Bland-Hawthorn, J. 2002, ARA&A, 40, 487 [Google Scholar]
- Fuhrmann, K. 1998, A&A, 338, 161 [NASA ADS] [Google Scholar]
- Gaia Collaboration (Vallenari, A., et al.) 2023, A&A, 674, A1 [NASA ADS] [CrossRef] [EDP Sciences] [Google Scholar]
- Grenon, M. 1972, in IAU Colloq. 17: Age des Etoiles, eds. G. Cayrel de Strobel, & A. M. Delplace, 55 [Google Scholar]
- Guiglion, G., Nepal, S., Chiappini, C., et al. 2023, A&A, in press https://doi.org/10.1051/0004-6361/202347122 [Google Scholar]
- Halle, A., Di Matteo, P., Haywood, M., & Combes, F. 2015, A&A, 578, A58 [NASA ADS] [CrossRef] [EDP Sciences] [Google Scholar]
- Harris, C. R., Millman, K. J., van der Walt, S. J., et al. 2020, Nature, 585, 357 [NASA ADS] [CrossRef] [Google Scholar]
- Helmi, A. 2020, ARA&A, 58, 205 [Google Scholar]
- Helmi, A., Babusiaux, C., Koppelman, H. H., et al. 2018, Nature, 563, 85 [Google Scholar]
- Hunter, J. D. 2007, Comput. Sci. Eng., 9, 90 [NASA ADS] [CrossRef] [Google Scholar]
- Iles, E. J., Pettitt, A. R., Okamoto, T., & Kawata, D. 2024, MNRAS, 527, 2799 [Google Scholar]
- Imig, J., Price, C., Holtzman, J. A., et al. 2023, ApJ, 954, 124 [CrossRef] [Google Scholar]
- Isern, J. 2019, ApJ, 878, L11 [NASA ADS] [CrossRef] [Google Scholar]
- Kawata, D., Baba, J., Ciucǎ, I., et al. 2018, MNRAS, 479, L108 [Google Scholar]
- Kawata, D., Kawahara, H., Gouda, N., et al. 2023, PASJ, submitted, [arXiv:2307.05666] [Google Scholar]
- Khoperskov, S., & Gerhard, O. 2022, A&A, 663, A38 [NASA ADS] [CrossRef] [EDP Sciences] [Google Scholar]
- Khoperskov, S., Di Matteo, P., Haywood, M., Gómez, A., & Snaith, O. N. 2020a, A&A, 638, A144 [NASA ADS] [CrossRef] [EDP Sciences] [Google Scholar]
- Khoperskov, S., Gerhard, O., Di Matteo, P., et al. 2020b, A&A, 634, L8 [NASA ADS] [CrossRef] [EDP Sciences] [Google Scholar]
- Kordopatis, G., Binney, J., Gilmore, G., et al. 2015, MNRAS, 447, 3526 [Google Scholar]
- Leung, H. W., & Bovy, J. 2019, MNRAS, 489, 2079 [CrossRef] [Google Scholar]
- Liang, X., Yoon, S.-J., Zhao, J., et al. 2023, ApJ, 956, 146 [NASA ADS] [CrossRef] [Google Scholar]
- Lin, L., Li, C., Du, C., et al. 2020, MNRAS, 499, 1406 [NASA ADS] [CrossRef] [Google Scholar]
- Lindegren, L., Bastian, U., Biermann, M., et al. 2021, A&A, 649, A4 [EDP Sciences] [Google Scholar]
- Łokas, E. L. 2020, A&A, 634, A122 [NASA ADS] [CrossRef] [EDP Sciences] [Google Scholar]
- Matteucci, F. 2001, The Chemical Evolution of the Galaxy, 253 (Dordrecht: Kluwer Academic Publishers) [Google Scholar]
- Matteucci, F. 2021, A&ARv, 29, 5 [NASA ADS] [CrossRef] [Google Scholar]
- McKinney, W. 2010, in Proceedings of the 9th Python in Science Conference, eds. S. van der Walt, & J. Millman, 56 [Google Scholar]
- McMillan, P. J. 2017, MNRAS, 465, 76 [NASA ADS] [CrossRef] [Google Scholar]
- Miglio, A., Chiappini, C., Mackereth, J. T., et al. 2021, A&A, 645, A85 [NASA ADS] [CrossRef] [EDP Sciences] [Google Scholar]
- Minchev, I., & Famaey, B. 2010, ApJ, 722, 112 [Google Scholar]
- Minchev, I., Famaey, B., Combes, F., et al. 2011, A&A, 527, A147 [NASA ADS] [CrossRef] [EDP Sciences] [Google Scholar]
- Minchev, I., Chiappini, C., & Martig, M. 2013, A&A, 558, A9 [CrossRef] [EDP Sciences] [Google Scholar]
- Minchev, I., Chiappini, C., Martig, M., et al. 2014, ApJ, 781, L20 [Google Scholar]
- Monari, G., Famaey, B., Siebert, A., Wegg, C., & Gerhard, O. 2019, A&A, 626, A41 [NASA ADS] [CrossRef] [EDP Sciences] [Google Scholar]
- Montalbán, J., Mackereth, J. T., Miglio, A., et al. 2021, Nat. Astron., 5, 640 [Google Scholar]
- Mor, R., Robin, A. C., Figueras, F., Roca-Fàbrega, S., & Luri, X. 2019, A&A, 624, L1 [NASA ADS] [CrossRef] [EDP Sciences] [Google Scholar]
- Pagel, B. E. J. 1997, Nucleosynthesis and Chemical Evolution of Galaxies (UK: Cambridge University Press) [Google Scholar]
- Palicio, P. A., Recio-Blanco, A., Poggio, E., et al. 2023, A&A, 670, L7 [NASA ADS] [CrossRef] [EDP Sciences] [Google Scholar]
- Pérez-Villegas, A., Portail, M., Wegg, C., & Gerhard, O. 2017, ApJ, 840, L2 [Google Scholar]
- Pfenniger, D., & Norman, C. 1990, ApJ, 363, 391 [Google Scholar]
- Portail, M., Gerhard, O., Wegg, C., & Ness, M. 2017, MNRAS, 465, 1621 [NASA ADS] [CrossRef] [Google Scholar]
- Queiroz, A. B. A., Anders, F., Santiago, B. X., et al. 2018, MNRAS, 476, 2556 [Google Scholar]
- Queiroz, A. B. A., Chiappini, C., Perez-Villegas, A., et al. 2021, A&A, 656, A156 [NASA ADS] [CrossRef] [EDP Sciences] [Google Scholar]
- Queiroz, A. B. A., Anders, F., Chiappini, C., et al. 2023, A&A, 673, A155 [NASA ADS] [CrossRef] [EDP Sciences] [Google Scholar]
- Recio-Blanco, A., de Laverny, P., Palicio, P. A., et al. 2023, A&A, 674, A29 [NASA ADS] [CrossRef] [EDP Sciences] [Google Scholar]
- Riello, M., De Angeli, F., Evans, D. W., et al. 2021, A&A, 649, A3 [NASA ADS] [CrossRef] [EDP Sciences] [Google Scholar]
- Rocha-Pinto, H. J., Scalo, J., Maciel, W. J., & Flynn, C. 2000, ApJ, 531, L115 [NASA ADS] [CrossRef] [Google Scholar]
- Sahlholdt, C. L., Feltzing, S., & Feuillet, D. K. 2022, MNRAS, 510, 4669 [NASA ADS] [CrossRef] [Google Scholar]
- Schönrich, R., Binney, J., & Dehnen, W. 2010, MNRAS, 403, 1829 [NASA ADS] [CrossRef] [Google Scholar]
- Sellwood, J. A. 2014, Rev. Mod. Phys., 86, 1 [Google Scholar]
- Skrutskie, M. F., Cutri, R. M., Stiening, R., et al. 2006, AJ, 131, 1163 [NASA ADS] [CrossRef] [Google Scholar]
- Soderblom, D. R. 2010, ARA&A, 48, 581 [Google Scholar]
- Steinmetz, M., & Mueller, E. 1994, A&A, 281, L97 [NASA ADS] [Google Scholar]
- Sysoliatina, K., & Just, A. 2021, A&A, 647, A39 [NASA ADS] [CrossRef] [EDP Sciences] [Google Scholar]
- Taylor, M. B. 2005, in Astronomical Data Analysis Software and Systems XIV, eds. P. Shopbell, M. Britton, & R. Ebert, ASP Conf. Ser., 347, 29 [Google Scholar]
- Tepper-Garcia, T., Bland-Hawthorn, J., Vasiliev, E., et al. 2021, ArXiv e-prints [arXiv:2111.05466] [Google Scholar]
- Trevisan, M., Barbuy, B., Eriksson, K., et al. 2011, A&A, 535, A42 [NASA ADS] [CrossRef] [EDP Sciences] [Google Scholar]
- Waskom, M. L. 2021, J. Open Source Software, 6, 3021 [NASA ADS] [CrossRef] [Google Scholar]
- Wylie, S. M., Clarke, J. P., & Gerhard, O. E. 2022, A&A, 659, A80 [NASA ADS] [CrossRef] [EDP Sciences] [Google Scholar]
- Xiang, M., & Rix, H.-W. 2022, Nature, 603, 599 [NASA ADS] [CrossRef] [Google Scholar]
Appendix A: Details of input parameters for StarHorse and kinematic calculations
The distances and stellar ages were computed with the StarHorse Bayesian isochrone-fitting method (Queiroz et al. 2018, 2023), as noted in Sect. 2. As inputs to StarHorse we used the spectroscopic parameters from G23, Galactic longitude (l) and latitude (b); photometric magnitudes G, Bp, and Rp; and parallaxes from Gaia DR3 along with parallax corrections by Lindegren et al. (2021). We also used the infra-red photometry (JHKs) from Two Micron All Sky Survey (2MASS; Skrutskie et al. 2006).
To calculate positions and velocities in the galactocentric rest-frame and to integrate the orbits of the stars, we used the 6D phase-space coordinates (sky positions, parallaxes, proper motions, and radial velocities) from Gaia DR3 (Gaia Collaboration 2023) along with the StarHorse distances. The integration of orbits was done with Galpy (Bovy 2015), a Python package for Galactic dynamics calculations. We used Astropy (Astropy Collaboration 2022) for coordinate and velocity transformations, assuming the Sun is located at radius R0 = 8.2 kpc and that the circular velocity of local standard of rest (LSR) is V0 = 233.1 km s−1 (Bovy 2015; McMillan 2017). The peculiar velocity of the Sun with respect to the LSR is (U, V, W)⊙ = (11.1, 12.24, 7.25) km s−1 (Schönrich et al. 2010). To run Galpy we adopted the MW potential of McMillan (2017) and performed orbit integrations for a 3 Gyr period, saving each orbit’s trajectory every 2 Myr.
The guiding radius we computed, given by Rg = LZ/V0, is independent of the axisymmetric potential. Here, LZ denotes the star’s instantaneous angular momentum, defined as LZ = R · Vϕ, where R is its galactocentric distance, and Vϕ denotes its azimuthal velocity in the Galactic plane.
Appendix B: Kinematics of the metal-rich stars
Here we compare the velocity dispersion of our entire sample (169 727 stars) with that of stars with [Fe/H]>0.1. We highlight two main points in Fig. B.1: a) while σVϕ of the two samples are similar to each other in the 4-9 Gyr range, metal-rich stars have systematically lower σVR and σVZ, and are therefore systematically on cooler orbits than the bulk of the disc stars; b) at around 3 Gyr metal-rich stars show a sudden increase in velocity dispersion.
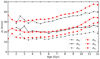 |
Fig. B.1. Velocity dispersions, radial (σVR, dashed), azimuthal (σVϕ, solid), and vertical (σVZ, dotted), as a function of stellar ages. The red circles represent the full sample, while the black stars represent the metal-rich ([Fe/H]>0.1) stars. |
We also note that for ages above approximately 9-10 Gyr the sample traced by the red curves in Fig. B.1 shows a strong increase in velocity dispersion mainly due to the dominant contribution of thick disc stars.
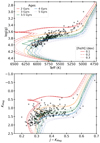 |
Fig. C.1. Kiel diagram and the CMD for the 256 metal-rich stars with 0.15 < [Fe/H]< 0.3 and 2 < Age (Gyr) < 4. For illustration purposes, PARSEC stellar isochrones for ages 2, 3, 3.5, 4, and 5 Gyr, and [Fe/H]= 0.1, 0.2, and 0.3 dex are included. The CMD uses JHKs absolute magnitudes from 2MASS, which were used as inputs for StarHorse to estimate ages. These stars most probably formed during the epoch of bar formation. |
Appendix C: Checking selection effects.
In order to check the effects of any colour–magnitude selection on the stellar ages we show, in Fig. C.1, the Kiel diagram (Teff vs log(g)) and colour–magnitude diagram (CMD) for a sample of 256 metal-rich stars with 0.15 < [Fe/H]< 0.3. The PARSEC stellar isochrones (Bressan et al. 2012), which are also used by StarHorse, have been overplotted. The plots show a very well-behaved distribution of the metal-rich stars with no hard cuts on the colour that hints at an absence of young metal-rich stars.
Given that our sample, obtained from Guiglion et al. (2023), is limited to Teff < 6300 K, and consists mostly of F, G, and K stellar types, one could assume that we are biased against younger stars (more importantly younger SMR stars). Recently, Sahlholdt et al. (2022), using a comparable dataset of ∼ 180 000 MSTO and SGB stars from the GALAH DR3 (Buder et al. 2021), studied the age–metallicity distribution. Their sample covers a wider 8000 < Teff < 4000 range including hotter stars not present in our RVS-CNN sample (see their Fig. 1). Their AMR (see their Fig. 2) also shows that an absence of SMR stars younger than 2-3 Gyr is real and is not an effect of selection bias. This further supports our result of a dearth of SMR stars younger than 3 Gyr ago, as discussed in Sect. 3.2 (also see Appendix D).
Appendix D: Validation with external catalogue.
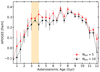 |
Fig. D.1. Upper envelope of the age–metallicity relation traced for the stars with asteroseismic ages from Miglio et al. (2021) and [Fe/H] from the APOGEE DR17 catalogue (Abdurro’uf et al. 2022). The triangles represent the median [Fe/H] of five (red) and ten (black) most metal-rich stars in each age bin, and the error bars show the scatter in [Fe/H]. A smaller number of stars per bin, for median and scatter, are used due to the smaller number of stars in the Miglio et al. (2021) catalogue. |
Here we perform the validation of our finding of the steep decline of upper [Fe/H] envelope starting ∼3 Gyr ago, as discussed in Sect. 3.2, using an external catalogue. We use the red-giant sample in the Kepler field from Miglio et al. (2021), reanalysed with the APOGEE DR17 parameters. After the recommended quality cuts and selecting stars with age < 12 Gyr and [Fe/H]>-0.7, we obtained a sample of 2 614 stars with a mean age uncertainty of 25%. Figure D.1 shows the time evolution of the upper envelope of the [Fe/H] for the asteroseismic sample. Similar to Fig. 3, the plot shows that our Galaxy attained high levels of [Fe/H] enrichment quite early with a slow decline until ∼ 3 Gyr ago, and then a steep decline after that. This confirms our finding of the dearth of SMR stars younger than 3 Gyr in the solar vicinity. In Fig. D.2 we show that the metal-rich stars ([Fe/H]>0.1) also show a bimodality in the guiding radius, similar to the finding with with the RVS-CNN sample, as discussed in Sect. 3.1.
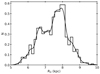 |
Fig. D.2. Distribution of the guiding radius (Rg) for the sample of metal-rich ([Fe/H]>0.1) red-giant stars with asteroseismic ages from the Miglio et al. (2021) catalogue. |
Appendix E: Guiding radii vs ages
In Fig. E.1 we present the stellar ages as a function of guiding radii, similar to the left plot of Fig. 3, in [Fe/H] bins similar to Fig. 2. The [Fe/H] values for each bin increases as we move from panel a) to panel i). The plot shows a large number of stars, with a significant presence of stars younger than ∼3 Gyr, for the sub-solar to solar metallicity bins, while the Rg bimodality is not clear. As we move to [Fe/H]>0.1, the Rg bimodality becomes stronger with increasing [Fe/H]. The figure shows an absence of metal-rich ([Fe/H]>0.1) stars younger than 2.7 Gyr (dashed line). We also see that the most metal-rich stars ([Fe/H]>0.3) are mostly old (11-6 Gyr).
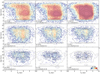 |
Fig. E.1. Stellar age as a function of guiding radii, similar to left plot of Fig. 3, in [Fe/H] bins similar to Fig. 2. A dashed black line at 2.7 Gyr is also shown. The colours represent the number of stars per bin. A kernel density estimate (KDE) is also overplotted. As the [Fe/H] increases the bimodality in guiding radius appears more clearly. At solar and sub-solar metallicities there are young stars, while for [Fe/H]>0.1 there is a near absence of stars younger than 2.7 Gyr old. |
Appendix F: Metal-rich stars as traces of bar activity
In Sect. 3.1 we discussed the [Fe/H] dependence of Rg bimodality revealed by the metal-rich stars. Here we test further to show how the metal-rich stars can trace bar activity.
Substructures and ridges found in the SNd (e.g. Antoja et al. 2018) have been well studied and attributed to the bar (for detailed discussions see Kawata et al. 2018; Fragkoudi et al. 2019; Chen et al. 2022). Similarly, the Hercules Moving Group, which shows higher metallicity compared to the disc, is thought to consist of stars undergoing radial migration (Liang et al. 2023), and corotation of the bar has been suggested as the physical mechanism for its formation (e.g. Pérez-Villegas et al. 2017; Monari et al. 2019; Khoperskov & Gerhard 2022; Liang et al. 2023).
In Fig. F.1 we show that our stars in the R versus Vϕ plane reveal the substructures in the phase-space. The density distribution (top panels) clearly shows ridges in the phase space for the whole sample (thin disc stars with Zmax < 1 kpc). These ridges are not visible for the metal-poor stars (middle panel), while they are clearly seen for the metal-rich stars. Furthermore, in the bottom panels we show how the undulations in VR are traced by our sample, primarily due to precise distances, thanks to Gaia. These undulations are very clear for the full sample and for the metal-rich set; however, the signature is noisy for the metal-poor sample.
In Fig. F.1 (middle and right panels) a black dashed line shows the location of the top sharp ridge seen in the full sample (top left). We observe an interesting feature showing a near absence of metal-rich stars beyond this line, while metal-poor stars are present. Khoperskov & Gerhard (2022), using high-resolution N-body simulations, attribute this sharp decrease in mean [Fe/H] to the effect of OLR of the bar which limits the migration of the metal-rich stars, coming from the inner Galaxy, beyond OLR.
These tests show that the metal-rich stars are indeed excellent tracers of bar activity.
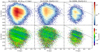 |
Fig. F.1. Substructures in Vϕ vs R plane revealed as a function of [Fe/H]. Top row: 2D density distribution showing the azimuthal velocity (Vϕ) as a function of galactocentric radius (R) for the disc stars (i.e. Zmax < 1 kpc) to reveal the ridge-like features. The left panel shows all stars, the middle panel the metal-poor stars ([Fe/H]< −0.2), and the right panel the metal-rich stars ([Fe/H]>0.1). Bottom row: Same plots as above, which reveal undulations when coloured by the VR. Both ridges and undulations are clearly seen for the full sample and the metal-rich stars, while these features are not as clear for the metal-poor stars. In the middle and right panels a dotted black line is drawn to represent the top sharp ridge seen in the top left density plot. |
All Figures
|
Fig. 1. Properties of our selected sample: (a) Distance from the Galactic mid-plane (Z) vs. the Galactocentric distance (R); (b) the Kiel diagram (log(g) vs. Teff); and (c) the [α/Fe] vs. [Fe/H] diagram for the sample, colour-coded by number density. |
| In the text | |
|
Fig. 2. Distribution of the guiding radii (Rg) in bins of metallicity ([Fe/H]). The [Fe/H] values increase from top left to bottom right, from panel a to panel i; the number of stars and the [Fe/H] range are shown. The two dotted lines at 6.9 and 7.9 kpc represent the two peaks of the Rg distribution. |
| In the text | |
|
Fig. 3. Age dependence of Rg and [Fe/H] for the metal-rich stars. Left panel: stellar ages as a function of guiding radii for stars with [Fe/H] > 0.1 dex. The colours represent the number of stars per bin. A kernel density estimate (KDE) is overplotted. A dashed black line at 2.7 Gyr is also shown. Right panel: Upper envelope of the age–metallicity relation traced by our full sample. The triangles represent the median [Fe/H] of the 20 most metal-rich stars in each age bin and the error bars show the scatter in [Fe/H]. |
| In the text | |
|
Fig. 4. Star formation history from the AMR and AAR. Top (a): 2D density distribution showing [Fe/H] as a function of stellar age for the full sample. Bottom (b): 2D density distribution showing [α/Fe] as a function of stellar age. A kernel density estimate (KDE) is also overplotted to highlight the density features in the AMR and AAR relationships. The colours represent number of stars per bin in log scale. |
| In the text | |
|
Fig. B.1. Velocity dispersions, radial (σVR, dashed), azimuthal (σVϕ, solid), and vertical (σVZ, dotted), as a function of stellar ages. The red circles represent the full sample, while the black stars represent the metal-rich ([Fe/H]>0.1) stars. |
| In the text | |
|
Fig. C.1. Kiel diagram and the CMD for the 256 metal-rich stars with 0.15 < [Fe/H]< 0.3 and 2 < Age (Gyr) < 4. For illustration purposes, PARSEC stellar isochrones for ages 2, 3, 3.5, 4, and 5 Gyr, and [Fe/H]= 0.1, 0.2, and 0.3 dex are included. The CMD uses JHKs absolute magnitudes from 2MASS, which were used as inputs for StarHorse to estimate ages. These stars most probably formed during the epoch of bar formation. |
| In the text | |
|
Fig. D.1. Upper envelope of the age–metallicity relation traced for the stars with asteroseismic ages from Miglio et al. (2021) and [Fe/H] from the APOGEE DR17 catalogue (Abdurro’uf et al. 2022). The triangles represent the median [Fe/H] of five (red) and ten (black) most metal-rich stars in each age bin, and the error bars show the scatter in [Fe/H]. A smaller number of stars per bin, for median and scatter, are used due to the smaller number of stars in the Miglio et al. (2021) catalogue. |
| In the text | |
|
Fig. D.2. Distribution of the guiding radius (Rg) for the sample of metal-rich ([Fe/H]>0.1) red-giant stars with asteroseismic ages from the Miglio et al. (2021) catalogue. |
| In the text | |
|
Fig. E.1. Stellar age as a function of guiding radii, similar to left plot of Fig. 3, in [Fe/H] bins similar to Fig. 2. A dashed black line at 2.7 Gyr is also shown. The colours represent the number of stars per bin. A kernel density estimate (KDE) is also overplotted. As the [Fe/H] increases the bimodality in guiding radius appears more clearly. At solar and sub-solar metallicities there are young stars, while for [Fe/H]>0.1 there is a near absence of stars younger than 2.7 Gyr old. |
| In the text | |
|
Fig. F.1. Substructures in Vϕ vs R plane revealed as a function of [Fe/H]. Top row: 2D density distribution showing the azimuthal velocity (Vϕ) as a function of galactocentric radius (R) for the disc stars (i.e. Zmax < 1 kpc) to reveal the ridge-like features. The left panel shows all stars, the middle panel the metal-poor stars ([Fe/H]< −0.2), and the right panel the metal-rich stars ([Fe/H]>0.1). Bottom row: Same plots as above, which reveal undulations when coloured by the VR. Both ridges and undulations are clearly seen for the full sample and the metal-rich stars, while these features are not as clear for the metal-poor stars. In the middle and right panels a dotted black line is drawn to represent the top sharp ridge seen in the top left density plot. |
| In the text | |
Current usage metrics show cumulative count of Article Views (full-text article views including HTML views, PDF and ePub downloads, according to the available data) and Abstracts Views on Vision4Press platform.
Data correspond to usage on the plateform after 2015. The current usage metrics is available 48-96 hours after online publication and is updated daily on week days.
Initial download of the metrics may take a while.