| Issue |
A&A
Volume 681, January 2024
|
|
|---|---|---|
| Article Number | L2 | |
| Number of page(s) | 6 | |
| Section | Letters to the Editor | |
| DOI | https://doi.org/10.1051/0004-6361/202348114 | |
| Published online | 22 December 2023 | |
Letter to the Editor
A companion in V1247 Ori supported by motion in the pattern of the spiral arm⋆,⋆⋆
1
Université Côte d’Azur, Observatoire de la Côte d’Azur, CNRS, Laboratoire Lagrange, Bd de l’Observatoire, CS 34229, 06304 Nice Cedex 4, France
e-mail: This email address is being protected from spambots. You need JavaScript enabled to view it.
2
Université Grenoble Alpes, CNRS, Institut de Planétologie et d’Astrophysique (IPAG), 38000 Grenoble, France
3
Department of Physics and Astronomy, The Johns Hopkins University, 3701 San Martin Drive, Baltimore, MD 21218, USA
4
Aix Marseille Univ., CNRS, CNES, LAM, Marseille, France
e-mail: This email address is being protected from spambots. You need JavaScript enabled to view it.
5
Department of Physics & Astronomy, University of Victoria, Victoria, BC V8P 5C2, Canada
6
Department of Astronomy, University of Florida, Gainesville, FL 32611, USA
7
Leiden Observatory, Leiden University, Niels Bohrweg 2, 2333 CA Leiden, The Netherlands
8
European Southern Observatory, Alonso de Córdova 3107, Vitacura Casilla, 19001 Santiago, Chile
9
AURA, for ESA, Space Telescope Science Institute, 3700 San Martin Dr., Baltimore, MD 21218, USA
10
INAF, Osservatorio Astrofisico di Arcetri, Largo Enrico Fermi 5, 50125 Firenze, Italy
11
School of Natural Sciences, University of Galway, University Road, H91 TK33 Galway, UK
12
Astrophysics Group, Department of Physics & Astronomy, University of Exeter, Stocker Road, Exeter EX4 4QL, UK
Received:
29
September
2023
Accepted:
6
December
2023
Abstract
While nearly two dozen spiral arms have been detected from planet-forming disks in near-infrared scattered light, none of their substellar drivers has been confirmed. By observing spiral systems in at least two epochs spanning multiple years and measuring the motion of the spirals, we can distinguish what causes the spirals and locate the orbits of the driving planets if the spirals are triggered by them. Upon a recent validation of this approach using the comotion between a stellar companion and a spiral, we obtained a second-epoch observation for the spiral system in the disk of V1247 Ori in the H-band polarized scattered light using Very Large Telescope (VLT), SPHERE, and IRDIS. By combining our observations with archival IRDIS data, we established a 4.8 yr timeline to constrain the spiral motion of V1247 Ori. We obtained a pattern speed of 0°.40 ± 0°.10 yr−1 for the northeast spiral. This corresponds to an orbital period of 900 ± 220 yr, and the semimajor axis of the hidden planetary driver therefore is 118 ± 20 au for a 2.0 ± 0.1 M⊙ central star. The location agrees with the gap in ALMA dust-continuum observations, which provides joint support for the hypothesis that a companion drives the scattered-light spirals while carving a millimeter gap. With an angular separation of 0″.29 ± 0″.05, this hidden companion is an ideal target for JWST imaging.
Key words: techniques: high angular resolution / protoplanetary disks / planet-disk interactions / stars: individual: V1247 Ori
Data files associated to Fig. 1 are available at the CDS via anonymous ftp to cdsarc.cds.unistra.fr (130.79.128.5) or via https://cdsarc.cds.unistra.fr/viz-bin/cat/J/A+A/681/L2
Based on observations performed with VLT/SPHERE under program ID 0102.C-0778 and 111.24GG.
Marie Skłodowska-Curie fellow.
© The Authors 2023
 Open Access article, published by EDP Sciences, under the terms of the Creative Commons Attribution License (https://creativecommons.org/licenses/by/4.0), which permits unrestricted use, distribution, and reproduction in any medium, provided the original work is properly cited.
This article is published in open access under the Subscribe to Open model. This email address is being protected from spambots. You need JavaScript enabled to view it. to support open access publication.
1. Introduction
Over the course of the past decade of direct-imaging attempts for self-luminous planets using dedicated high-contrast imaging instruments (e.g., Nielsen et al. 2020; Vigan et al. 2021), only a handful of these planets have newly been discovered and confirmed (e.g., Macintosh et al. 2015; Chauvin et al. 2017; Keppler et al. 2018; Haffert et al. 2019). The low detection rate called for optimized and targeted observing strategies in more recent studies that included young systems (e.g., Bohn et al. 2021), stellar radial velocity (e.g., Lagrange et al. 2019; Nowak et al. 2020), astrometric acceleration (e.g., Currie et al. 2023; Franson et al. 2023; De Rosa et al. 2023; Mesa et al. 2023) evidence, and the morphological deviation of circumstellar disks (e.g., Bae et al. 2019; Haffert et al. 2019; Wang et al. 2020).
Targeted imaging based on deviations from stellar signals (e.g., radial velocity or astrometry) have produced fruitful results. It may take up to several decades to investigate whether planets exist by monitoring these signals (e.g., Lagrange et al. 2019; Currie et al. 2023), however, and the monitoring relies on instruments whose stability and sensitivity could have improved significantly over time. Meanwhile, substructures engraved on circumstellar disks by planets have suggested that planets might exist (e.g., Dong et al. 2015a, 2016a; Bae et al. 2016; Zhang et al. 2018; Long et al. 2022). Of all planet-induced structures, spiral arms might be the best systems for a targeted high-contrast imaging search because their planetary drivers tend to be more massive (e.g., Bae et al. 2018) and thus more luminous (e.g., Spiegel & Burrows 2012). They are more likely to be accessed by the current generation of high-contrast imaging instruments.
The pattern motion of a spiral arm when driven by a companion follows the orbital motion of its driver (e.g., Dong et al. 2015a; Bae & Zhu 2018). By tracing the motion of the spirals, we can constrain the orbit of a hidden driver (Ren et al. 2018) and trace the motion back to its cause. In this way, we can determine the mechanism (i.e., companion-driven and gravity-instatbility-induction: Ren et al. 2020). By showing the first dynamic evidence of comotion between a stellar companion and a spiral in the system HD 100453, Xie et al. (2023) confirmed the theory of companion-driven spirals (e.g., Dong et al. 2015a, 2016a; Bae et al. 2016). This confirms that the monitoring of spiral motion is a major science case for future extremely large telescopes (Maire et al. 2021). After first light for the current high-contrast imagers in ≈2015, we can now reimage the spirals with the same instrument across a separation of ≈5 yr (e.g., Ren et al. 2020; Xie et al. 2023), and we therefore expect a rapid expansion of these studies (Benisty et al. 2023). When a spiral system is confirmed to be driven by hidden planetary companions, we can conduct targeted imaging to determine whether a planet exists (e.g., Wagner et al. 2019, 2023; Boccaletti et al. 2021).
The known spiral arm hosts (e.g., Dong et al. 2018; Shuai et al. 2022), V1247 Ori include an A5III or F0V star (e.g., Kharchenko 2001; Vieira et al. 2003) located at 401 ± 3 pc (Gaia Collaboration 2023). With an estimated age of 7.0 ± 0.3 Myr (Garufi et al. 2018), it hosts a pair of nearly symmetric spiral arms in scattered light (e.g., H-band: Shuai et al. 2022) and a gap in Atacama Large Millimeter Array (ALMA) submillimeter/millimeter observations (e.g., Band 7: Kraus et al. 2017). Based on the morphology of the dust continuum, Kraus et al. (2017) proposed that a planet at  , or 120 au with the updated distances from Gaia DR3, from the star could carve the ALMA gap. While it is possible that the V1247 Ori spirals could be triggered by a recent stellar flyby (i.e., ≈104 yr in time, and at a separation of about ten times the disk radius), using the location and proper motion measurements from Gaia DR3, Shuai et al. (2022) identified no flyby events for V1247 Ori. In addition, the spirals might be triggered by gravitational instability, but the disk-to-star mass ratio should be q ≳ 0.25 in Dong et al. (2015b), which contradicts the q ≈ 0.04 from Yu et al. (2019). This combined evidence means that the system V1247 Ori might host a planetary companion that drives the spirals in scattered light. By reimaging V1247 Ori in scattered light at another epoch, we will be able to test observationally whether the spiral motion is consistent with being driven by a planet in the ALMA dust continuum gap.
To observationally constrain the motion pattern for existing spiral systems, the dedicated survey Spiral Arm Formation from mOtion aNalysis (SAFFRON; ESO programs 111.24GG and 112.25B7) acquires additional epoch(s) of existing spirals with a total allocation of 54.5 h from VLT, SPHERE, and IRDIS. For these systems, we can use the spiral motion to distinguish whether the motion is driven by a companion or by gravitational instability (Ren et al. 2020), predict the orbits of hidden drivers (e.g., Ren et al. 2018; Xie et al. 2021), and confirm the connection between known companion(s) and spiral(s) (Xie et al. 2023). Through SAFFRON observations, we aim to constrain the pattern motion for all the spiral systems in near-infrared scattered light (e.g., Shuai et al. 2022). Moreover, if the motions are consistent with being driven by companions, we will be able to map the orbital distribution of these hidden planets. In this Letter, we report the first result from the SAFFRON survey for V1247 Ori.
2. Observation and data reduction
Using VLT, we observed V1247 Ori using the infrared dual-band imager and spectrograph (IRDIS; Dohlen et al. 2008) on SPHERE (Beuzit et al. 2019) in dual-beam polarimetric imaging (DPI; de Boer et al. 2020; van Holstein et al. 2020) mode at the H band (1.625 μm) on UT 2023 September 20 under ESO program 111.24GG in SAFFRON (PI: B. Ren). The observation complements the observation on 2018 November 16 under ESO program 0102.C-0778 (PI: S. Kraus) to enable a precise measurement of the motion of the spiral pattern.
To ensure that the motion of the spiral pattern was measured with similar data quality for the measurement of the spiral pattern motion, we minimized the observational difference as follows. Specifically, we adopted the same 32 s exposure in each integration. There are 9 polarimetric cycles through Q+, Q−, U+, and U− with three integrations per exposure in 2018 and 15 polarimetric cycles with one integration per exposure in 2023. We totaled 3456 s on-target time in 2018 and 1920 s in 2023. At the end of the observations, 128 s and 32 s total exposure were available for sky background removal in 2018 and 2023, respectively.
We reduced the two observed IRDIS DPI data sets using the IRDAP pipeline (van Holstein et al. 2017, 2020). In the reduction, we also adopted the parallactic angles calculated using the Stolker et al. (2019) pipeline for SPHERE. To enable precise measurement of the spiral location and motion in the further analysis, we additionally stretched the preprocessed cubes by 1.006 along the column direction of the detector to correct for the anamorphism from optical distortions in SPHERE (e.g., Schmid et al. 2018). Of the postprocessed data products from IRDAP, we used the star-polarization-subtracted local Stokes 𝒬ϕ map, which traces the distribution of dust particles on the surfaces of disks (e.g., Monnier et al. 2019), for the analysis. We present the 𝒬ϕ images from the two epochs and annotate the spiral arms in Fig. 1.
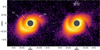 |
Fig. 1. Two epoch 𝒬ϕ images of V1247 Ori with SPHERE/IRDIS in H band on 2018 November 16 (left) and on 2023 September 20 (right). The color bars are in log scale. The dashed lines are the boundaries for the motion measurement in Fig. 2. (The data used to create this figure are available at the CDS.) |
To reduce the impact of stellar light illumination as a function of stellocentric radius (the incident flux reduces as distance squared), the surface density distribution images were used to analyze the motion (e.g., Xie et al. 2023). Specifically, we scaled the surface brightness distribution for the two 𝒬ϕ images of V1247 Ori. We adopted an inclination of  from face-on, and a position angle of
  for the major axis of the disk from north to east from the ALMA analysis (Kraus et al. 2017). To correct for disk-flaring effects, we assumed that the disk scale height, h, follows h/r = 0.05, where r is radial separation (Kraus et al. 2017). We then computed the midplane stellocentric distances, r, for all image pixels, and multiplied the value at each pixel by r2 to reveal the distribution of the scatterers, which typically trace the surface morphology and roughly trace the dust surface density.
3. Analysis
To measure the location of the spiral, we analyzed the r2-scaled 𝒬ϕ images as follows. First, we deprojected the disk images to face-on views. Second, we determined the local maxima of the spiral arm in polar coordinates: We performed three Gaussian profile fits with an additional constant in a total of ten free parameters (e.g., Ren et al. 2020; Xie et al. 2023). The additional constant takes the overall disk brightness offset at a specific location into account. Specifically, multiple spirals might exist at a specific azimuthal angle, and we therefore adopted three Gaussian profiles for the two wrapped arm components along the radial direction (e.g., the ≈2 o’clock region in Fig. 1). Third, in each azimuthal angle, we performed fittings to obtain the locations of the spiral arms with an angular step of 1°. We present the locations for a selected region of the northeast spiral S1 in Fig. 2. For measurements of the entirety of the two spirals, see Figs. A.1 and A.2. However, because the two spirals are visually merged interior to ≈125 au due to the finite resolution of VLT/SPHERE, the motion measurements for the entirety of the two spirals are likely biased. We therefore only focus on the exterior region of S1 marked in Fig. 1 in this study.
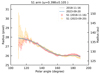 |
Fig. 2. Peak locations of spiral arm S1 between 110° and 190° in polar coordinates in the disk plane. The solid curves represent the best-fit model spiral for the peak locations (dots) between 2018 and 2023 (t = 4.84 yr), assuming the companion-driven scenario. The derived angular velocity of the motion of the spiral pattern is |

To simultaneously derive the spiral pattern motion and its morphological parameters, we fit p-degree polynomials with a dummy variable to a given spiral arm in two epochs as described in Ren et al. (2020). The Schwarz information criterion, which penalizes the excessive use of parameters, is minimized at p = 5, and thus, we adopted the corresponding results for the motion analysis. Using the dummy variable, we simultaneously fit an identical but offset polynomial to a spiral at both epochs. The large extent of spiral arm S1 enables us to explore motion measurements for different parts of the spiral (see Fig. 2 for a specific area of S1, and Fig. A.1 for the entirety of S1).
The measurement of the location of the spiral and the pattern speed can be affected by multiple factors for V1247 Ori. On the one hand, with an inclination of ≈30° (e.g., Kraus et al. 2017; Bohn et al. 2022), the spiral morphology of V1247 Ori might be distorted (limiting inclination of ≈20°: Dong et al. 2016b). On the other hand, global shadowing effects are visible in the northeast regions in Fig. 1, which might be cast by inner disks (e.g., Debes et al. 2017, 2023). Due to the non-negligible inclination of the system (≈30°) and the given angular resolution of SPHERE (51 mas in H band for an effective pupil of 8.0 m), the location and motion measurement for the entirety of S1 and S2 in Figs. A.1 and A.2 might therefore be biased. Specifically, the morphology of the spiral can be altered when the disk is not seen face-on (≳20° inclination: Dong et al. 2016b), and when spirals are driven by an identical but eccentric companion (e.g., Calcino et al. 2020), Xie et al. (2023) showed that spirals might have different apparent motion.
To quantify the spiral motion, we focus on a specific region in the S1 spiral in Fig. 2 to measure the motion. As reported in Xie et al. (2023), the spiral location and motion should be measured for a disk surface that is approximately face-on through a combination of disk inclination and disk flaring. For this purpose, we focused on a spiral region in S1 with a stellocentric radius of 125 − 140 au, which spans an azimuthal coverage of ≈80° from the disk midplane. In this region, the inclination and flaring of the spiral cause the disk surface to be closer to a face-on view, and we measured its spiral motion of S1 to be1
 (1)
(1)
counterclockwise in Fig. 2. We obtained the uncertainty in Eq. (1) using  , where σfit and σnorth are the uncertainties caused by the measurement of the spiral locations and the true north uncertainty of SPHERE, respectively. The time span between the two epochs is represented by t, which is 4.84 yr. The selected locations in S1 return a fitting uncertainty
  yr−1. We adopted the true north uncertainty of SPHERE as
  in all epochs (Maire et al. 2016). We also adopted an astrometric uncertainty of ≈2 mas (Zurlo et al. 2014, Fig. 7 therein), or 0.16 IRDIS pixel, and thus an offset of
  in polar coordinates. The combined uncertainty in the motion rate is thus
  yr−1.
yr−1.
Data sampling and disk parameters may affect the measurement of the spiral motion. Different data sampling (e.g., a Nyquist sampling has an angular step of 5°) gives a consistent spiral motion of  yr−1 with a slightly larger total uncertainty. Correlated noise in the oversampling case (an angular step of 1°) may lead to an underestimated total uncertainty. However, given the consistent motion measurements and the minor impact on the uncertainty, a proper estimation of the correlated noise (e.g., Czekala et al. 2015) in the oversampling case is beyond the scope of this work. The impact from the disk parameters (e.g., inclination, flaring, and position angle) has been extensively analyzed (e.g., Sect. 4.5 of Ren et al. 2020, Sect. 4.2 of Xie et al. 2021, and Appendix D of Xie et al. 2023), showing that the corresponding impact resides within the derived motion uncertainty.
The pattern motion of S1 in the selected region in Fig. 1 is  yr−1 in Eq. (1), which corresponds to a driver at 118 ± 20 au on a circular orbit from a central star with 2.0 ± 0.1 M⊙ (Garufi et al. 2018). To illustrate its orbit, we obtained the ALMA Band 7 continuum observations of V1247 Ori from Kraus et al. (2017). Together with the scattered-light 𝒬ϕ image, we present the predicted driver orbit in Fig. 3.
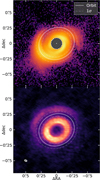 |
Fig. 3. Driver orbit from the motion of the S1 spiral pattern, overlaid on observations in the SPHERE H band 𝒬ϕ (top; UT 2023 September 20) and ALMA Band 7 continuum (bottom; UT 2017 August 9). For a central star with 2.0 ± 0.1 M⊙, the |


Our measurement in Fig. 2 cannot confidently rule out local gravitational motion, with a local Keplerian motion at 125 au ( ) to 140 au (
 ) of
) of  yr−1 to
  yr−1, respectively. However, the disk-to-star mass ratio of V1247 Ori is q ≈ 0.04 from Yu et al. (2019), which means that it is unlikely to trigger local gravitational instability for the spiral motion. If the V1247 Ori spirals were triggered by gravitational instability, the disk-to-star mass ratio should be q ≳ 0.25 in Dong et al. (2015b), which is more massive by about six times than the current ratio and is thus unlikely.
In comparison with the ALMA data, if the proposed gap-opening planet in Kraus et al. (2017) drives the spiral, the pattern motion of the spiral for a star with a mass of 2.0 ± 0.1 M⊙ should be  yr−1. This is consistent within 1σ with the measured pattern motion in Eq. (1). With our motion measurement, we offer dynamical evidence that a spiral-arm-driving planet probably exists in scattered light, and this driver simultaneously carves the millimeter gap in Kraus et al. (2017).
4. Conclusion
The pattern motion of spirals can inform us about their formation mechanisms (e.g., Ren et al. 2020). If it is driven by a companion, then the motion of the spiral pattern traces the orbit of its driver (e.g., Ren et al. 2018; Safonov et al. 2022). With two epochs of polarized-light observations spanning 4.84 yr, we constrained the pattern motion for the S1 spiral in scattered light in the V1247 Ori system to be  yr−1 counterclockwise. For a 2.0 ± 0.1 M⊙ star, this translates into a semi-major axis of 118 ± 20 au, or
  , for the hidden companion that drives the spiral arm.
The companion that drives the spiral arm in Fig. 3 is not yet imaged for V1247 Ori in ground-based observatories (e.g., Ohta et al. 2016; Willson et al. 2019; Follette et al. 2023; Wallack et al. 2023). Based on the misalignments between the inner and outer disks (e.g., Bohn et al. 2022; Wölfer et al. 2023), we can rule out such a companion-spiral connection at the > 5σ level from our motion measurements even if an inner companion exists that creates the inner cavity in ALMA and drives the spirals behind the coronagraph ( ) in Fig. 1.
This hidden companion that might drive spiral(s) in scattered light and might carve a gap in the millimeter continuum is the first for which two different pieces of observational evidence have been presented that support its existence. Because ground-based instruments are limited in sensitivity for this driver (≈80 Jupiter mass; Ren et al. 2023) and because the JWST/NIRCam coronagraphic mode was demonstrated to have a superior sensitivity in Carter et al. (2023), and also because planetary drivers for a pair of symmetric spirals should have 5 − 10 Jupiter mass (i.e., Dong et al. 2015a; Bae et al. 2016), the driver we located here for V1247 Ori is an ideal target for coronagraphic imaging with the JWST/NIRCam.
The derived uncertainties presented in this Letter are 1σ unless otherwise specified.
Acknowledgments
We thank the anonymous referee for their comments and suggestions that improved the quality of this Letter. We thank Andrew Winter and Jochen Stadler for discussions. Based on observations collected at the European Organisation for Astronomical Research in the Southern Hemisphere under ESO programmes 0102.C-0778 and 111.24GG. This project has received funding from the European Union’s Horizon Europe research and innovation programme under the Marie Skłodowska-Curie grant agreement No. 101103114. This project has received funding from the European Research Council (ERC) under the European Union’s Horizon 2020 research and innovation programme (PROTOPLANETS, grant agreement No. 101002188). R.D. acknowledges financial support provided by the Natural Sciences and Engineering Research Council of Canada through a Discovery Grant, as well as the Alfred P. Sloan Foundation through a Sloan Research Fellowship. This Letter makes use of the following ALMA data: ADS/JAO.ALMA#2015.1.00986.S. ALMA is a partnership of ESO (representing its member states), NSF (USA) and NINS (Japan), together with NRC (Canada), MOST and ASIAA (Taiwan, ROC), and KASI (Republic of Korea), in cooperation with the Republic of Chile. The Joint ALMA Observatory is operated by ESO, AUI/NRAO and NAOJ. This work has made use of data from the European Space Agency (ESA) mission Gaia (https://www.cosmos.esa.int/gaia), processed by the Gaia Data Processing and Analysis Consortium (DPAC, https://www.cosmos.esa.int/web/gaia/dpac/consortium).
References
- Bae, J., & Zhu, Z. 2018, ApJ, 859, 119 [Google Scholar]
- Bae, J., Zhu, Z., & Hartmann, L. 2016, ApJ, 819, 134 [NASA ADS] [CrossRef] [Google Scholar]
- Bae, J., Pinilla, P., & Birnstiel, T. 2018, ApJ, 864, L26 [Google Scholar]
- Bae, J., Zhu, Z., Baruteau, C., et al. 2019, ApJ, 884, L41 [NASA ADS] [CrossRef] [Google Scholar]
- Benisty, M., Dominik, C., Follette, K., et al. 2023, ASP Conf. Ser., 534, 605 [NASA ADS] [Google Scholar]
- Beuzit, J. L., Vigan, A., Mouillet, D., et al. 2019, A&A, 631, A155 [NASA ADS] [CrossRef] [EDP Sciences] [Google Scholar]
- Boccaletti, A., Pantin, E., Ménard, F., et al. 2021, A&A, 652, L8 [NASA ADS] [CrossRef] [EDP Sciences] [Google Scholar]
- Bohn, A. J., Ginski, C., Kenworthy, M. A., et al. 2021, A&A, 648, A73 [NASA ADS] [CrossRef] [EDP Sciences] [Google Scholar]
- Bohn, A. J., Benisty, M., Perraut, K., et al. 2022, A&A, 658, A183 [NASA ADS] [CrossRef] [EDP Sciences] [Google Scholar]
- Calcino, J., Christiaens, V., Price, D. J., et al. 2020, MNRAS, 498, 639 [CrossRef] [Google Scholar]
- Carter, A. L., Hinkley, S., Kammerer, J., et al. 2023, ApJ, 951, L20 [NASA ADS] [CrossRef] [Google Scholar]
- Chauvin, G., Desidera, S., Lagrange, A. M., et al. 2017, A&A, 605, L9 [NASA ADS] [CrossRef] [EDP Sciences] [Google Scholar]
- Currie, T., Brandt, G. M., Brandt, T. D., et al. 2023, Science, 380, 198 [NASA ADS] [CrossRef] [Google Scholar]
- Czekala, I., Andrews, S. M., Mandel, K. S., et al. 2015, ApJ, 812, 128 [NASA ADS] [CrossRef] [Google Scholar]
- de Boer, J., Langlois, M., van Holstein, R. G., et al. 2020, A&A, 633, A63 [NASA ADS] [CrossRef] [EDP Sciences] [Google Scholar]
- De Rosa, R. J., Nielsen, E. L., Wahhaj, Z., et al. 2023, A&A, 672, A94 [NASA ADS] [CrossRef] [EDP Sciences] [Google Scholar]
- Debes, J. H., Poteet, C. A., Jang-Condell, H., et al. 2017, ApJ, 835, 205 [NASA ADS] [CrossRef] [Google Scholar]
- Debes, J., Nealon, R., Alexander, R., et al. 2023, ApJ, 948, 36 [NASA ADS] [CrossRef] [Google Scholar]
- Dohlen, K., Langlois, M., Saisse, M., et al. 2008, Proc. SPIE, 7014, 70143L [Google Scholar]
- Dong, R., Zhu, Z., Rafikov, R. R., & Stone, J. M. 2015a, ApJ, 809, L5 [Google Scholar]
- Dong, R., Hall, C., Rice, K., & Chiang, E. 2015b, ApJ, 812, L32 [Google Scholar]
- Dong, R., Zhu, Z., Fung, J., et al. 2016a, ApJ, 816, L12 [Google Scholar]
- Dong, R., Fung, J., & Chiang, E. 2016b, ApJ, 826, 75 [Google Scholar]
- Dong, R., Najita, J. R., & Brittain, S. 2018, ApJ, 862, 103 [Google Scholar]
- Follette, K. B., Close, L. M., Males, J. R., et al. 2023, AJ, 165, 225 [NASA ADS] [CrossRef] [Google Scholar]
- Franson, K., Bowler, B. P., Zhou, Y., et al. 2023, ApJ, 950, L19 [NASA ADS] [CrossRef] [Google Scholar]
- Gaia Collaboration (Vallenari, A., et al.) 2023, A&A, 674, A1 [NASA ADS] [CrossRef] [EDP Sciences] [Google Scholar]
- Garufi, A., Benisty, M., Pinilla, P., et al. 2018, A&A, 620, A94 [NASA ADS] [CrossRef] [EDP Sciences] [Google Scholar]
- Haffert, S. Y., Bohn, A. J., de Boer, J., et al. 2019, Nat. Astron., 3, 749 [Google Scholar]
- Keppler, M., Benisty, M., Müller, A., et al. 2018, A&A, 617, A44 [NASA ADS] [CrossRef] [EDP Sciences] [Google Scholar]
- Kharchenko, N. V. 2001, Kinematika i Fizika Nebesnykh Tel, 17, 409 [NASA ADS] [Google Scholar]
- Kraus, S., Kreplin, A., Fukugawa, M., et al. 2017, ApJ, 848, L11 [Google Scholar]
- Lagrange, A. M., Meunier, N., Rubini, P., et al. 2019, Nat. Astron., 3, 1135 [NASA ADS] [CrossRef] [Google Scholar]
- Long, F., Andrews, S. M., Zhang, S., et al. 2022, ApJ, 937, L1 [NASA ADS] [CrossRef] [Google Scholar]
- Macintosh, B., Graham, J. R., Barman, T., et al. 2015, Science, 350, 64 [Google Scholar]
- Maire, A.-L., Langlois, M., Dohlen, K., et al. 2016, Proc. SPIE, 9908, 990834 [Google Scholar]
- Maire, A. L., Langlois, M., Delorme, P., et al. 2021, in SF2A-2021: Proceedings of the Annual meeting of the French Society of Astronomy and Astrophysics, ed. A. Siebert, 129 [Google Scholar]
- Mesa, D., Gratton, R., Kervella, P., et al. 2023, A&A, 672, A93 [NASA ADS] [CrossRef] [EDP Sciences] [Google Scholar]
- Monnier, J. D., Harries, T. J., Bae, J., et al. 2019, ApJ, 872, 122 [Google Scholar]
- Montesinos, M., & Cuello, N. 2018, MNRAS, 475, L35 [NASA ADS] [CrossRef] [Google Scholar]
- Nielsen, E. L., De Rosa, R. J., Wang, J. J., et al. 2020, AJ, 159, 71 [Google Scholar]
- Nowak, M., Lacour, S., Lagrange, A. M., et al. 2020, A&A, 642, L2 [NASA ADS] [CrossRef] [EDP Sciences] [Google Scholar]
- Ohta, Y., Fukagawa, M., Sitko, M. L., et al. 2016, PASJ, 68, 53 [Google Scholar]
- Ren, B., Dong, R., Esposito, T. M., et al. 2018, ApJ, 857, L9 [Google Scholar]
- Ren, B., Dong, R., van Holstein, R. G., et al. 2020, ApJ, 898, L38 [NASA ADS] [CrossRef] [Google Scholar]
- Ren, B. B., Benisty, M., Ginski, C., et al. 2023, A&A, in press, https://doi.org/10.1051/0004-6361/202347353 [Google Scholar]
- Safonov, B. S., Strakhov, I. A., Goliguzova, M. V., & Voziakova, O. V. 2022, AJ, 163, 31 [NASA ADS] [CrossRef] [Google Scholar]
- Schmid, H. M., Bazzon, A., Roelfsema, R., et al. 2018, A&A, 619, A9 [NASA ADS] [CrossRef] [EDP Sciences] [Google Scholar]
- Shuai, L., Ren, B. B., Dong, R., et al. 2022, ApJS, 263, 31 [NASA ADS] [CrossRef] [Google Scholar]
- Spiegel, D. S., & Burrows, A. 2012, ApJ, 745, 174 [Google Scholar]
- Stolker, T., Bonse, M. J., Quanz, S. P., et al. 2019, A&A, 621, A59 [NASA ADS] [CrossRef] [EDP Sciences] [Google Scholar]
- van Holstein, R. G., Snik, F., Girard, J. H., et al. 2017, Proc. SPIE, 10400, 1040015 [Google Scholar]
- van Holstein, R. G., Girard, J. H., de Boer, J., et al. 2020, A&A, 633, A64 [NASA ADS] [CrossRef] [EDP Sciences] [Google Scholar]
- Vieira, S. L. A., Corradi, W. J. B., Alencar, S. H. P., et al. 2003, AJ, 126, 2971 [Google Scholar]
- Vigan, A., Fontanive, C., Meyer, M., et al. 2021, A&A, 651, A72 [EDP Sciences] [Google Scholar]
- Wagner, K., Stone, J. M., Spalding, E., et al. 2019, ApJ, 882, 20 [Google Scholar]
- Wagner, K., Stone, J., Skemer, A., et al. 2023, Nat. Astron., 7, 1208 [CrossRef] [Google Scholar]
- Wallack, N. L., Ruffio, J. B., Ruane, G., et al. 2023, AJ, in press [Google Scholar]
- Wang, J. J., Ginzburg, S., Ren, B., et al. 2020, AJ, 159, 263 [Google Scholar]
- Willson, M., Kraus, S., Kluska, J., et al. 2019, A&A, 621, A7 [EDP Sciences] [Google Scholar]
- Wölfer, L., Facchini, S., van der Marel, N., et al. 2023, A&A, 670, A154 [CrossRef] [EDP Sciences] [Google Scholar]
- Xie, C., Ren, B., Dong, R., et al. 2021, ApJ, 906, L9 [NASA ADS] [CrossRef] [Google Scholar]
- Xie, C., Ren, B. B., Dong, R., et al. 2023, A&A, 675, L1 [NASA ADS] [CrossRef] [EDP Sciences] [Google Scholar]
- Yu, S.-Y., Ho, L. C., & Zhu, Z. 2019, ApJ, 877, 100 [Google Scholar]
- Zhang, S., Zhu, Z., Huang, J., et al. 2018, ApJ, 869, L47 [Google Scholar]
- Zurlo, A., Vigan, A., Mesa, D., et al. 2014, A&A, 572, A85 [NASA ADS] [CrossRef] [EDP Sciences] [Google Scholar]
Appendix A: Alternative measurements
We present the measured values for the entirety of the S1 and S2 arms here. The ≈30° inclination effects (Dong et al. 2016b) and shadowing effects (Montesinos & Cuello 2018) in Fig. 1 bias the motion of the entire spirals. However, we present the results here to show the global motion, which might be indicative of eccentric drivers (Calcino et al. 2020; Xie et al. 2023).
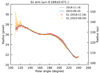 |
Fig. A.1. Peak locations of spiral arm S1 (full arm) in polar coordinates after correction for viewing geometry. The solid curves represent the best-fit model spiral for the peak locations (dots) between 2018 and 2023 (t = 4.84 yr), assuming the companion-driven scenario. The derived angular velocities of the motion of the spiral pattern are |

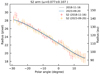 |
Fig. A.2. Peak locations of spiral arm S2 in polar coordinates after correction for viewing geometry. The solid curves represent the best-fit model spiral for the peak locations (dots) between 2018 and 2023 (t = 4.84 yr), assuming the companion-driven scenario. The derived angular velocities of the motion of the spiral pattern are |

All Figures
|
Fig. 1. Two epoch 𝒬ϕ images of V1247 Ori with SPHERE/IRDIS in H band on 2018 November 16 (left) and on 2023 September 20 (right). The color bars are in log scale. The dashed lines are the boundaries for the motion measurement in Fig. 2. (The data used to create this figure are available at the CDS.) |
| In the text | |
|
Fig. 2. Peak locations of spiral arm S1 between 110° and 190° in polar coordinates in the disk plane. The solid curves represent the best-fit model spiral for the peak locations (dots) between 2018 and 2023 (t = 4.84 yr), assuming the companion-driven scenario. The derived angular velocity of the motion of the spiral pattern is |
| In the text | |
|
Fig. 3. Driver orbit from the motion of the S1 spiral pattern, overlaid on observations in the SPHERE H band 𝒬ϕ (top; UT 2023 September 20) and ALMA Band 7 continuum (bottom; UT 2017 August 9). For a central star with 2.0 ± 0.1 M⊙, the |
| In the text | |
|
Fig. A.1. Peak locations of spiral arm S1 (full arm) in polar coordinates after correction for viewing geometry. The solid curves represent the best-fit model spiral for the peak locations (dots) between 2018 and 2023 (t = 4.84 yr), assuming the companion-driven scenario. The derived angular velocities of the motion of the spiral pattern are |
| In the text | |
|
Fig. A.2. Peak locations of spiral arm S2 in polar coordinates after correction for viewing geometry. The solid curves represent the best-fit model spiral for the peak locations (dots) between 2018 and 2023 (t = 4.84 yr), assuming the companion-driven scenario. The derived angular velocities of the motion of the spiral pattern are |
| In the text | |
Current usage metrics show cumulative count of Article Views (full-text article views including HTML views, PDF and ePub downloads, according to the available data) and Abstracts Views on Vision4Press platform.
Data correspond to usage on the plateform after 2015. The current usage metrics is available 48-96 hours after online publication and is updated daily on week days.
Initial download of the metrics may take a while.