| Issue |
A&A
Volume 679, November 2023
|
|
|---|---|---|
| Article Number | L2 | |
| Number of page(s) | 7 | |
| Section | Letters to the Editor | |
| DOI | https://doi.org/10.1051/0004-6361/202347771 | |
| Published online | 31 October 2023 | |
Letter to the Editor
Uncovering the MIR emission of quiescent galaxies with JWST⋆
1
Cosmic Dawn Center (DAWN), Denmark
2
DTU Space, Technical University of Denmark, Elektrovej 327, 2800 Kgs. Lyngby, Denmark
e-mail: This email address is being protected from spambots. You need JavaScript enabled to view it.
3
Niels Bohr Institute, University of Copenhagen, Jagtvej 128, 2200 Copenhagen, Denmark
4
Université Paris-Saclay, Université Paris Cité, CEA, CNRS, AIM, 91191 Gif-sur-Yvette, France
5
Kapteyn Astronomical Institute, University of Groningen, PO Box 800 9700 AV Groningen, The Netherlands
6
European Southern Observatory, Karl-Schwarzschild-Str. 2, 85748 Garching, Germany
7
Institute of Astrophysics, Foundation for Research and Technology-Hellas (FORTH), Heraklion 70013, Greece
8
School of Sciences, European University Cyprus, Diogenes street, Engomi, 1516 Nicosia, Cyprus
9
National Observatory of Athens, Institute for Astronomy, Astrophysics, Space Applications and Remote Sensing, Ioannou Metaxa and Vasileos Pavlou, 15236 Athens, Greece
10
Department of Astrophysics, Astronomy & Mechanics, School of Physics, Aristotle University of Thessaloniki, 54124 Thessaloniki, Greece
11
Astrophysics, Department of Physics, University of Oxford, Keble Road, Oxford OX1 3RH, UK
12
DARK, Niels Bohr Institute, University of Copenhagen, Jagtvej 128, 2200 Copenhagen, Denmark
13
Instituto de Física, Pontificia Universidad Católica de Valparaíso, Casilla, 4059 Valparaíso, Chile
Received:
21
August
2023
Accepted:
2
October
2023
Abstract
We present a study of the mid-IR (MIR) emission of quiescent galaxies (QGs) beyond the local universe. Using deep JWST imaging in the SMACS-0723 cluster field we identify a mass-limited (M* > 109 M⊙) sample of intermediate redshift QGs (0.2 < z < 0.7) and perform modelling of their rest-frame UV to MIR photometry. We find that QGs exhibit a range of MIR spectra that are composed of a stellar continuum and a dust component that is 1–2 orders of magnitude fainter than that of star-forming galaxies. The observed scatter in the MIR spectra, especially at λrest > 5 μm, can be attributed to different dust continuum levels and/or the presence of polycyclic aromatic hydrocarbon (PAH) features. The latter would indicate enhanced 11.3 and 12.7 μm PAH strengths with respect to those at 6.2 and 7.7 μm, consistent with the observed spectra of local ellipticals and indicative of soft radiation fields. Finally, we augment the average UV to MIR spectrum of the population with cold dust and gas emission in the far-IR/millimetre, and construct a panchromatic UV to radio SED that can serve as a template for the future exploration of the interstellar medium of z > 0 QGs with ALMA and JWST.
Key words: galaxies: ISM / galaxies: photometry / dust / extinction
Publicly available at https://georgiosmagdis.github.io/software/
© The Authors 2023
 Open Access article, published by EDP Sciences, under the terms of the Creative Commons Attribution License (https://creativecommons.org/licenses/by/4.0), which permits unrestricted use, distribution, and reproduction in any medium, provided the original work is properly cited.
This article is published in open access under the Subscribe to Open model. This email address is being protected from spambots. You need JavaScript enabled to view it. to support open access publication.
1. Introduction
Over the past decades a population of massive galaxies with suppressed star formation (i.e., quiescent galaxies, QGs), has been robustly established both photometrically (Daddi et al. 2005; Toft et al. 2005; Kriek et al. 2006) and spectroscopically (Toft et al. 2012; Whitaker et al. 2013; D’Eugenio et al. 2020; Valentino et al. 2020) up to z ∼ 4 − 5. The recent launch of the James Webb Space Telescope (JWST) has allowed QGs to be spectroscopically confirmed up to z = 4.68 (Carnall et al. 2023), and has provided the opportunity to search for possible z ∼ 5 candidates (Valentino et al. 2023). QGs are characterised by low levels of star formation compared to their main sequence star-forming counterparts (Daddi et al. 2007; Schreiber et al. 2015) and their red colour, as a consequence of their old and evolved stellar populations.
A large volume of studies characterising QGs across cosmic time has focused on their stellar properties (e.g., Williams et al. 2009; Tomczak et al. 2014), using optical/near-infrared (NIR) data. In addition, their far-infrared (FIR) emission, tracing cold dust and gas, has been been explored in the local and, more recently, in the distant universe (e.g., Young et al. 2011; Magdis et al. 2021; Blánquez-Sesé et al. 2023), primarily with the Atacama Large Millimeter Array (ALMA).
However, their mid-infrared (MIR) regime has only been examined in the local universe (e.g., Bregman et al. 2006; Kaneda et al. 2008; Rampazzo et al. 2013), since the limited sensitivity of MIR observations carried out until recently with the Spitzer Space Telescope, for example, has predominantly restricted the study of MIR emission to star-forming galaxies (SFGs) and active galactic nuclei (AGNs). Most studies focusing on z > 0 QGs intentionally select against galaxies with a detection in the MIR (e.g., MIPS 24 μm), which is commonly associated with emission of warm dust heated by ongoing star formation or AGN activity.
The situation has been radically transformed with JWST, which can reach sensitivities to comfortably extend the study of the MIR spectra of QGs to higher redshifts, through the detection of dust continuum emission and, if present, of polycyclic aromatic hydrocarbons (PAHs), which can be used as a powerful tracer of star formation and AGN activity (e.g., Förster Schreiber et al. 2004; Pope et al. 2008; Kirkpatrick et al. 2015; Xie & Ho 2019), of the ISM conditions (e.g., Galliano et al. 2008; Rigopoulou et al. 2021), and even of the molecular gas reservoir (Cortzen et al. 2019) of a galaxy.
For this work we utilised deep imaging data obtained with the Near Infrared Camera (NIRCam; Rieke et al. 2005) and the Mid-Infrared Instrument (MIRI; Rieke et al. 2015; Bouchet et al. 2015) as part of the JWST Early Release Observations (Pontoppidan et al. 2022) towards the SMACS J0723.3−7327 (SMACS-0723) cluster field. Using the same set of observations, Langeroodi & Hjorth (2023) presented a detailed study of the MIR colours of low- to intermediate-redshift galaxies and AGNs, and showed how PAH features can be used to distinguish between SFGs, QGs, and AGNs in NIRCam and MIRI mid-infrared colour–colour diagrams. Here, we focus on a sample of intermediate redshift QGs to explore their MIR spectra – a feat that until recently was unattainable beyond the local universe – and highlight the feasibility of future observations towards this direction.
The layout of the paper is as follows. In Sect. 2 we describe the data utilized and the methodology followed for the construction of a multi-band photometric catalogue in the JWST SMACS-0723 field. In Sect. 3 we present the sample selection of QGs and the derivation of their MIR properties through the modelling of their UV to MIR broad-band photometry. In Sect. 4 we present the results, explore the possibility of the presence of PAHs in the spectra of intermediate redshift QGs, and construct a panchromatic UV to radio SED template for the population. Finally, in Sect. 5 we provide a summary of our main findings. Throughout this work we assume a standard ΛCDM cosmology with ΩM = 0.3, ΩΛ = 0.7, and H0 = 70 km s−1 Mpc−1. We adopt the Chabrier initial mass function (IMF) (Chabrier 2003) and the AB magnitude system (Oke 1974).
2. Data
In this section we describe the data used for this work consisting of HST and JWST observations of the SMACS-0723 cluster field, centred around a massive lensing cluster located at zcluster = 0.387. All the data considered here are publicly available, and were retrieved from the Mikulski Archive for Space Telescopes (MAST).
2.1. HST archival data
The HST data were obtained from the treasury programme Reionization Lensing Cluster Survey (RELICS; Coe et al. 2019). Observations were carried out in the F435W, F606W, and F814W filters from the Advanced Camera for Surveys (ACS) and in the F105W, F125W, F140W, and F160W filters from the Wide Field Camera 3 (WFC3), covering a wavelength range from 0.435 μm to 1.6 μm.
2.2. JWST data
SMACS-0723 is one of the first target fields observed by JWST in the Early Release Observations (ERO) programme (ID 2736; Pontoppidan et al. 2022) after the telescope commissioning. The photometric observations consist of data from the Near Infrared Camera (NIRCam; Rieke et al. 2005), the Near Infrared Imager and Slitless Spectrograph (NIRISS; Doyon et al. 2012), and the Mid-Infrared Instrument (MIRI; Rieke et al. 2015; Bouchet et al. 2015). The observations covering the wavelength range from 0.9−18 μm were carried out with the F090W, F150W, F200W, F277W, F356W, and F444W NIRCam filters; the F115WN and F200WN NIRISS filters; and the F770W, F1000W, F1500W, and F1800W MIRI filters, with a total observing time of 6.2 h in the MIRI bands. The NIRCam pointings, consisting of two adjacent fields of view, cover an area of 2.2′ × 2.2′ each; the MIRI coverage is embedded within the fields, with an area of 112.5″ × 73.5″. Since the MIRI photometric filters are the essential component of this work, we only consider the data within the MIRI coverage for the rest of the analysis.
2.3. Catalogue construction
To reduce the NIRCam and MIRI data in the SMACS0723 field, we retrieved the level 2 products from MAST, and processed them with the grizli pipeline (Brammer 2023). A similar data reduction methodology is presented in Kokorev et al. (2023) and Valentino et al. (2023), among others, and will be fully described in Brammer et al. (in prep.). We gave particular care to the photometric zero-point corrections relative to the jwst_1041.pmap. We additionally included corrections and masking to reduce the effects of stray light and cosmic rays. Our mosaics included the updated sky flats for all NIRCam filters. For the MIRI data we additionally constructed our own flat fields by utilising all available exposures in the field. Finally, we included all the available optical and near-infrared data in the Complete Hubble Archive for Galaxy Evolution (CHArGE; Kokorev et al. 2022). We aligned the images to Gaia DR3 (Gaia Collaboration 2021), co-added, and finally drizzled them (Fruchter & Hook 2002) to a 0.02″ pixel scale for the short wavelength (SW) NIRCam bands, and to 0.04″ for all the remaining JWST/NIRCam, MIRI, and HST filters.
We then constructed the photometric catalogue using lmttSourceXtractor++ (Bertin et al. 2020; Kümmel et al. 2020). lmttSourceXtractor++ is a flexible model-fitting engine that does source detection and simultaneous model-fitting on a number of images of different photometric bands. We detected on a weighted mean of the long wavelength bands and fit Sérsic models to all sources in all HST and JWST bands. The fitted models in each band were convolved with the corresponding PSF model. For the JWST bands, PSF models were obtained with WebbPSF (Perrin et al. 2014). This model-fitting approach offers the advantage of consistently measuring photometry in images of largely different resolutions, especially when combining ACS, NIRCam, and MIRI, ranging from 0.4 μm to 18 μm.
To determine the redshifts and the rest-frame colours of the detected sources we used lmttEaZY-py (Brammer et al. 2008). We first searched for spectroscopic reshifts (zspec) by cross-matching our galaxies with the various spectroscopic catalogues (Caminha et al. 2022; Noirot et al. 2023), and assigned zspec to 31 out of 1725 galaxies. For the remaining sources we derived their photometric redshifts (zphot) by running lmttEaZY-py with its default parameters, setting the redshift range to 0 < z < 18 with a zstep = 0.01 × (1 + z). We utilised the corr_sfhz_13 subset of models within lmttEaZY-py, which make use of redshift-dependent star formation histories and dust attenuation. To assess the quality of the derived photometric redshifts we repeated the lmttEaZY-py run for the 31 sources that have zspec, this time leaving the redshift as a free parameter. We found an excellent agreement between the derived zphot and the zspec, without a systematic offset and a scatter of σ = 0.02.
To derive the physical properties of the galaxies, and in particular their stellar mass (M*), we used lmttFAST (Kriek et al. 2009). We adopted the zphot estimates from lmttEaZY-py and fitted the available photometry for each source up to 4.4 μm with the stellar population models of Bruzual & Charlot (2003), an exponentially declining star formation history, fixed solar metallicity, and a Calzetti et al. (2000) dust attenuation law. The derived stellar masses were correlated with those obtained by lmttEaZY-py with a median offset of 0.25 dex.
In Table 1 we summarise the achieved 5σ depths in the SMACS-0723 cluster field in the MIRI bands. In order to compute the mosaic sensitivities, we calculated the standard deviation of the measured flux densities in 3000 empty circular apertures randomly placed in the mosaic. Our analysis yields 5σ magnitude depths of 26.9 and 26.2 at 7.7 μm and 18 μm respectively, one to two orders of magnitude deeper compared to some of the deepest pre-JWST MIR surveys (e.g., 23.1 and 19.6 at 8 μm and 24 μm with Spitzer in the COSMOS field; Weaver et al. 2022; Jin et al. 2018). This along with the additional MIRI bands that sample the 8−24 μm wavelength range provide a unique opportunity to explore the MIR emission of QGs beyond the local Universe.
List of magnitude depths in the MIR regime obtained by JWST observations in the SMACS 0723 field.
3. Analysis
To select QGs from the parent sample we use the UVJ criterion (e.g., Williams et al. 2009) after inferring the rest-frame colour from the best fit lmttEaZY-py SED models. For our purposes, we adopted the slightly modified colour selection introduced by Schreiber et al. (2015):
 (1)
(1)
This selection results in a sample of 240 QGs (see Fig. 1) in the 0.12 < z < 2.35 and 7.0< log(M*/M⊙) < 11.4 range (Fig. 2).
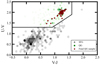 |
Fig. 1. UVJ diagram. Rest-frame U − V, V − J colour–colour diagram of the sources in the SMACS-0723 catalogue. The black solid lines represent the standard selection box defined in Schreiber et al. (2015). The green and grey hexagons (linearly scaled from 0 to 7) show the density distribution of the full sample of QGs and SFGs, respectively, while the red circles denote the position of final sample of QGs considered in this study. |
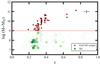 |
Fig. 2. Sample selection. Distribution of sources in the redshift–stellar mass plane. The grey and green hexagons show the density distribution of SFGs and QGs, respectively. The horizontal line indicates the mass cut-off limit of log(M*/M⊙) > 9 introduced in our selection. The red circles show the position of the final QG sample, composed of 50 galaxies. The representative errorbars for our catalogue are shown in the top right corner. |
In an attempt to eliminate selection biases due to the different depths of available MIRI bands, we then introduced a stellar mass cut of M* > 109 M⊙, above which ∼95% of the QGs are detected in both the F770W and F1000W bands at 5σ significance (with the detection rate dropping to 75% and 60% in F1500W and F1800W, respectively). The mass selection, along with a visual inspection of the cutouts to discard artefacts and sources with poorly constrained photometry, yields a sample of 63 candidate QGs. Finally, to identify possible dusty star-forming galaxies (DSFGs) that are misclassified as QGs, we fitted the full available photometry of each source (0.43−18 μm) with lmttStardust (Kokorev et al. 2021). This photometric fitting code can simultaneously and independently fit a stellar component (Brammer et al. 2008), an AGN component (Mullaney et al. 2011), and a dust component (Draine & Li 2007; Draine et al. 2013) to the data in order to reproduce the observed SED of a galaxy and obtain its fundamental optical and IR properties (e.g., M*, LIR, Mdust). We found that eight sources in our QGs sample have infrared luminosities (LIR) consistent with that of DSFGs (LIR > 1012 L⊙; Lonsdale et al. (2006), Casey et al. (2014)) and were subsequently removed from the sample. As shown in Fig. 2, our final sample consists of 50 QGs with log(M*/M⊙) > 9, of which 47 are at z ≈ 0.35 (0.2 < z < 0.4; low-z sample) and 3 are at z = 0.65, 0.69, 0.75 (intermediate-z sample). We note that a significant fraction of QGs in our sample with 0.2 < zphot < 0.3 (i.e., sources with zphot < zcluster) are likely to be cluster galaxies for which lmttEaZY-py slightly underestimates their redshift. The majority of these sources have zphot consistent with zcluster within 1–2σ of the zphot uncertainty (⟨σ⟩≈0.06). Placing all low-z QGs at zcluster = 0.387 does not change the main results presented below.
In order to model the MIR emission of the QGs in our final sample we re-ran lmttStardust with some modifications. First, in addition to the Draine & Li (2007) dust models (DL07) utilised by lmttStardust, we also included the dust emission (continuum + PAHs) of the empirical template (P-QG) presented in Paspaliaris et al. (2023) that was constructed to reproduce the average IR emission of 229 local ellipticals. This step ensured that we would be able to capture any weak dust continuum and/or PAH emission that might be present in the spectrum of QGs and that cannot be recovered by the DL07 dust models. Finally, we approximated the emission of the stellar templates at λrest > 2.2 μm as a black body (BB) with a temperature T = 5000 K. Examples of the derived best fit SEDs for low-z and intermediate-z QGs are presented in Fig. 3.
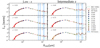 |
Fig. 3. SED fitting of QGs. Rest-frame SEDs of three low-z QGs (left panels) and the three intermediate-z QGs (right panels) from our sample. The photometric data are colour-coded according to the broad-band filters used, while the solid lines (and the grey shaded regions) indicate the best fit models (and corresponding uncertainties). For galaxies where the MIR emission is best fit with the template of Paspaliaris et al. (2023) (P-QG), the best fit model is depicted with a red line. Instead, the brown solid line indicates that the MIR emission of the galaxy is best fit with a DL07 model. The green dashed lines depict the extrapolated stellar continuum emission modelled by a BB with T = 5000 K normalised at 3.5 μm. The light blue vertical shades indicate the positions and expected widths of the primary PAH features. |
4. Results and discussion
The fitting methodology described above indicates that the rest-frame MIR emission of nine galaxies from our sample can be fully reproduced by stellar emission (BB, T = 5000 K), without any contribution from a dust component. However, for the vast majority of the QGs (41/50) a dust component on top of the stellar emission is necessary to reproduce the observed MIRI fluxes, revealing the presence of non-negligible amounts of dust in the interstellar medium of low- and intermediate-z QGs with M* > 109 M⊙. We note that varying the adopted BB temperature for the stellar continuum within the range of T = 3000–7000 K does not affect our results.
With the SED models of the QGs at hand, we can also compile the average rest-frame UV to mid-IR spectrum of the population in order to get a more global and informative picture of their rest-frame MIR emission and how it compares to that of SFGs and local ellipticals. In Fig. 4 (top) we show the rest-frame SEDs of the QGs normalised to their rest-frame K-band luminosity, as derived from the best fit lmttStardust stellar component. We also include the rest-frame SEDs of all SFGs in our catalogue along with the average best fit model derived by lmttStardust. As expected, there is a clear distinction in their UV-optical colour; there is also a mixture of the two populations in the UV-NIR part of the spectrum due to red DSFGs that mimic the colours of QGs. The dichotomy between the two population becomes more striking in the MIR (λrest > 5 μm) with QGs being up to two orders of magnitude fainter than the SFGs for fixed stellar mass (K-band luminosity). A notable feature in the photometry of each MIRI band is a trend of decreasing flux density with increasing rest-frame wavelength, or equally with decreasing redshift. To investigate the origin of this anti-correlation we mimic our observations by considering a grid of model SEDs within the redshift range of our sample. Each SED was then convolved with the corresponding MIRI transmission curves in order to measure the synthetic photometry in each band, at each redshift. Bringing the synthetic photometry to rest frame and normalising at K-band (similar to the procedure applied to the real data), we recover a similar negative gradient in each MIRI band to that observed in the real data. We thus conclude that the perceived trend is produced by a combination of the redshift range of the QGs in our sample along with the shape of the throughput of the MIRI filters.
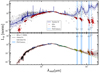 |
Fig. 4. Rest-frame SEDs of SFGs and QGs in the SMACS catalogue. Top: compilation of the rest-frame SEDs of the SFGs in the SMACS catalogue (grey circles) and the QGs in our sample (red circles). All sources are normalised to their K-band luminosity. The arrows depict the 3σ upper limits. In dark blue are shown the average lmttStardust fit to the SFGs sample, with its associated uncertainty. Bottom: rest-frame SEDs of the low-z subsample of QGs, normalised to their K-band luminosity. The photometric data are colour-coded according to the broad-band filters used. The black solid line and the grey shaded area show the best fit model to the global data and its respective uncertainty, while the pale red lines depict the fit to each individual galaxy in the sample. The green dashed line depicts the extrapolated stellar continuum emission modelled by a BB with T = 5000 K normalised at 3.5 μm. In both panels, the light blue vertical stripes indicate the positions and expected widths of the primary PAH features. |
Focusing on the QGs, in Fig. 4 (bottom) we show the compilation of rest-frame SEDs of the low-z QGs along with their individual fits and the best fit model to the running median of the cumulative data. While, on average, we can reproduce the MIR emission by a superposition of a stellar component and the P-QG template, it is clear that the scatter in the rest-frame MIR increases at longer wavelengths that correspond to the declining part of the stellar continuum emission. This indicates not only that dust is present in the ISM of low-z QGs (see also Donevski et al. 2023), but also that the dust emission can vary significantly between sources. The diversity of the MIR emission of QGs is also evident in the SEDs of the three intermediate-z QGs presented in Fig. 3; while the UV-NIR regime of their SEDs is nearly identical, the MIR emission exhibits a range of different dust continuum levels and spectral features. This also reflects the diversity found in the Spitzer/IRS spectra of the nuclei of local ellipticals, which span from prominent PAH features (especially at 11.3 and 12.7 μm) to featureless continuum emission (Panuzzo et al. 2011; Rampazzo et al. 2013).
While the scatter in the MIR emission of low- and intermediate-z QGs likely originates from different dust continuum levels, the fact that the most prominent PAHs features fall in, or close to, the MIRI bands studied here brings forward an alternative and rather intriguing possibility. Specifically, the scatter in the MIR emission of the QGs studied here could be driven by the presence and the variation in the intensity of PAHs in the MIR spectra of QGs. While PAHs in QGs beyond the local universe are not yet directly detected, here we might be getting a first glance. If indeed this is the case, then our QGs seem to have stronger 11.3 and 12.7 μm PAHs with respect to those at 6.2 and 7.7 μm. Interestingly, this would be consistent with the MIR spectra of local elliptical (Bregman et al. 2006; Kaneda et al. 2008; Rampazzo et al. 2013), and in direct contrast to that of SFGs, which exhibit much more prominent 6.2 and 7.7 μm features (e.g., Joblin et al. 2000; Galliano et al. 2008). Moreover, a low 7.7/11.3 PAH ratio has been associated with a predominance of neutral to ionised PAH molecules in the ISM (Bregman et al. 2006; Tielens 2008). The ISM can also be enhanced by a soft radiation field that provides fewer energetic photons to excite the shorter wavelength features, and to diminish the UV field strength and increase the ratio of neutral to ionised PAHs (Bregman et al. 2006; Rigopoulou et al. 2021; Draine et al. 2021). To obtain a rough quantitative estimate of the 7.7/11.3 ratio for our QGs we divide the median flux of the data points located at the selected wavelengths, yielding a ratio of 7.7/11.3 = 0.6−1 (depending on the adopted underlying continuum level). This value corresponds to an ionisation parameter of G0/ne × (Tgas/103 K)1/2 = 950 ± 75 cm3 (Galliano et al. 2008), fully consistent with a very soft radiation field, characteristic of the evolved stellar populations found in QGs (Renzini 1998; Daddi et al. 2000). It is also worth mentioning that other mid-IR lines could also contribute to the broad-band MIRI photometry. For example, a fraction of the F1500W flux density could be attributed to the [NeII] 12.8 μm, which is largely blended with the 12.7 μm PAH feature. However, based on high spectral resolution observations of local ellipticals, the intensity of the 12.7 μm feature is ≥ × 3 larger relative to that of the [NeII] 12.8 μm emission line (Panuzzo et al. 2011). Nevertheless, we note that the presence of, and subsequently the strength of PAHs and other atomic or molecular species can only be confirmed through follow-up MIR spectroscopy.
Finally, we attempt to bridge our work with recent FIR studies that have charecterised the cold dust emission and the ISM mass budget of distant QGs. In particular, we bring together the average UV-to-MIR model SED of the z ≈ 0.35 QGs presented in Fig. 4 (bottom), with the MIR-to-radio SED model introduced by Magdis et al. (2021), which is representative of the FIR emission of z > 0.3 QGs. We first normalise the UV-to-MIR SED to log(M*/M⊙) = 10 and then conjoin the two models at 20 μm by scaling the Magdis et al. (2021) template. This scaling corresponds to a dust mass of log(Mdust/M⊙) = 5.75 yielding a dust fraction of fdust ≈ 0.005% and a gas fraction of fgas ≈ 0.5%, assuming a dust-to-gas mass ratio of 100. These values are consistent with the sharp decline in fgas QGs between z = 2 and the present day that are reported in the literature (e.g., Gobat et al. 2018; Magdis et al. 2021; Blánquez-Sesé et al. 2023). Additionally, the QG model SED can be used to derive an independent estimate of the ionisation parameter. To this end, we first scale the SED model to the mean stellar mass of the QG sample (i.e., log(M*/M⊙) = 10.5). We then employ the photodissociation region model described in Kaufman et al. (1999) and Pound & Wolfire (2008), and convert the total infrared luminosity of the model (LIR = 1.4 × 10⁸ L⊙) to a UV radiation field (G0 = 12.5). Finally, assuming a range of gas temperatures (Tgas ≈ 50 − 300 K) and electron densities (ne ≈ 102 − 105 cm−3) appropriate for the G0 value of the template, we infer an ionisation parameter of G0/ne × (Tgas/103 K)1/2 ≈ 1 − 1300 cm3 that nicely brackets our estimate based on a 7.7/11.3 PAH interband ratio. The panchromatic UV-to-radio template SED is presented in Fig. 5 and is made publicly available1 to facilitate future studies of QGs beyond the local universe.
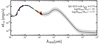 |
Fig. 5. Panchromatic template SED of z > 0 QGs. Augmentation of the UV-to-MIR spectrum presented in this work with the FIR SED model of QGs presented in Magdis et al. (2021). The UV-to-MIR spectrum has been normalised to log(M*/M⊙) = 10 and the FIR model has been scaled to fit the MIR data resulting in a dust mass of log(Mdust/M⊙) = 5.75 and a gas fraction of ≈0.5%. The full SED is shown as a solid black line and its associated uncertainty as a grey shaded region. |
5. Conclusions
In this work we presented an initial study of the MIR emission of QGs beyond the local universe, taking advantage of deep NIRCam and MIRI JWST observations of the SMACS-0723 cluster field. We report the detection of dust emission in the MIR spectra (λrest = 4 − 14 μm) of z = 0.2 − 0.7 QGs which is 1–2 order magnitudes fainter than that of SFGs. For fixed stellar mass the rest-frame UV-to-NIR spectrum of the QGs appears to be rather homogeneous, while the MIR emission of the population is characterised by a larger degree of diversification, especially at λrest > 5 μm. This scatter can be attributed to different dust continuum levels and/or the presence of PAHs in the spectra of QGs. The latter would indicate enhanced 11.3 and 12.7 μm PAH features compared to those at 6.2 and 7.7 μm, consistent with the observed MIR spectra of local ellipticals and the soft radiation fields that are expected in the ISM of passive galaxies. Finally, we constructed and have made publicly available a panchromatic (UV-to-radio) SED that could serve as a template for future studies of distant QGs.
This study serves as a first step towards a better understanding of the MIR properties of QGs beyond the local universe and paves the way for follow-up spectroscopic observations that are necessary for the detailed characterisation of their ISM.
Publicly available at https://georgiosmagdis.github.io/software/
Acknowledgments
GEM, SG and DBS acknowledge financial support from the Villum Young Investigator grant 37440 and 13160 and the Cosmic Dawn Center (DAWN), funded by the Danish National Research Foundation under grant No. 140 PD. CGG acknowledges support from CNES. DR acknowledges support from STFC through grant ST/W000903/1. JH and DL were supported by a VILLUM FONDEN Investigator grant (project number 16599). SJ is supported by the European Union’s Horizon Europe research and innovation program under the Marie Skłodowska-Curie grant agreement No. 101060888.
References
- Bertin, E., Schefer, M., Apostolakos, N., et al. 2020, in Astronomical Data Analysis Software and Systems XXIX, eds. R. Pizzo, E. R. Deul, J. D. Mol, J. de Plaa, & H. Verkouter, 527, 461 [NASA ADS] [Google Scholar]
- Blánquez-Sesé, D., Gómez-Guijarro, C., Magdis, G. E., et al. 2023, A&A, 674, A166 [NASA ADS] [CrossRef] [EDP Sciences] [Google Scholar]
- Bouchet, P., García-Marín, M., Lagage, P. O., et al. 2015, PASP, 127, 612 [CrossRef] [Google Scholar]
- Brammer, G. 2023, https://doi.org/10.5281/zenodo.7767790 [Google Scholar]
- Brammer, G. B., van Dokkum, P. G., & Coppi, P. 2008, ApJ, 686, 1503 [Google Scholar]
- Bregman, J. D., Bregman, J. N., & Temi, P. 2006, arXiv e-prints [arXiv:astroph/0604369] [Google Scholar]
- Bruzual, G., & Charlot, S. 2003, MNRAS, 344, 1000 [NASA ADS] [CrossRef] [Google Scholar]
- Calzetti, D., Armus, L., Bohlin, R. C., et al. 2000, ApJ, 533, 682 [NASA ADS] [CrossRef] [Google Scholar]
- Caminha, G. B., Suyu, S. H., Mercurio, A., et al. 2022, A&A, 666, L9 [NASA ADS] [CrossRef] [EDP Sciences] [Google Scholar]
- Carnall, A. C., McLeod, D. J., McLure, R. J., et al. 2023, MNRAS, 520, 3974 [NASA ADS] [CrossRef] [Google Scholar]
- Casey, C. M., Narayanan, D., & Cooray, A. 2014, Phys. Rep., 541, 45 [Google Scholar]
- Chabrier, G. 2003, PASP, 115, 763 [Google Scholar]
- Coe, D., Salmon, B., Bradač, M., et al. 2019, ApJ, 884, 85 [Google Scholar]
- Cortzen, I., Garrett, J., Magdis, G., et al. 2019, MNRAS, 482, 1618 [NASA ADS] [CrossRef] [Google Scholar]
- Daddi, E., Cimatti, A., & Renzini, A. 2000, A&A, 362, L45 [NASA ADS] [Google Scholar]
- Daddi, E., Renzini, A., Pirzkal, N., et al. 2005, ApJ, 626, 680 [NASA ADS] [CrossRef] [Google Scholar]
- Daddi, E., Dickinson, M., Morrison, G., et al. 2007, ApJ, 670, 156 [NASA ADS] [CrossRef] [Google Scholar]
- D’Eugenio, C., Daddi, E., Gobat, R., et al. 2020, ApJ, 892, L2 [Google Scholar]
- Donevski, D., Damjanov, I., Nanni, A., et al. 2023, A&A, 678, A35 [NASA ADS] [CrossRef] [EDP Sciences] [Google Scholar]
- Doyon, R., Hutchings, J. B., Beaulieu, M., et al. 2012, in Space Telescopes and Instrumentation 2012: Optical, Infrared, and Millimeter Wave, eds. M. C. Clampin, G. G. Fazio, H. A. MacEwen, J. Oschmann, & M. Jacobus, SPIE Conf. Ser., 8442, 84422R [NASA ADS] [CrossRef] [Google Scholar]
- Draine, B. T., & Li, A. 2007, ApJ, 657, 810 [CrossRef] [Google Scholar]
- Draine, B. T., Aniano, G., Krause, O., et al. 2013, ApJ, 780, 172 [NASA ADS] [CrossRef] [Google Scholar]
- Draine, B. T., Li, A., Hensley, B. S., et al. 2021, ApJ, 917, 3 [CrossRef] [Google Scholar]
- Förster Schreiber, N. M., Roussel, H., Sauvage, M., & Charmandaris, V. 2004, A&A, 419, 501 [NASA ADS] [CrossRef] [EDP Sciences] [Google Scholar]
- Fruchter, A. S., & Hook, R. N. 2002, PASP, 114, 144 [NASA ADS] [CrossRef] [Google Scholar]
- Gaia Collaboration (Brown, A. G. A., et al.) 2021, A&A, 649, A1 [NASA ADS] [CrossRef] [EDP Sciences] [Google Scholar]
- Galliano, F., Madden, S. C., Tielens, A. G. G. M., Peeters, E., & Jones, A. P. 2008, ApJ, 679, 310 [Google Scholar]
- Gobat, R., Daddi, E., Magdis, G., et al. 2018, Nat. Astron., 2, 239 [NASA ADS] [CrossRef] [Google Scholar]
- Jin, S., Daddi, E., Liu, D., et al. 2018, ApJ, 864, 56 [Google Scholar]
- Joblin, C., Abergel, A., Bregman, J., et al. 2000, in ISO Beyond the Peaks: The 2nd ISO Workshop on Analytical Spectroscopy, eds. A. Salama, M. F. Kessler, & K. Leech, ESA Special Publ., 456, 49 [NASA ADS] [Google Scholar]
- Kaneda, H., Onaka, T., Sakon, I., et al. 2008, ApJ, 684, 270 [NASA ADS] [CrossRef] [Google Scholar]
- Kaufman, M. J., Wolfire, M. G., Hollenbach, D. J., & Luhman, M. L. 1999, ApJ, 527, 795 [Google Scholar]
- Kirkpatrick, A., Pope, A., Sajina, A., et al. 2015, ApJ, 814, 9 [NASA ADS] [CrossRef] [Google Scholar]
- Kokorev, V. I., Magdis, G. E., Davidzon, I., et al. 2021, ApJ, 921, 40 [NASA ADS] [CrossRef] [Google Scholar]
- Kokorev, V., Brammer, G., Fujimoto, S., et al. 2022, ApJS, 263, 38 [NASA ADS] [CrossRef] [Google Scholar]
- Kokorev, V., Jin, S., Magdis, G. E., et al. 2023, ApJ, 945, L25 [NASA ADS] [CrossRef] [Google Scholar]
- Kriek, M., van Dokkum, P. G., Franx, M., et al. 2006, ApJ, 649, L71 [NASA ADS] [CrossRef] [Google Scholar]
- Kriek, M., van Dokkum, P. G., Labbé, I., et al. 2009, ApJ, 700, 221 [Google Scholar]
- Kümmel, M., Bertin, E., Schefer, M., et al. 2020, in Astronomical Data Analysis Software and Systems XXIX, eds. R. Pizzo, E. R. Deul, J. D. Mol, J. de Plaa, & H. Verkouter, ASP Conf. Ser., 527, 29 [Google Scholar]
- Langeroodi, D., & Hjorth, J. 2023, ApJ, 946, L40 [NASA ADS] [CrossRef] [Google Scholar]
- Lonsdale, C. J., Farrah, D., & Smith, H. E. 2006, in Astrophysics Update 2, ed. J. W. Mason, 285 [CrossRef] [Google Scholar]
- Magdis, G. E., Gobat, R., Valentino, F., et al. 2021, A&A, 647, A33 [NASA ADS] [CrossRef] [EDP Sciences] [Google Scholar]
- Mullaney, J. R., Alexander, D. M., Goulding, A. D., & Hickox, R. C. 2011, MNRAS, 414, 1082 [Google Scholar]
- Noirot, G., Desprez, G., Asada, Y., et al. 2023, MNRAS, 525, 1867 [NASA ADS] [CrossRef] [Google Scholar]
- Oke, J. B. 1974, ApJS, 27, 21 [Google Scholar]
- Panuzzo, P., Rampazzo, R., Bressan, A., et al. 2011, A&A, 528, A10 [NASA ADS] [CrossRef] [EDP Sciences] [Google Scholar]
- Paspaliaris, E. D., Xilouris, E. M., Nersesian, A., et al. 2023, A&A, 669, A11 [NASA ADS] [CrossRef] [EDP Sciences] [Google Scholar]
- Perrin, M. D., Sivaramakrishnan, A., Lajoie, C. P., et al. 2014, in Space Telescopes and Instrumentation 2014: Optical, Infrared, and Millimeter Wave, eds. J. Oschmann, M. Jacobus, M. Clampin, G. G. Fazio, & H. A. MacEwen, SPIE Conf. Ser., 9143, 91433X [CrossRef] [Google Scholar]
- Pontoppidan, K. M., Barrientes, J., Blome, C., et al. 2022, ApJ, 936, L14 [NASA ADS] [CrossRef] [Google Scholar]
- Pope, A., Bussmann, R. S., Dey, A., et al. 2008, ApJ, 689, 127 [Google Scholar]
- Pound, M. W., & Wolfire, M. G. 2008, in Astronomical Data Analysis Software and Systems XVII, eds. R. W. Argyle, P. S. Bunclark, & J. R. Lewis, ASP Conf. Ser., 394, 654 [Google Scholar]
- Rampazzo, R., Panuzzo, P., Vega, O., et al. 2013, MNRAS, 432, 374 [NASA ADS] [CrossRef] [Google Scholar]
- Renzini, A. 1998, arXiv e-prints [arXiv:astroph/9810304] [Google Scholar]
- Rieke, M. J., Kelly, D., & Horner, S. 2005, in Cryogenic Optical Systems and Instruments XI, eds. J. B. Heaney, & L. G. Burriesci, SPIE Conf. Ser., 5904, 1 [NASA ADS] [Google Scholar]
- Rieke, G. H., Wright, G. S., Böker, T., et al. 2015, PASP, 127, 584 [NASA ADS] [CrossRef] [Google Scholar]
- Rigopoulou, D., Barale, M., Clary, D. C., et al. 2021, MNRAS, 504, 5287 [NASA ADS] [CrossRef] [Google Scholar]
- Schreiber, C., Pannella, M., Elbaz, D., et al. 2015, A&A, 575, A74 [NASA ADS] [CrossRef] [EDP Sciences] [Google Scholar]
- Tielens, A. G. G. M. 2008, ARA&A, 46, 289 [NASA ADS] [CrossRef] [Google Scholar]
- Toft, S., van Dokkum, P., Franx, M., et al. 2005, ApJ, 624, L9 [NASA ADS] [CrossRef] [Google Scholar]
- Toft, S., Gallazzi, A., Zirm, A., et al. 2012, ApJ, 754, 3 [NASA ADS] [CrossRef] [Google Scholar]
- Tomczak, A. R., Quadri, R. F., Tran, K.-V. H., et al. 2014, ApJ, 783, 85 [Google Scholar]
- Valentino, F., Tanaka, M., Davidzon, I., et al. 2020, ApJ, 889, 93 [Google Scholar]
- Valentino, F., Brammer, G., Gould, K. M. L., et al. 2023, ApJ, 947, 20 [NASA ADS] [CrossRef] [Google Scholar]
- Weaver, J. R., Kauffmann, O. B., Ilbert, O., et al. 2022, ApJS, 258, 11 [NASA ADS] [CrossRef] [Google Scholar]
- Whitaker, K. E., van Dokkum, P. G., Brammer, G., et al. 2013, ApJ, 770, L39 [NASA ADS] [CrossRef] [Google Scholar]
- Williams, R. J., Quadri, R. F., Franx, M., van Dokkum, P., & Labbé, I. 2009, ApJ, 691, 1879 [NASA ADS] [CrossRef] [Google Scholar]
- Xie, Y., & Ho, L. C. 2019, ApJ, 884, 136 [CrossRef] [Google Scholar]
- Young, L. M., Bureau, M., Davis, T. A., et al. 2011, MNRAS, 414, 940 [NASA ADS] [CrossRef] [Google Scholar]
All Tables
List of magnitude depths in the MIR regime obtained by JWST observations in the SMACS 0723 field.
All Figures
|
Fig. 1. UVJ diagram. Rest-frame U − V, V − J colour–colour diagram of the sources in the SMACS-0723 catalogue. The black solid lines represent the standard selection box defined in Schreiber et al. (2015). The green and grey hexagons (linearly scaled from 0 to 7) show the density distribution of the full sample of QGs and SFGs, respectively, while the red circles denote the position of final sample of QGs considered in this study. |
| In the text | |
|
Fig. 2. Sample selection. Distribution of sources in the redshift–stellar mass plane. The grey and green hexagons show the density distribution of SFGs and QGs, respectively. The horizontal line indicates the mass cut-off limit of log(M*/M⊙) > 9 introduced in our selection. The red circles show the position of the final QG sample, composed of 50 galaxies. The representative errorbars for our catalogue are shown in the top right corner. |
| In the text | |
|
Fig. 3. SED fitting of QGs. Rest-frame SEDs of three low-z QGs (left panels) and the three intermediate-z QGs (right panels) from our sample. The photometric data are colour-coded according to the broad-band filters used, while the solid lines (and the grey shaded regions) indicate the best fit models (and corresponding uncertainties). For galaxies where the MIR emission is best fit with the template of Paspaliaris et al. (2023) (P-QG), the best fit model is depicted with a red line. Instead, the brown solid line indicates that the MIR emission of the galaxy is best fit with a DL07 model. The green dashed lines depict the extrapolated stellar continuum emission modelled by a BB with T = 5000 K normalised at 3.5 μm. The light blue vertical shades indicate the positions and expected widths of the primary PAH features. |
| In the text | |
|
Fig. 4. Rest-frame SEDs of SFGs and QGs in the SMACS catalogue. Top: compilation of the rest-frame SEDs of the SFGs in the SMACS catalogue (grey circles) and the QGs in our sample (red circles). All sources are normalised to their K-band luminosity. The arrows depict the 3σ upper limits. In dark blue are shown the average lmttStardust fit to the SFGs sample, with its associated uncertainty. Bottom: rest-frame SEDs of the low-z subsample of QGs, normalised to their K-band luminosity. The photometric data are colour-coded according to the broad-band filters used. The black solid line and the grey shaded area show the best fit model to the global data and its respective uncertainty, while the pale red lines depict the fit to each individual galaxy in the sample. The green dashed line depicts the extrapolated stellar continuum emission modelled by a BB with T = 5000 K normalised at 3.5 μm. In both panels, the light blue vertical stripes indicate the positions and expected widths of the primary PAH features. |
| In the text | |
|
Fig. 5. Panchromatic template SED of z > 0 QGs. Augmentation of the UV-to-MIR spectrum presented in this work with the FIR SED model of QGs presented in Magdis et al. (2021). The UV-to-MIR spectrum has been normalised to log(M*/M⊙) = 10 and the FIR model has been scaled to fit the MIR data resulting in a dust mass of log(Mdust/M⊙) = 5.75 and a gas fraction of ≈0.5%. The full SED is shown as a solid black line and its associated uncertainty as a grey shaded region. |
| In the text | |
Current usage metrics show cumulative count of Article Views (full-text article views including HTML views, PDF and ePub downloads, according to the available data) and Abstracts Views on Vision4Press platform.
Data correspond to usage on the plateform after 2015. The current usage metrics is available 48-96 hours after online publication and is updated daily on week days.
Initial download of the metrics may take a while.