Fig. 3.

Download original image
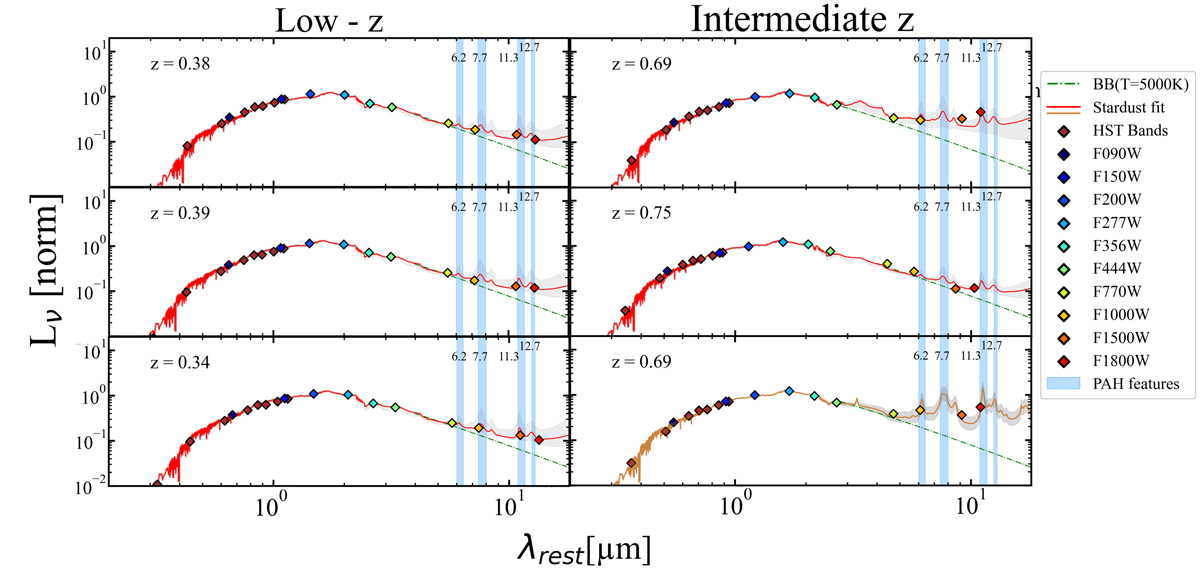
SED fitting of QGs. Rest-frame SEDs of three low-z QGs (left panels) and the three intermediate-z QGs (right panels) from our sample. The photometric data are colour-coded according to the broad-band filters used, while the solid lines (and the grey shaded regions) indicate the best fit models (and corresponding uncertainties). For galaxies where the MIR emission is best fit with the template of Paspaliaris et al. (2023) (P-QG), the best fit model is depicted with a red line. Instead, the brown solid line indicates that the MIR emission of the galaxy is best fit with a DL07 model. The green dashed lines depict the extrapolated stellar continuum emission modelled by a BB with T = 5000 K normalised at 3.5 μm. The light blue vertical shades indicate the positions and expected widths of the primary PAH features.
Current usage metrics show cumulative count of Article Views (full-text article views including HTML views, PDF and ePub downloads, according to the available data) and Abstracts Views on Vision4Press platform.
Data correspond to usage on the plateform after 2015. The current usage metrics is available 48-96 hours after online publication and is updated daily on week days.
Initial download of the metrics may take a while.


