Fig. 1.

Download original image
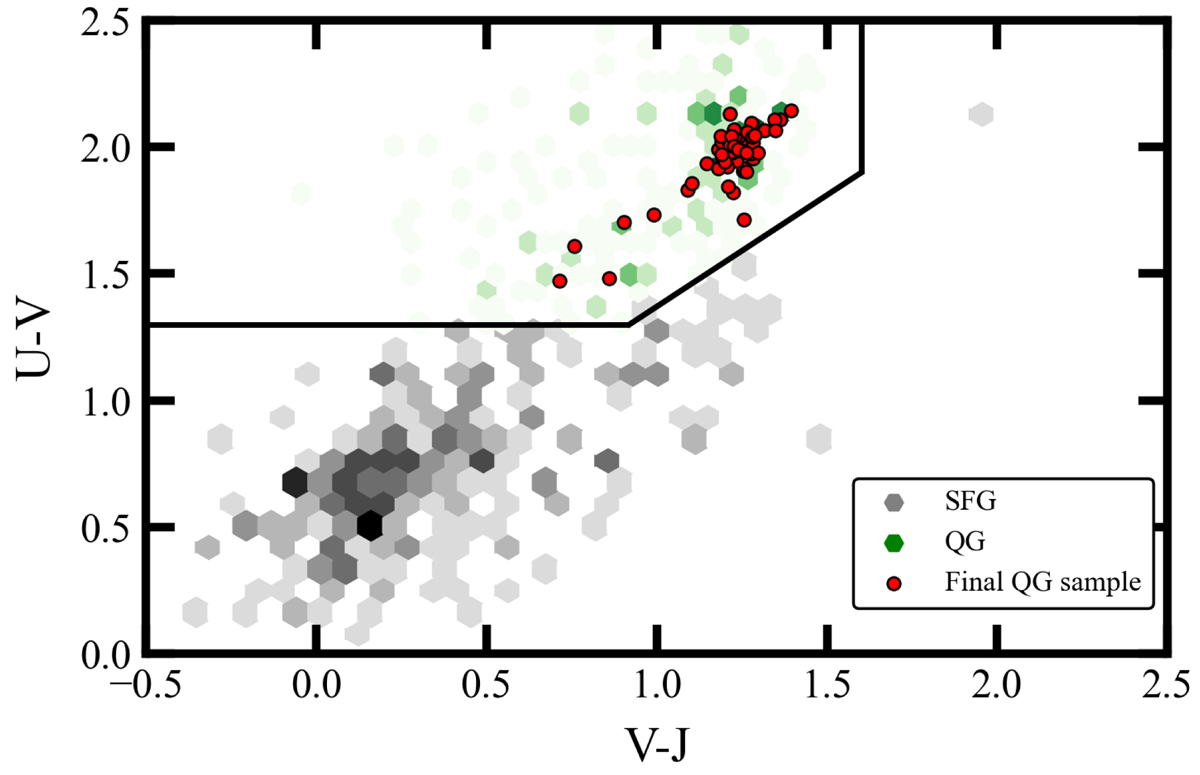
UVJ diagram. Rest-frame U − V, V − J colour–colour diagram of the sources in the SMACS-0723 catalogue. The black solid lines represent the standard selection box defined in Schreiber et al. (2015). The green and grey hexagons (linearly scaled from 0 to 7) show the density distribution of the full sample of QGs and SFGs, respectively, while the red circles denote the position of final sample of QGs considered in this study.
Current usage metrics show cumulative count of Article Views (full-text article views including HTML views, PDF and ePub downloads, according to the available data) and Abstracts Views on Vision4Press platform.
Data correspond to usage on the plateform after 2015. The current usage metrics is available 48-96 hours after online publication and is updated daily on week days.
Initial download of the metrics may take a while.


