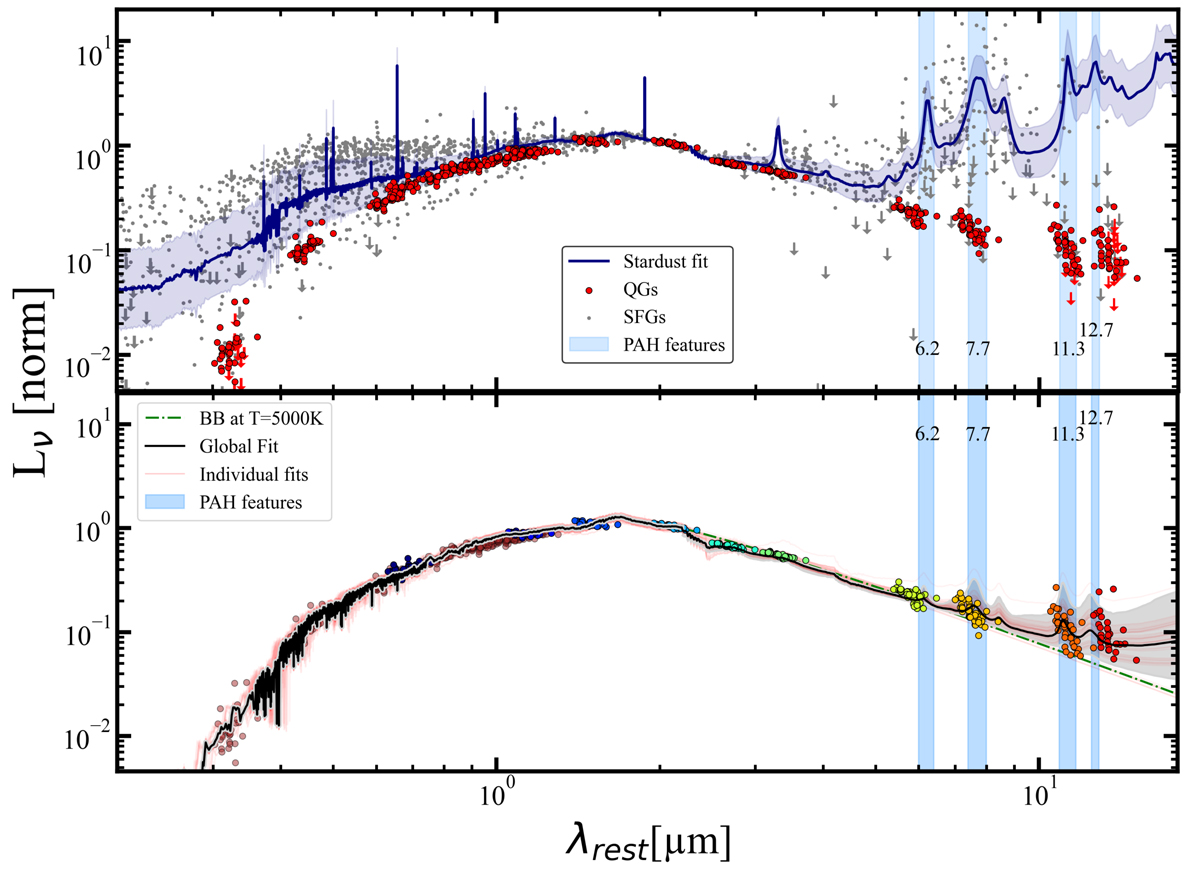
Fig. 4.
Download original image
Rest-frame SEDs of SFGs and QGs in the SMACS catalogue. Top: compilation of the rest-frame SEDs of the SFGs in the SMACS catalogue (grey circles) and the QGs in our sample (red circles). All sources are normalised to their K-band luminosity. The arrows depict the 3σ upper limits. In dark blue are shown the average lmttStardust fit to the SFGs sample, with its associated uncertainty. Bottom: rest-frame SEDs of the low-z subsample of QGs, normalised to their K-band luminosity. The photometric data are colour-coded according to the broad-band filters used. The black solid line and the grey shaded area show the best fit model to the global data and its respective uncertainty, while the pale red lines depict the fit to each individual galaxy in the sample. The green dashed line depicts the extrapolated stellar continuum emission modelled by a BB with T = 5000 K normalised at 3.5 μm. In both panels, the light blue vertical stripes indicate the positions and expected widths of the primary PAH features.
Current usage metrics show cumulative count of Article Views (full-text article views including HTML views, PDF and ePub downloads, according to the available data) and Abstracts Views on Vision4Press platform.
Data correspond to usage on the plateform after 2015. The current usage metrics is available 48-96 hours after online publication and is updated daily on week days.
Initial download of the metrics may take a while.