Fig. 2.

Download original image
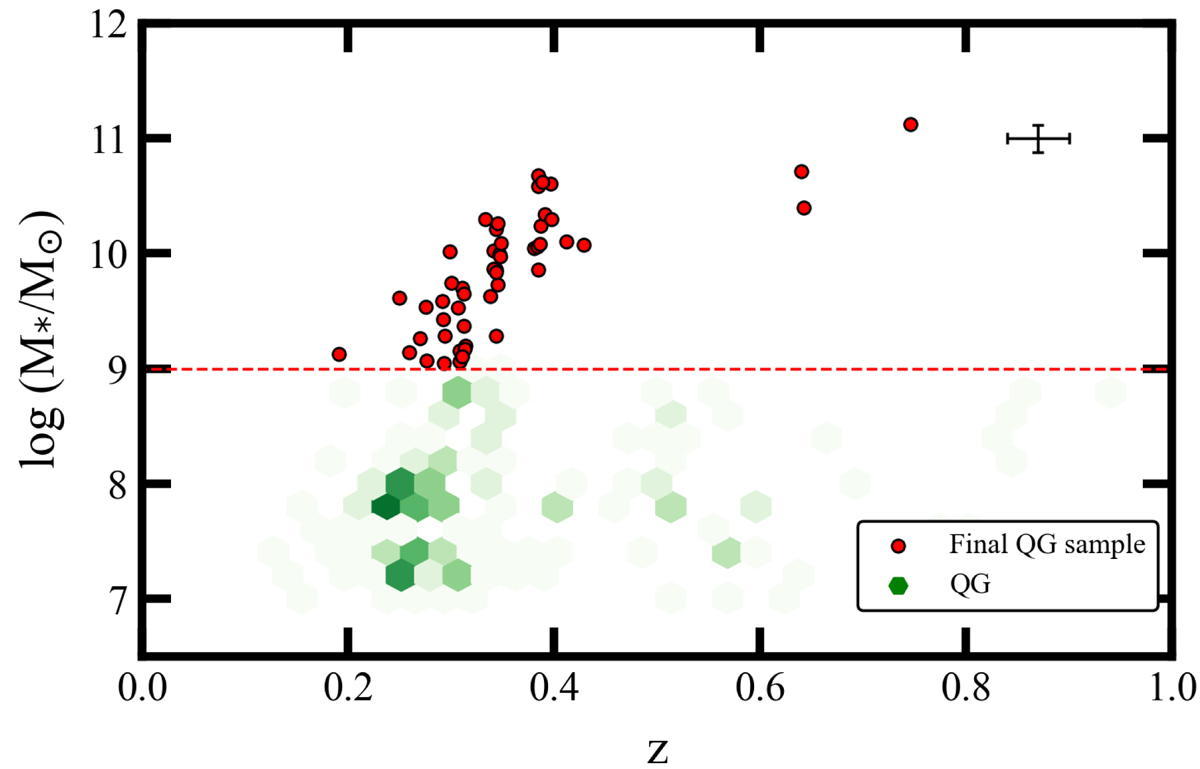
Sample selection. Distribution of sources in the redshift–stellar mass plane. The grey and green hexagons show the density distribution of SFGs and QGs, respectively. The horizontal line indicates the mass cut-off limit of log(M*/M⊙) > 9 introduced in our selection. The red circles show the position of the final QG sample, composed of 50 galaxies. The representative errorbars for our catalogue are shown in the top right corner.
Current usage metrics show cumulative count of Article Views (full-text article views including HTML views, PDF and ePub downloads, according to the available data) and Abstracts Views on Vision4Press platform.
Data correspond to usage on the plateform after 2015. The current usage metrics is available 48-96 hours after online publication and is updated daily on week days.
Initial download of the metrics may take a while.


