| Issue |
A&A
Volume 678, October 2023
|
|
|---|---|---|
| Article Number | A45 | |
| Number of page(s) | 8 | |
| Section | Interstellar and circumstellar matter | |
| DOI | https://doi.org/10.1051/0004-6361/202346822 | |
| Published online | 03 October 2023 | |
The first detection of SiC2 in the interstellar medium
1
Centro de Astrobiología (CAB), INTA-CSIC,
Carretera de Ajalvir km 4, Torrejón de Ardoz,
28850
Madrid, Spain
e-mail: smassalkhi@cab.inta-csic.es
2
Star and Planet Formation Laboratory, Cluster for Pioneering Research,
Riken, 2-1 Hirosawa, Wako,
Saitama
351-0198, Japan
3
European Southern Observatory, Alonso de Córdova,
3107, Vitacura,
Santiago
763-0355, Chile
4
Joint ALMA Observatory,
Alonso de Córdova 3107, Vitacura
763 0355,
Santiago, Chile
5
Observatorio de Yebes (IGN),
Cerro de la Palera s/n,
19141
Guadalajara, Spain
6
Department of Physics, Astronomy and Geosciences, Towson University,
8000 York Road,
Towson, MD
21252, USA
Received:
5
May
2023
Accepted:
17
July
2023
We report the first detection of SiC2 in the interstellar medium. The molecule was identified through six rotational transitions toward G +0.693-0.027, a molecular cloud located in the Galactic center. The detection is based on a line survey carried out with the GBT, the Yebes 40m, and the IRAM 30m telescopes covering a range of frequencies from 12 to 276 GHz. We fit the observed spectra assuming local thermodynamic equilibrium and derive a column density of (1.02 ± 0.04) × 1013 cm−2, which gives a fractional abundance of 7.5 × 10⁻¹¹ with respect to H2, and an excitation temperature of 5.9 ± 0.2 K. We conclude that SiC2 can be formed in the shocked gas by a reaction between the sputtered atomic silicon and C2H2, or it can be released directly from the dust grains due to disruption. We also search for other Si-bearing molecules and detect eight rotational transitions of SiS and four transitions of Si18O. The derived fractional abundances are 3.9 × 10⁻¹⁰ and 2.1 × 10⁻¹¹, respectively. All Si-bearing species toward G+0.693−0.027 show fractional abundances well below what is typically found in late-type evolved stars.
Key words: ISM: clouds / ISM: kinematics and dynamics / ISM: molecules / Galaxy: center
© The Authors 2023
 Open Access article, published by EDP Sciences, under the terms of the Creative Commons Attribution License (https://creativecommons.org/licenses/by/4.0), which permits unrestricted use, distribution, and reproduction in any medium, provided the original work is properly cited.
This article is published in open access under the Subscribe to Open model. Subscribe to A&A to support open access publication.
1 Introduction
In the envelopes around asymptotic giant branch (AGB) stars, gas-phase silicon-bearing molecules, such as SiO, SiS, and SiC2, are formed efficiently under local thermodynamic equilibrium (LTE) close to the stellar photosphere (Tsuji 1973). These molecules are then injected into the expanding envelope where they are likely to deplete from the gas phase and condense onto dust grains due to their highly refractory character. Their abundance will therefore experience a decline due to adsorption onto grains. New Si-bearing molecules may also be formed via grain-surface chemistry (e.g., Cernicharo et al. 2017). Moreover, periodic shock waves caused by stellar pulsations can propagate through the photosphere, releasing Si-bearing molecules and/or atomic Si from the dust grains, further altering the silicon chemistry (e.g., Castro-Carrizo et al. 2001). Photochemistry may also give rise to other Si-bearing molecules in the external shells (e.g., Cernicharo et al. 1989). In the outermost regions of the envelope, the ambient interstellar ultraviolet field will destroy the free gas-phase molecules through photodissociation, whereas the dust may survive and be incorporated into the interstellar medium (ISM).
The situation is different in the ISM, where molecules containing silicon have been extremely elusive. Of the 13 Si-bearing molecules currently detected toward evolved stars, only 3 (SiO, SiS, SiN) are observed in the ISM (Wilson et al. 1971; Morris et al. 1975; Schilke et al. 2003). SiC2 (Thaddeus et al. 1984) is an interesting molecule because it is believed to be a precursor of SiC dust. The presence of SiC grains in carbon evolved stars has been identified through the solid-state emission feature at ~11.3 µm (Hackwell 1972). Massalkhi et al. (2018) carried out observations toward a sample of 25 carbon-rich AGB stars and observed a trend whereby the denser the envelope, the lower the abundance of SiC2. This was interpreted as evidence of efficient adsorption of SiC2 onto dust grains. However, it is remarkable that this molecule has not yet been observed in the interstellar space, especially given that SiC dust is ubiquitous in carbon-rich evolved stars and it is through their stellar outflows that the dust is transported to the ISM.
Here, we report the discovery of SiC2 in the ISM. The detection was made toward the molecular cloud G +0.693−0.027 (hereafter G +0.693) located in the Galactic center (GC) within the Sgr B2 complex. The cloud is known to be chemically rich (Requena-Torres et al. 2006; Zeng et al. 2018; Jiménez-Serra et al. 2020) and its chemistry is believed to be the result of a large-scale cloud-cloud collision (Zeng et al. 2020). The collision drives low-velocity shocks (~20 km s−1), which sputter the molecular content of the grain icy mantles into the gas phase (e.g., Martín et al. 2008; Jiménez-Serra et al. 2008). A series of complex molecules was recently discovered in G + 0.693, such as hydroxylamine, ethanolamine, vinyl amine, ethyl isocyanate, monothioformic acid, and n-propanol (Rivilla et al. 2019, 2020, 2021b, 2022a; Zeng et al. 2021; Rodríguez-Almeida et al. 2021a,b; Jiménez-Serra et al. 2022), as well as other simpler ones, like HNCN and PO+ (Rivilla et al. 2021a, 2022b), making this cloud an excellent target in which to search for new molecular species.
The paper is organized as follows. In Sect. 2, we provide details of the observations. In Sect. 3, we describe the LTE and nonLTE analysis and present the results from these calculations. In Sect. 4, we discuss the main findings of our study, and finally we lay out our conclusions in Sect. 5.
2 Observations
The observational data used in this article are based on a spectral survey carried out with the Green Bank Telescope (GBT) in West Virginia, USA, the Yebes 40m telescope in Guadalajara, Spain, and the IRAM 30m telescope in Pico Veleta, Spain. The equatorial coordinates of the target source, G + 0.693, are α72000 = 17h47m22s and δJ72000 = −28°21′27″. The observations were performed using the position switching mode, with the OFF position located at (−885″, +290″) from G + 0.693. The line intensity of the spectra is given in  as the molecular emission toward G +0.693 is extended over the beam of the telescope. Here, we briefly describe the observations. For more details, we refer to Zeng et al. (2020), Rodríguez-Almeida et al. (2021a) and Rivilla et al. (2022b).
For the GBT observations, the Ku-band receiver was connected to the spectrometer, providing four 200 MHz spectral windows with a spectral resolution of 195 kHz, corresponding to a velocity resolution of 2.2–8.6 km s−1, and covering a frequency range between 12 GHz and 26 GHz.
For the Yebes 40 m observations, we used the Q-band (7 mm) HEMT receiver developed within the Nanocosmos project (Tercero et al. 2021). The receiver was connected to 16 fast Fourier transform spectrometers (FFTSs), providing a channel width of 38 kHz and a bandwidth of 18.5 GHz per polarisation, covering the frequency range between 31.3 GHz and 50.6 GHz. The spectra were smoothed to a resolution of 251 kHz, equivalent to a velocity resolution of 1.5–2.4 km s−1.
The IRAM 30m data used in this work correspond to observations made in the 1 mm, 2 mm, and 3 mm bands and cover several frequency ranges from 71.8–116.7 GHz, 124.8–175.5 GHz, and 199.8–238.3 GHz. The EMIR receivers were connected to the FFTS, providing a spectral resolution of 200 kHz. The spectra were smoothed to velocity resolutions of 1.0–2.6 km s−1, depending on the frequency.
3 Analysis and results
3.1 LTE analysis
To identify and analyze the molecular lines within our spectral survey of G + 0.693, we used the Spectral Line Identification and Modelling (SLIM) package within MADCUBA1 (Martín et al. 2019), which includes the spectroscopic information of the Cologne Database for Molecular Spectroscopy (CDMS, Müller et al. 2005) and the Jet Propulsion Laboratory (JPL, Pickett et al. 1998) catalogues for different molecular species.
SLIM generates synthetic spectra assuming LTE conditions and uses an algorithm (AUTOFIT) that provides the best nonlinear least-squares fit to the data. By performing the fit, we aim to derive the physical parameters of the molecular emission, namely the molecular column density (N), the excitation temperature (Tex), the velocity with respect to the Local Standard of Rest (υLSR), and the line width (full width at half maximum, FWHM). To evaluate whether or not the molecular transitions are contaminated with emission from other species, we consider the predicted LTE emission from more than 120 molecules already identified toward G + 0.693.
We detect SiC2 toward G + 0.693 through six rotational transitions (Table 1). This is the first time this molecule has been reported in the ISM. The observed lines are shown in Fig. 1. The 50,5−40,4 transition of SiC2 at ~115 GHz is slightly blended with NCCNH+, and the 60,6−50,5 transition at ~137 GHz is blended with c-HCOOH. An examination of the number of identified and unidentified lines within a velocity range of ±200 km s−1 around the detected SiC2 transitions reveals that about 15% of the lines observed in those frequency ranges are unidentified.
To carry out the LTE fit, we fixed the value of the FWHM to 20 km s−1 for the AUTOFIT algorithm to converge. This value is typical of molecular emission in the region (e.g., Zeng et al. 2018; Rivilla et al. 2022c) and reproduces the line profiles of SiC2 extremely well. The derived physical parameters together with their corresponding uncertainties are listed in Table 2. For the parameters that were fixed, no uncertainties are associated with the derived values. The best LTE fit is obtained for N = (1.02 ± 0.04) × 1013 cm−2, Tex = 5.9 ± 0.2 K and υLSR = 67.8 ± 0.4 km s−1.
From Fig. 1, it is clear that the LTE fit underestimates the 42,2−32,1 line at ~ 95 GHz and the 62,4−52,3 line at ~ 145 GHz. We note that a higher Tex would not explain this excess of emission because it would overpredict the 60,6−50,5 line at ~137 GHz, which is well fit. As analyzed in Sect. 3.2, this is due to a nonLTE excitation effect of the SiC2 line emission as expected due to the rather low H2 density found in this source.
We also searched for other Si-bearing molecules toward G + 0.693, specifically SiS and SiO. We detect eight rotational transitions of SiS (Table 1), which are shown in Fig. 2. All of the transitions of SiS are unblended. The derived parameters of the best LTE fit are N = (5.3 ± 0.1) × 1013 cm−2, Tex = 8.0 ± 0.1 K, υLSR = 66.8 ± o.2 km s−1 and FWHM = 24.0 ± 0.3 km s−1 (see Table 2). As in the case of SiC2, in Sect. 3.2 we investigate whether the emission from this molecule suffers from nonLTE excitation effects.
The SiO emission line is optically thick in the GC, and therefore we focus on the optically thin isotopolog, Si18O. We detect four rotational transitions of Si18O (Table 1), which are shown in Fig. 3. All of the transitions are clean apart from the J = 4−3 transition at ~ 161 GHz, which is slightly blended with CH3OCHO. We derive best-LTE-fit parameters of N = (2.9 ± 0.1) × 1012 cm−2, Tex = 5.5 ± 0.2 K, υLSR = 67.3 ± 0.4 km s−1, and FWHM = 24.8 ± 1.1 km s−1 (Table 2). From this, we estimate a SiO column density of N = (7.2 ± 0.3) × 1014 cm−2 using the measured isotopic ratio for oxygen in the GC of 16O/18O = 250 (Wilson 1999).
The SiO column density can also be estimated from the 29SiO and 30SiO isotopologs and we therefore analyzed their transitions. Their derived parameters are found in Table 2. Assuming isotopic ratios for silicon 29Si/28Si = 0.095 (Wolff 1980) and 29Si/30Si = 1.5 (Wilson & Rood 1994) which results in 30Si/28Si = 0.063, we obtain SiO column densities of N = 2.6 × 1014 cm−2 using 29SiO, and N = 2.8 × 1014 cm−2 using 30SiO.
These values are lower than the one obtained using Si18O (N = 7.2 × 1014 cm−2; see Table 2), which suggests that the emission of these isotopologs is moderately optically thick. Therefore, we used Si18O to perform the analysis of SiO. No collisional rate coefficients are available for Si18O to carry out the nonLTE analysis of this emission. However, as presented in Sect. 3.2, we used the collisional data of SiO as a good approximation.
The values derived for Tex, υLSR, and FWHM for all these species are in agreement with those obtained previously for other molecular species toward this cloud (Tex ~ 5–20 K, υLSR ~ 68 km s−1, and line widths ~20 km s−1, e.g., Requena-Torres et al. 2006; Zeng et al. 2018; Rivilla et al. 2020; Rodríguez-Almeida et al. 2021a). Additionally, we searched for the emission of SiC, Si2C, and SiN; however, we do not detect these molecules toward G + 0.693. The derived upper limits on the column densities are presented in Table 3.
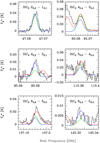 |
Fig. 1 Observed spectra of SiC2 toward G + 0.693 (black histogram). The green lines correspond to the synthetic spectra calculated assuming LTE. The red lines show the synthetic spectra that account for the emission of all the molecules identified toward G + 0.693, including SiC2. The blue lines correspond to the line profiles calculated using Radex. |
Covered rotational transitions of SiC2, SiS, and Si18O.
Derived parameters of SiC2, SiS, 29SiO, 3oSiO, and Si18O.
3.2 NonLTE analysis
As mentioned in Sect. 3.1, the 42,2−32,1 and the 62,4−52,3 lines of SiC2 are underestimated by the LTE model of MADCUBA. The kinetic temperature of the gas toward the G+0.693 cloud is Tkin ~ 70–150 K, and the H2 gas density is a few 104 cm−3 as determined by Zeng et al. (2020) using emission of Class I methanol masers. We note that the maser emission is extended across the whole Sgr B2 molecular cloud (e.g., Liechti & Wilson 1996), which indicates that the physical properties of the gas responsible for the methanol maser emission in G + 0.693 are similar to the ones found across the whole Sgr B2 cloud. In addition, the H2 volume gas densities have also been measured toward other giant molecular clouds (GMCs) in the GC and are also a few 10−4 cm−3, as reported by Guesten & Henkel (1983) and Güsten & Philipp (2004). Given that the H2 volume density of the gas in G + 0.693 is low, the excitation of heavy molecules such as SiC2 is expected to be nonLTE. We therefore used the online nonLTE radiative transfer code Radex (van der Tak et al. 2007), which allows us to check for nonLTE excitation and to constrain the physical properties of the molecular gas.
To run Radex, we set the cosmic microwave background radiation temperature to 2.73 K, the H2 gas density to a typical value of 2 × 104 cm−3 for the GC (Rodríguez-Fernández et al. 2000; Güsten & Philipp 2004; Zeng et al. 2020), and the column density, N, similar to the value provided by MADCUBA, that is N = 1.2 × 1013 cm−2 for SiC2 and N = 5.0 × 1013 cm−2 for SiS. In the case of Si18O, the collisional rate coefficients are not available; nevertheless, we performed the nonLTE calculations using the collisional data of SiO, because they are expected to be similar to those of Si18O. We input N = 2.0 × 1012 cm−2 for Si18O, and find that a higher H2 gas density of 6.0 × 104 cm−3 is needed for this molecule. We then varied Tkin and compared the line intensities observed with those predicted by Radex. The results are overplotted in blue in Fig. 1 for SiC2, Fig. 2 for SiS, and Fig. 3 for Si18O.
From the calculations, we obtain a Tkin = 150 K for SiC2 and Si18O, while we infer a lower Tkin = 90 K for SiS. The derived Tkin are similar to values previously reported for CH3CN (70– 150 K, Zeng et al. 2018, 2020) toward the same source. We also note that the derived Tkin is well below Tkin, which indicates that the molecular emission in G + 0.693 is subthermally excited, as was found for other species in this region owing to the low H2 gas density (Requena-Torres et al. 2006, 2008; Zeng et al. 2018).
Indeed, the 42,2−32,1 and 62,4−52,3 lines of SiC2 are underestimated by the LTE model of MADCUBA; however, they are well explained when the nonLTE excitation is considered (see Fig. 1). This suggests that the transitions substantially deviate from quasi-thermal excitation, where quasi-thermal refers to subthermal excitation where the molecular emission can be well described using a single Tkin (see Goldsmith & Langer 1999 for the definition of quasi-thermal excitation).
On the other hand, for SiS, there is a good agreement between the line intensities calculated by Radex and those predicted by MADCUBA, which points to quasi-thermal excitation similar to that observed in other molecules in this source (see Fig. 2). We notice that for the J = 1−0 transition of SiS, there seems to be a discrepancy between the observed and the predicted line intensities. This discrepancy could be due to population inversion and suprathermal excitation of the SiS J = 1−0 transition. We note that these effects are expected to be found in the low-J transitions of linear molecules, such as SiS and even CO, which are a consequence of collisional propensity rules (Koeppen & Kegel 1980). Indeed, our Radex calculations show that the Tex and the calculated optical depth, τ, obtained for the SiS J = 1−0 line are negative, which suggests that suprathermal excitation may be at play. It is also possible that the mismatch between the observed and predicted SiS J = 1−0 lines is due to the J = 1−0 transition being blended with emission of a molecular species that is not yet identified. We remark that this mismatch cannot be related to a beam effect, because the beam sizes of the GBT and Yebes 40 m telescopes at the corresponding frequencies are comparable.
For Si18O, the line intensities calculated by Radex are similar to those predicted by MADCUBA, which indicates a quasithermal excitation for this molecule (see Fig. 3). We notice that the Si18 O J = 1−0 transition is slightly better reproduced when considering the nonLTE approach, which suggests that nonLTE effects play a role in the excitation of this transition.
Finally, we note that the excitation temperatures calculated in Sect. 3.1 are lower than the gas kinetic temperatures derived here (Tex < Tkin) because the emission is subthermally excited due to the low H2 gas densities in the cloud. However, as was found for other molecules in G + 0.693, the observed lines are well reproduced when assuming LTE and a single Texc, although a better match is achieved for some species such as SiC2 when a nonLTE excitation analysis is carried out.
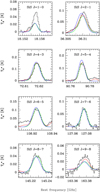 |
Fig. 2 Observed spectra of SiS toward G + 0.693 (black histogram). The green lines correspond to the synthetic spectra calculated assuming LTE. The red lines show the synthetic spectra that account for the emission of all the molecules identified toward G + 0.693. The blue lines correspond to the line profiles calculated using Radex. |
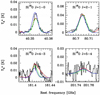 |
Fig. 3 Observed spectra of the isotopolog Si18O toward G + 0.693 (black histogram). The green lines correspond to the synthetic spectra calculated assuming LTE. The red lines show the synthetic spectra that account for the emission of all the molecules identified toward G + 0.693. The blue lines correspond to the line profiles calculated using Radex. |
Derived upper limits of SiC, Si2C, and SiN.
3.3 Fractional abundances relative to H2
We estimate the fractional abundances in G + 0.693, X, that is, the abundance of the molecules relative to H2, assuming a column density of  cm−2 as measured toward G + 0.693 (Martín et al. 2008). The abundances are reported in Table 2. We derive
  , XSiS = 3.9 ×10⁻¹⁰, and
  . We also estimate XSiS = 5.3 × 10⁻⁹ .TheSiO and SiS abundances of a few ~10−9 and ~10−10, respectively, with SiO being more abundant, are consistent with findings of previous observational studies in the GC (Dickinson & Kuiper 1981; Martín-Pintado et al. 1997; Huettemeister et al. 1998; Rodriguez-Fernandez et al. 2006; Amo-Baladrón et al. 2009; Minh et al. 2015), while SiC2 appears to be the least abundant in G +0.693 as compared to the other Si-bearing species. We also calculated the abundance ratios of SiO with respect to SiS and SiC2, and find that SiO/SiS ~14 and SiO/SiC2 ~ 70 toward G +0.693.
For the nondetected silicon-bearing species (SiC, Si2C and SiN), we calculate upper limits to the fractional abundances using the rms noise level of the brightest and least contaminated transition. The upper limits, as well as the transition used as a reference, are presented in Table 3. We obtain XSiC ≤ 5.8 × 10⁻¹² and SiO/SiC ≥ 905,  and SiO/Si2C ≥ 115, and finally XSiN ≤ 9.6 × 10⁻¹¹ and SiO/SiN ≥ 55.
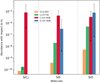 |
Fig. 4 Bar plot comparing the fractional abundance of SiC2, SiS, and SiO relative to H2 in different environments. For G + 0.693, the abundances are obtained from this work. For L1157-B1, the SiO and SiS abundances are taken from Podio et al. (2017), while the upper limit on the SiC2 abundance is derived in this work using the ASAI survey (Lefloch et al. 2018). The abundances of the carbon-rich AGB stars and oxygen-rich AGB stars are from Massalkhi et al. (2018, 2019) and Massalkhi et al. (2020), respectively. For the AGB stars, the height of the bar corresponds to the average fractional abundance derived in the studied samples, while the error bar refers to the wide range of values found. Downward-pointing arrows represent upper limits to the abundance. |
4 Discussion
4.1 Comparison of abundances with those measured in other environments
To evaluate how efficiently the Si-bearing molecules are produced in G +0.693, we compare their abundances in Fig. 4 with those derived in other chemically rich environments, namely the protostellar shock L1157-B1, and carbon- and oxygen-rich AGB stars. The comparison with AGB stars is carried out to elucidate whether interstellar SiC2 is a product of circumstellar envelopes of evolved stars, where dust grains act as a reservoir carrying the molecule all the way into the ISM, until released directly into the gas phase through sputtering.
The derived fractional abundances in G +0.693 are plotted in orange. In green, we show the SiO and SiS abundances toward the protostellar shock L1157-B1 calculated by Podio et al. (2017). We also searched for SiC2 in L1157-B1 using the spectral line survey of ASAI (Astrochemical Surveys at IRAM; Lefloch et al. 2018); however, we find no detection of SiC2 emission toward this source down to an rms noise level of 3 mK; we therefore derived an upper limit on the SiC2 abundance of <1.8 × 10⁻¹⁰ assuming  cm−2 (Podio et al. 2017), which is also plotted in Fig. 4 in green. We show the average fractional abundances of SiC2, SiS, and SiO derived for 25 C-rich AGB stars studied by Massalkhi et al. (2018, 2019) in red and the average fractional abundances of SiS and SiO derived in 30 O-rich envelopes by Massalkhi et al. (2020) in blue.
From Fig. 4, we find that the fractional abundances of the Si-bearing molecules in G +0.693 are the lowest compared to other environments. This may indicate that their formation is less efficient toward this cloud, while the highest abundances are found toward evolved stars. This is not surprising as these molecules form in the densest (~1013−1015 cm−3) and hottest (~2000–3000 K) parts of the inner envelopes of AGB stars under LTE conditions, and together are thought to lock up a significant fraction of the silicon elemental abundance (Massalkhi et al. 2018, 2019).
In Fig. 5, we plot the fractional abundance of SiO against that of SiC2 (left panel) and the fractional abundance of SiO against that of SiS (right panel), in the different environments. We find that for G +0.693 and L1157-B1, SiO is more abundant than SiC2 as indicated by the fact that the sources lie in the SiO/SiC2 > 1 region. This behavior is different than what is found for the envelopes of carbon evolved stars where, for most of the studied sample, SiC2 tends to be more abundant than SiO. This suggests that in the ISM, SiO is likely to lock up silicon more efficiently than SiC2. This is probably due to the fact that SiO is more refractory than SiC2 (Lodders 2003), better surviving the journey from the ejected circumstellar material to the ISM. In the right panel of Fig. 5, the comparison between SiO and SiS shows that the data points of G +0.693 and L1157-B1 lie in the SiO/SiS > 1 side. This is somewhat closer to the silicon chemistry of oxygen-rich envelopes, where SiO tends to be predominantly more abundant than SiS, although in the ISM it is clearly of lower order, implying that lower amounts of silicon are carried there.
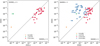 |
Fig. 5 Comparison of abundances between different pairs of molecules. The plots show the derived fractional abundances relative to H2 of SiO vs. SiC2 (left panel), and SiO vs. SiS (right panel). The sources with nondetections are denoted with arrows. The dashed line represents equal abundances of molecules. |
4.2 Exploring the origin of Si-bearing molecules in the ISM
The presence of Si-bearing molecules in interstellar clouds is attributed to violent events that can shatter the dust grains through ion sputtering or grain-grain collisions, effectively releasing the Si-containing species either directly from dust grains to the gas phase, or releasing Si atoms that can then immediately react to form molecules. Silicon monoxide is widely observed in outflows affected by shocks and is considered to be a powerful shock tracer (Martin-Pintado et al. 1992). Because of this link, its formation is believed to be due to shocks that release SiO molecules from the grains directly into the gas phase (e.g., Jiménez-Serra et al. 2005) or by releasing Si atoms that react through Si + O2 → SiO + O and Si + OH → SiO + H (Langer & Glassgold 1990; Schilke et al. 1997). Observational studies in circumstellar envelopes of AGB stars found an SiO abundance depletion with increasing envelope density, suggesting efficient incorporation of this molecule onto dust grains (e.g., Schöier et al. 2006; Massalkhi et al. 2018, 2020). It therefore appears that SiO is a product of the release from dust grains in shocked regions.
On the other hand, SiS emission has been observed less in shocked regions and its origin in the ISM is not adequately understood. SiS emission has only been found in a few star-forming regions where outflows are present, such as Sgr B2 and Orion KL, and more recently in L1157-B1, an outflow driven by a low-mass protostar (Dickinson & Kuiper 1981; Ziurys 1988, 1991; Tercero et al. 2011; Podio et al. 2017). In their observational study of Si-bearing molecules in L1157-B1, Podio et al. (2017) found a strong gradient across the shock, where SiS is only detected at the head of the outflow cavity and not detected at the shock impact region, implying that SiS is not directly released from the grains but is instead formed through gas-phase processes after part of the atomic silicon is ejected. It is worth noting that, as opposed to the case for SiO, observational studies of evolved stars did not find a strong trend of decreasing SiS abundance with increasing envelope density, which would be expected if adsorption onto dust grains were important for this molecule (Schöier et al. 2007; Massalkhi et al. 2019, Massalkhi et al. 2020). Rosi et al. (2018) suggested the formation of SiS in the gas phase through the reactions SiH + S and SiH + S2. Zanchet et al. (2018) proposed another path that involves the reaction of atomic silicon with either SO or SO2. More recently, Mancini et al. (2022) investigated the reaction S+(4S) + SiH2(1A1) as a possible route as well.
Contrary to SiO and SiS, detections of SiN are rare, where apart from evolved stars (Turner 1992; Bordiu et al. 2022), its emission has been observed only toward Sgr B2 (M) in absorption (Schilke et al. 2003). Our current understanding of its formation in the ISM is limited. However, if enough Si is available, then one of its formation pathways could be Si + NH → SiN + H (Roveri et al. 1988; Schilke et al. 2003).
Efforts have also been made to detect SiC in the ISM (Schilke et al. 1997; Tercero et al. 2011). We do not detect this molecule toward G +0.693 either. Rocha et al. (2022) performed a theoretical calculation of the rate constants for the gas-phase reaction C2 + Si → SiC + C for temperatures between 2000 and 5000 K, and found that the efficiency of the reaction has a positive dependence on the temperature, where it increases steeply beyond 3000 K. This indicates that SiC is unlikely to form in the ISM through this route. In evolved stars, SiC was detected in IRC + 10216 by Cernicharo et al. (1989) with line profiles indicating that it is formed in the outer layers of the envelope, probably as a photodissociation product of SiC2.
4.3 Formation of SiC2 in the ISM
Previous to this work, SiC2 has not been detected in shocked regions in the ISM. The reason for this could be due to the lines of SiC2 not targeted by observations as often as other Si-bearing species, such as SiO and SiS. Another explanation could simply be that SiC2 is less abundant. The detection of SiC2 toward G +0.693 in this work leads us to speculate about two possible scenarios for the presence of this molecule in the ISM. Being a likely precursor of SiC dust (Massalkhi et al. 2018), SiC2 could be locked onto dust grains and then released directly into the gas phase as a consequence of sputtering caused by shocks in the region. Low- and moderate-velocity shocks can liberate molecules from grains and into the gas phase without destroying the molecular bonds (Requena-Torres et al. 2006). However, we note that solid SiC dust has not yet been detected in the ISM (Chen et al. 2022).
It is worth exploring the efficiency of the formation of interstellar SiC2 in the gas phase under the typical physical conditions of the GC. The UMIST Database for Astrochemistry (McElroy et al. 2013) proposes the neutral-neutral gas-phase reaction C2H2 + Si → SiC2 + H2 for the formation of SiC2. To compute the rate constant, k(T), we use the expression:

where α = 1.3 × 10⁻¹⁰ cm3 s−1, β = −0.71, and γ = 29 K based on experiments by Canosa et al. (2001); see also UMIST. Then, the calculated k(T) at typical Tkin in GC clouds, that is, 70– 150 K, is of the order 10−10 s−1. If atomic silicon is released during the disruption of dust grains, then a reaction with C2H2 is an effective possible route for the formation of SiC2 in the gas phase. According to mid-infrared observations, C2H2 is one of the most abundant molecules in the inner regions of circumstellar envelopes where dust formation is expected, exhibiting a fractional abundance of 8 × 10⁻⁵ (Fonfría et al. 2008). This molecule is also regarded as being key to the formation of dust nucleation clusters, such as polycyclic aromatic hydrocarbons, and later to grain growth through addition of molecules to the surface (Cherchneff et al. 1992).
5 Conclusion
We searched for Si-bearing species toward G +0.693, a chemically rich molecular cloud located within the Sgr B2 complex in the GC. The cloud is believed to be affected by shock waves driven by cloud-cloud collisions in the region. We report the first detection of SiC2 toward G +0.693 through six rotational transitions. We obtained a fractional abundance of several 10−11 relative to H2 for SiC2. We also detect eight rotational transitions of SiS and four transitions of Si18O toward the same cloud. The derived fractional abundances are a few 10−10 for SiS and 10−9 for SiO, which is in agreement with previous observational studies.
We find that the fraction of silicon locked in SiC2, SiS, and SiO in G +0.693 is low compared to that found in the circumstellar envelopes of AGB stars. We investigate the origin of SiC2 emission in the ISM and conclude that SiC2 can be formed in the gas phase by a reaction between the sputtered atomic silicon and C2H2, or it can be released directly from the dust grains due to disruption.
Our conclusions on the formation of SiC2 in the ISM are solely based on its detection in G +0.693. Further observations in this direction, particularly toward outflows, are needed to better investigate the occurrence and origin of SiC2 in the ISM and to improve our understanding of the interstellar silicon chemistry.
Acknowledgements
The 40 m radio telescope at the Yebes Observatory is operated by the Spanish Geographic Institute (IGN, Ministerio de Transportes, Movilidad y Agenda Urbana). The Yebes 40m observations were carried out through project 20A008. P.d.V. and B.T. thank the support from the Spanish Ministerio de Ciencia e Innovacion (MICIU) through project PID2019-107115GB-C21. B.T. also acknowledges the Spanish MICIU for funding support from grant PID2019-106235GB-I00. We acknowledge financial support through the Spanish grant PID2019-105552RB-C41 funded by MCIN/AEI/10.13039/501100011033.
References
- Amo-Baladrón, M. A., Martín-Pintado, J., Morris, M. R., Muno, M. P., & Rodríguez-Fernández, N. J. 2009, ApJ, 694, 943 [CrossRef] [Google Scholar]
- Bordiu, C., Rizzo, J. R., Bufano, F., et al. 2022, ApJ, 939, L30 [NASA ADS] [CrossRef] [Google Scholar]
- Canosa, A., Le Picard, S. D., Gougeon, S., et al. 2001, J. Chem. Phys., 115, 6495 [NASA ADS] [CrossRef] [Google Scholar]
- Castro-Carrizo, A., Lucas, R., Bujarrabal, V., Colomer, F., & Alcolea, J. 2001, A & A, 368, L34 [NASA ADS] [CrossRef] [EDP Sciences] [Google Scholar]
- Cernicharo, J., Gottlieb, C. A., Guelin, M., Thaddeus, P., & Vrtilek, J. M. 1989, ApJ, 341, L25 [NASA ADS] [CrossRef] [Google Scholar]
- Chen, T., Xiao, C. Y., Li, A., & Zhou, C. T. 2022, MNRAS, 509, 5231 [Google Scholar]
- Cernicharo, J., Agúndez, M., Velilla Prieto, L., et al. 2017, A & A, 606, A5 [Google Scholar]
- Cherchneff, I., Barker, J. R., & Tielens, A. G. G. M. 1992, ApJ, 401, 269 [Google Scholar]
- Dickinson, D. F., & Kuiper, E. N. R. 1981, ApJ, 247, 112 [NASA ADS] [CrossRef] [Google Scholar]
- Fonfría, J. P., Cernicharo, J., Richter, M. J., & Lacy, J. H. 2008, ApJ, 673, 445 [CrossRef] [Google Scholar]
- Goldsmith, P. F., & Langer, W. D. 1999, ApJ, 517, 209 [Google Scholar]
- Guesten, R., & Henkel, C. 1983, A & A, 125, 136 [NASA ADS] [Google Scholar]
- Güsten, R., & Philipp, S. D. 2004, The Dense Interstellar Medium in Galaxies, eds. S. Pfalzner, C. Kramer, C. Staubmeier, & A. Heithausen, 91, 253 [CrossRef] [Google Scholar]
- Hackwell, J. A. 1972, A & A, 21, 239 [NASA ADS] [Google Scholar]
- Huettemeister, S., Dahmen, G., Mauersberger, R., et al. 1998, A & A, 334, 646 [NASA ADS] [Google Scholar]
- Jiménez-Serra, I., Martín-Pintado, J., Rodríguez-Franco, A., & Martín, S. 2005, ApJ, 627, L121 [Google Scholar]
- Jiménez-Serra, I., Caselli, P., Martín-Pintado, J., & Hartquist, T. W. 2008, A & A, 482, 549 [CrossRef] [EDP Sciences] [Google Scholar]
- Jiménez-Serra, I., Martín-Pintado, J., Rivilla, V. M., et al. 2020, Astrobiology, 20, 1048 [Google Scholar]
- Jiménez-Serra, I., Rodríguez-Almeida, L. F., Martín-Pintado, J., et al. 2022, A & A, 663, A181 [CrossRef] [EDP Sciences] [Google Scholar]
- Koeppen, J., & Kegel, W. H. 1980, A & AS, 42, 59 [NASA ADS] [Google Scholar]
- Langer, W. D., & Glassgold, A. E. 1990, ApJ, 352, 123 [NASA ADS] [CrossRef] [Google Scholar]
- Lefloch, B., Bachiller, R., Ceccarelli, C., et al. 2018, MNRAS, 477, 4792 [Google Scholar]
- Liechti, S., & Wilson, T. L. 1996, A & A, 314, 615 [NASA ADS] [Google Scholar]
- Lodders, K. 2003, ApJ, 591, 1220 [Google Scholar]
- Mancini, L., Trinari, M., Valença Ferreira de Aragão, E., Rosi, M., & Balucani, N. 2022, arXiv e-prints, [arXiv:2212.11754] [Google Scholar]
- Martín, S., Requena-Torres, M. A., Martín-Pintado, J., & Mauersberger, R. 2008, ApJ, 678, 245 [CrossRef] [Google Scholar]
- Martín, S., Martín-Pintado, J., Blanco-Sánchez, C., et al. 2019, A & A, 631, A159 [CrossRef] [EDP Sciences] [Google Scholar]
- Martin-Pintado, J., Bachiller, R., & Fuente, A. 1992, A & A, 254, 315 [NASA ADS] [Google Scholar]
- Martín-Pintado, J., de Vicente, P., Fuente, A., & Planesas, P. 1997, ApJ, 482, L45 [NASA ADS] [CrossRef] [Google Scholar]
- Massalkhi, S., Agúndez, M., Cernicharo, J., et al. 2018, A & A, 611, A29 [NASA ADS] [CrossRef] [EDP Sciences] [Google Scholar]
- Massalkhi, S., Agúndez, M., & Cernicharo, J. 2019, A & A, 628, A62 [NASA ADS] [CrossRef] [EDP Sciences] [Google Scholar]
- Massalkhi, S., Agúndez, M., Cernicharo, J., & Velilla-Prieto, L. 2020, A & A, 641, A57 [NASA ADS] [CrossRef] [EDP Sciences] [Google Scholar]
- McElroy, D., Walsh, C., Markwick, A. J., et al. 2013, A & A, 550, A36 [NASA ADS] [CrossRef] [EDP Sciences] [Google Scholar]
- Minh, Y. C., Liu, H. B., Su, Y.-N., et al. 2015, ApJ, 808, 86 [NASA ADS] [CrossRef] [Google Scholar]
- Morris, M., Gilmore, W., Palmer, P., Turner, B. E., & Zuckerman, B. 1975, ApJ, 199, L47 [NASA ADS] [CrossRef] [Google Scholar]
- Müller, H. S. P., Schlöder, F., Stutzki, J., & Winnewisser, G. 2005, J. Mol. Struct., 742, 215 [Google Scholar]
- Pickett, H., Poynter, R., Cohen, E., et al. 1998, JQSRT, 60, 883 [NASA ADS] [CrossRef] [Google Scholar]
- Podio, L., Codella, C., Lefloch, B., et al. 2017, MNRAS, 470, L16 [Google Scholar]
- Requena-Torres, M. A., Martín-Pintado, J., Rodríguez-Franco, A., et al. 2006, A & A, 455, 971 [NASA ADS] [CrossRef] [EDP Sciences] [Google Scholar]
- Requena-Torres, M. A., Martín-Pintado, J., Martín, S., & Morris, M. R. 2008, ApJ, 672, 352 [Google Scholar]
- Rivilla, V. M., Martín-Pintado, J., Jiménez-Serra, I., et al. 2019, MNRAS, 483, L114 [NASA ADS] [CrossRef] [Google Scholar]
- Rivilla, V. M., Martín-Pintado, J., Jiménez-Serra, I., et al. 2020, ApJ, 899, L28 [Google Scholar]
- Rivilla, V. M., Jiménez-Serra, I., García de la Concepción, J., et al. 2021a, MNRAS, 506, L79 [NASA ADS] [CrossRef] [Google Scholar]
- Rivilla, V. M., Jiménez-Serra, I., Martín-Pintado, J., et al. 2021b, PNAS, 118 [Google Scholar]
- Rivilla, V. M., Colzi, L., Jiménez-Serra, I., et al. 2022a, ApJ, 929, L11 [NASA ADS] [CrossRef] [Google Scholar]
- Rivilla, V. M., García De La Concepción, J., Jiménez-Serra, I., et al. 2022b, Front. Astron. Space Sci., 9, 829288 [NASA ADS] [CrossRef] [Google Scholar]
- Rivilla, V. M., Jiménez-Serra, I., Martín-Pintado, J., et al. 2022c, Front. Astron. Space Sci., 9, 876870 [NASA ADS] [CrossRef] [Google Scholar]
- Rocha, C. M. R., Linnartz, H., & Varandas, A. J. C. 2022, J. Chem. Phys., 157, 104301 [NASA ADS] [CrossRef] [Google Scholar]
- Rodríguez-Almeida, L. F., Jiménez-Serra, I., Rivilla, V. M., et al. 2021a, ApJ, 912, L11 [CrossRef] [Google Scholar]
- Rodríguez-Almeida, L. F., Rivilla, V. M., Jiménez-Serra, I., et al. 2021b, A & A, 654, L1 [CrossRef] [EDP Sciences] [Google Scholar]
- Rodríguez-Fernández, N. J., Martín-Pintado, J., de Vicente, P., et al. 2000, A & A, 356, 695 [Google Scholar]
- Rodriguez-Fernandez, N. J., Combes, F., Martin-Pintado, J., Wilson, T. L., & Apponi, A. 2006, A & A, 455, 963 [NASA ADS] [CrossRef] [EDP Sciences] [Google Scholar]
- Rosi, M., Mancini, L., Skouteris, D., et al. 2018, Chem. Phys. Lett., 695, 87 [NASA ADS] [CrossRef] [Google Scholar]
- Roveri, R. M., Erdelyi Mendes, M., & Singh, P. D. 1988, A & A, 199, 127 [NASA ADS] [Google Scholar]
- Schilke, P., Groesbeck, T. D., Blake, G. A., Phillips T. G. 1997, ApJS, 108, 301 [NASA ADS] [CrossRef] [Google Scholar]
- Schilke, P., Leurini, S., Menten, K. M., & Alcolea, J. 2003, A & A, 412, L15 [NASA ADS] [CrossRef] [EDP Sciences] [Google Scholar]
- Schöier, F. L., Olofsson, H., & Lundgren, A. A. 2006, A & A, 454, 247 [CrossRef] [EDP Sciences] [Google Scholar]
- Schöier, F. L., Bast, J., Olofsson, H., & Lindqvist, M. 2007, A & A, 473, 871 [CrossRef] [EDP Sciences] [Google Scholar]
- Tercero, B., Vincent, L., Cernicharo, J., Viti, S., & Marcelino, N. 2011, A & A, 528, A26 [NASA ADS] [CrossRef] [EDP Sciences] [Google Scholar]
- Tercero, F., López-Pérez, J. A., Gallego, J. D., et al. 2021, A & A, 645, A37 [NASA ADS] [CrossRef] [EDP Sciences] [Google Scholar]
- Thaddeus, P., Cummins, S. E., & Linke, R. A. 1984, ApJ, 283, L45 [NASA ADS] [CrossRef] [Google Scholar]
- Tsuji, T. 1973, A & A, 23, 411 [NASA ADS] [Google Scholar]
- Turner, B. E. 1992, ApJ, 388, L35 [NASA ADS] [CrossRef] [Google Scholar]
- van der Tak, F. F. S., Black, J. H., Schöier, F. L., Jansen, D. J., & van Dishoeck, E. F. 2007, A & A, 468, 627 [NASA ADS] [CrossRef] [EDP Sciences] [Google Scholar]
- Wilson, T. L. 1999, Rep. Progr. Phys., 62, 143 [CrossRef] [Google Scholar]
- Wilson, T. L., & Rood, R. 1994, ARA & A, 32, 191 [NASA ADS] [CrossRef] [Google Scholar]
- Wilson, R. W., Penzias, A. A., Jefferts, K. B., Kutner, M., & Thaddeus, P. 1971, ApJ, 167, L97 [NASA ADS] [CrossRef] [Google Scholar]
- Wolff, R. S. 1980, ApJ, 242, 1005 [NASA ADS] [CrossRef] [Google Scholar]
- Zanchet, A., Roncero, O., Agúndez, M., & Cernicharo, J. 2018, ApJ, 862, 38 [NASA ADS] [CrossRef] [Google Scholar]
- Zeng, S., Jiménez-Serra, I., Rivilla, V. M., et al. 2018, MNRAS, 478, 2962 [Google Scholar]
- Zeng, S., Zhang, Q., Jiménez-Serra, I., et al. 2020, MNRAS, 497, 4896 [NASA ADS] [CrossRef] [Google Scholar]
- Zeng, S., Jiménez-Serra, I., Rivilla, V. M., et al. 2021, ApJ, 920, L27 [NASA ADS] [CrossRef] [Google Scholar]
- Ziurys, L. M. 1988, ApJ, 324, 544 [NASA ADS] [CrossRef] [Google Scholar]
- Ziurys, L. M. 1991, ApJ, 379, 260 [NASA ADS] [CrossRef] [Google Scholar]
All Tables
All Figures
|
Fig. 1 Observed spectra of SiC2 toward G + 0.693 (black histogram). The green lines correspond to the synthetic spectra calculated assuming LTE. The red lines show the synthetic spectra that account for the emission of all the molecules identified toward G + 0.693, including SiC2. The blue lines correspond to the line profiles calculated using Radex. |
| In the text | |
|
Fig. 2 Observed spectra of SiS toward G + 0.693 (black histogram). The green lines correspond to the synthetic spectra calculated assuming LTE. The red lines show the synthetic spectra that account for the emission of all the molecules identified toward G + 0.693. The blue lines correspond to the line profiles calculated using Radex. |
| In the text | |
|
Fig. 3 Observed spectra of the isotopolog Si18O toward G + 0.693 (black histogram). The green lines correspond to the synthetic spectra calculated assuming LTE. The red lines show the synthetic spectra that account for the emission of all the molecules identified toward G + 0.693. The blue lines correspond to the line profiles calculated using Radex. |
| In the text | |
|
Fig. 4 Bar plot comparing the fractional abundance of SiC2, SiS, and SiO relative to H2 in different environments. For G + 0.693, the abundances are obtained from this work. For L1157-B1, the SiO and SiS abundances are taken from Podio et al. (2017), while the upper limit on the SiC2 abundance is derived in this work using the ASAI survey (Lefloch et al. 2018). The abundances of the carbon-rich AGB stars and oxygen-rich AGB stars are from Massalkhi et al. (2018, 2019) and Massalkhi et al. (2020), respectively. For the AGB stars, the height of the bar corresponds to the average fractional abundance derived in the studied samples, while the error bar refers to the wide range of values found. Downward-pointing arrows represent upper limits to the abundance. |
| In the text | |
|
Fig. 5 Comparison of abundances between different pairs of molecules. The plots show the derived fractional abundances relative to H2 of SiO vs. SiC2 (left panel), and SiO vs. SiS (right panel). The sources with nondetections are denoted with arrows. The dashed line represents equal abundances of molecules. |
| In the text | |
Current usage metrics show cumulative count of Article Views (full-text article views including HTML views, PDF and ePub downloads, according to the available data) and Abstracts Views on Vision4Press platform.
Data correspond to usage on the plateform after 2015. The current usage metrics is available 48-96 hours after online publication and is updated daily on week days.
Initial download of the metrics may take a while.