| Issue |
A&A
Volume 663, July 2022
|
|
|---|---|---|
| Article Number | A181 | |
| Number of page(s) | 15 | |
| Section | Interstellar and circumstellar matter | |
| DOI | https://doi.org/10.1051/0004-6361/202142699 | |
| Published online | 04 August 2022 | |
Precursors of fatty alcohols in the ISM: Discovery of n-propanol
1
Centro de Astrobiología (CSIC/INTA),
Ctra. de Torrejón a Ajalvir km 4,
28806
Torrejón de Ardoz,
Spain
e-mail: This email address is being protected from spambots. You need JavaScript enabled to view it.
2
INAF – Osservatorio Astrofisico di Arcetri,
Largo Enrico Fermi 5,
50125
Florence,
Italy
3
Dipartimento di Chimica “Giacomo Ciamician”, Universitá di Bologna,
via F. Selmi 2,
40126
Bologna,
Italy
4
Star and Planet Formation Laboratory, Cluster for Pioneering Research,
RIKEN,2-1 Hirosawa, Wako,
Saitama
351-0198,
Japan
5
Department of Applied Chemistry, Faculty of Engineering, Kanagawa Institute of Technology,
Atsugi, Kanagawa
240-0292,
Japan
6
The Graduate University for Advanced Studies,
Hayama, Kanagawa
240-0193,
Japan
7
Observatorio de Yebes (IGN),
Cerro de la Palera s/n,
19141
Guadalajara,
Spain
8
University of Maryland,
College Park, ND
20742-2421,
USA
9
Department of Physics, Astronomy and Geosciences, Towson University,
MD
21252,
USA
10
European Southern Observatory,
Alonso de Córdova 3107, Vitacura,
763 0355
Santiago,
Chile
11
Joint ALMA Observatory,
Alonso de Córdova 3107, Vitacura,
763 0355
Santiago,
Chile
Received:
19
November
2021
Accepted:
18
April
2022
Abstract
Context. Theories of the origins of life propose that early cell membranes were synthesised from amphiphilic molecules simpler than phospholipids, such as fatty alcohols. The discovery in the interstellar medium (ISM) of ethanolamine, the simplest phospholipid head group, raises the question whether simple amphiphilic molecules are also synthesised in space.
Aims. We investigate whether precursors of fatty alcohols are present in the ISM.
Methods. To do this, we have carried out a spectral survey at 7, 3, 2 and 1 mm towards the Giant Molecular Cloud G+0.693-0.027 located in the Galactic centre using the IRAM 30 m and Yebes 40 m telescopes.
Results. Here, we report the detection in the ISM of the primary alcohol n-propanol (in both conformers Ga-n-C3H7OH and Aa-n-C3H7OH), a precursor of fatty alcohols. The derived column densities of n-propanol are (5.5 ± 0.4) × 1013 cm−2 for the Ga conformer and (3.4 ± 0.3) × 1013 cm−2 for the Aa conformer, which imply molecular abundances of (4.1 ± 0.3) × 10−10 for Ga-n-C3H7OH and of (2.5 ± 0.2) × 10−10 for Aa-n-C3H7OH. We also searched for the AGa conformer of n-butanol [AGa-n-C4H9OH] without success, yielding an upper limit to its abundance of ≤4.1 × 10⁻¹¹. The inferred CH3OH:C2H5OH:C3H7OH:C4H9OH abundance ratios are 1:0.04:0.006:≤0.0004 towards G+0.693-0.027, that is, they decrease roughly by one order of magnitude for increasing complexity. We also report the detection of both syn and anti conformers of vinyl alcohol, with column densities of (1.11 ± 0.08) × 1014 cm−2 and (1.3 ± 0.4) × 1013 cm−2, and abundances of (8.2 ± 0.6) × 10−10 and (9.6 ± 3.0) × 10−11, respectively.
Conclusions. The detection of n-propanol, together with the recent discovery of ethanolamine in the ISM, opens the possibility that precursors of lipids according to theories of the origin of life, could have been brought to Earth from outer space.
Key words: ISM: molecules / ISM: clouds / Galaxy: center / astrochemistry / line: identification
© I. Jiménez-Serra et al. 2022
 Open Access article, published by EDP Sciences, under the terms of the Creative Commons Attribution License (https://creativecommons.org/licenses/by/4.0), which permits unrestricted use, distribution, and reproduction in any medium, provided the original work is properly cited.
This article is published in open access under the Subscribe-to-Open model. This email address is being protected from spambots. You need JavaScript enabled to view it. to support open access publication.
1 Introduction
Compartmentalisation (i.e. the formation of vesicles or small membranes) is an essential step in the emergence of life. Theories of the origin of life such as prebiotic systems chemistry (Ruiz-Mirazo et al. 2014) propose that compartmentalisation had to appear concurrently with the first metabolic and replicative systems forming proto-cells. It is thought that the composition of primordial membranes was much simpler than that of modern cells. Several families of amphiphilic molecules such as alkyl phosphates, alkyl sulphates, fatty acids, and fatty alcohols have been proposed as possible prebiotic lipids, that is, as constituents of proto-membranes (Ruiz-Mirazo et al. 2014). Among them, fatty alcohols (also called primary alcohols) present a simple structure consisting of a straight chain with the OH group linked to a primary carbon (i.e. forming a -CH2OH group).
Two possible scenarios have been proposed for the formation of prebiotic lipids: they could form endogenously under early Earth conditions for instance via Fischer-Tropsch synthesis (Nooner et al. 1976; McCollom et al. 1999; Ruiz-Mirazo et al. 2014), or they could be synthesised exogenously in interstellar space and incorporated to Solar System materials such as interplanetary dust particles, comets, and meteorites (Bernstein et al. 1999). Although not all examined meteorites contain long-chain amphiphiles (Deamer et al. 1994), Deamer (1985) showed that the amphiphilic compounds found in the Murchison meteorite can form vesicle-like structures under certain prebiotic conditions. Using the different contributions to organic matter delivery analysed by Chyba & Sagan (1992, see their Table 2), Ruiz-Mirazo et al. (2014) estimated that a total amount of ~1016–1018 kg of extraterrestrial organic matter was delivered to Earth during the Late Heavy Bombardment period (mainly between 3.9 and 3.8 billion years ago), which supports the idea that extraterrestrial material could have contributed to the emergence of prebiotic lipids in an early Earth1.
The recent discovery of ethanolamine (NH2CH2CH2OH), the simplest head group of phospholipids (Rivilla et al. 2021a), in the interstellar medium (ISM), has raised the interest for the search of precursors of prebiotic lipids in space, and in particular, of other alcohols. For fatty alcohols, the only ones that have been observed in the ISM are methanol (CH3OH) and ethanol (C2H5OH), which are practically ubiquitous in the ISM (see e.g. Jorgensen et al. 2020; Martín et al. 2021, and references therein). n-propanol (also named 1-propanol; molecular formula CH3CH2CH2OH or C3H7OH) has been searched for in the ISM, but no detection has been reported to date (Tercero et al. 2015; Müller et al. 2016; Qasim et al. 2019a; Manigand et al. 2021). However, primary alcohols, including propanol, have been detected in comet 67P/Churyumov-Gerasimenko (Altwegg et al. 2019), which suggests that this molecule could be formed under interstellar conditions.
In this work, we report the discovery of n-propanol towards the Giant Molecular Cloud (GMC) G+0.693-0.027 (hereafter G+0.693) located in the Galactic centre. We also report the detection of both syn and anti conformers of vinyl alcohol (CH2CHOH) towards the same cloud. The syn conformer was tentatively detected towards SgrB2(N) by Turner & Aponi (2001), but this detection was never confirmed in higher-sensitivity observations carried out with ALMA (Martin-Drumel et al. 2019). More recently, Agúndez et al. (2021) have unambiguously identified the syn conformer towards TMC-1. However, to our knowledge, this is the first time that the anti conformer of this molecule is robustly detected in the ISM.
G+0.693 is known to be one of the most chemically rich interstellar sources in our Galaxy (Requena-Torres et al. 2006, 2008; Zeng et al. 2018), despite the fact it does not show any sign of high-mass star formation activity (Zeng et al. 2020). The chemistry of this cloud is characterised by the presence of low-velocity shocks (its emission shows broad line widths of ~20km s−1 and high abundances of HNCO, a typical molecular tracer of low-velocity shocks; Martín et al. 2008), which sputter the molecular content of the icy mantles of dust grains into the gas phase (see e.g. Jiménez-Serra et al. 2008). The H2 gas densities in G+0.693 are of the order of a few 104 cm−3 (Zeng et al. 2020), and the gas kinetic temperatures range from 70 to 150 K, as measured using CH3CN (Zeng et al. 2018). Due to the low H2 gas densities, the molecular line emission from high dipole moment molecules such as complex organics is sub-thermally excited, and their excitation temperature lies below 20 K (Requena-Torres et al. 2006; Zeng et al. 2018). This represents an advantage for the search of new molecular species since the millimetre spectra observed towards this source present rather low levels of line blending and line confusion. As a result, G+0.693 has yielded several first detections of new molecular species in the ISM, including Z-cyanomethanimine (Z-HNCHCN; Rivilla et al. 2019), hydroxylamine (NH2OH; Rivilla et al. 2020), ethanolamine (NH2CH2CH2OH; Rivilla et al. 2021a), the cyanomydil radical (HNCN; Rivilla et al. 2021b), mono-thioformic acid (HC(O)SH; Rodríguez-Almeida et al. 2021a), ethyl isocyanate (C2H5NCO; Rodríguez-Almeida et al. 2021b), and PO+ (Rivilla et al. 2022). Urea, an important prebiotic molecule (Becker et al. 2019; Belloche et al. 2019), has also been detected towards this cloud (Jiménez-Serra et al. 2020).
The paper is organised as follows. In Sect. 2 we describe the observations, and in Sect. 3 we present the detections of n-propanol and the syn and anti forms of vinyl alcohol. We also report the upper limits to the non-detections of isopropanol (i-C3H7OH), ethyl methyl ether (CH3OCH2CH3), cyclopropanol (c-C3H5OH), and n-butanol (n-C4H9OH). In Sect. 4 we discuss the chemistry of n-propanol and vinyl alcohol and place these detections in context with previous works and with theories of the origin of life. Finally, in Sect. 5 we present our conclusions.
2 Observations
We have carried out a spectral line survey at 1, 2, 3, and 7 mm toward G+0.693 with the Instituto de Radioastronomía Milimétrica (IRAM) 30 m telescope (Granada, Spain) and the Yebes 40 m telescope (Guadalajara, Spain). The spectral coverage extends from 32 to 233 GHz, and the data were smoothed to a typical velocity resolution of ~1.5–2.5kms−1. The equatorial coordinates of the source are α(J2000) = 17h47m22s and δ(J2000) = −28°21′27″. We used the position-switching mode with an off position located at (−885″, 290″) with respect to G+0.693. Each frequency setup was repeated by shifting the central frequency by 20–100 MHz in order to identify spurious lines or contamination from the image band.
The IRAM 30 m observations were performed during three sessions in 2019: 10–16 April, 13–19 August, and 11–15 December. The EMIR E090, E150, and E230 receivers were used together with the fast Fourier transform spectrometers (FFTS) with a frequency resolution of 200 kHz (equivalent to a velocity resolution between 0.8 and 0.26 km s−1 at 3 and 1mm, respectively). The IRAM 30 m beam size ranged from ~34″ to 11″ when going from 72 to 233 GHz. The observations with the Yebes 40 m radiotelescope were carried out between the 3–9 and 15–22 February 2020. The Nanocosmos Q-band (7 mm) HEMT receiver was used, which enabled ultra broad-band observations with an instantaneous bandwidth of 18.5 GHz per polarisation between 31.3 and 50.6 GHz (Tercero et al. 2021). The 16 FFTS provided a channel width of 38 kHz, which corresponds to a velocity resolution of 0.22–0.36 km s−1. The Yebes 40 m beam size ranged from ~54″ to 36″ when moving from 31 to 50 GHz. The line intensity of all spectra was measured in units of  as the molecular emission toward G+0.693 is extended compared to the main beam of the telescopes (Requena-Torres et al. 2006; Zeng et al. 2020).
3 Analysis and Results
3.1 Detection of the Ga and Aa Conformers of n-Propanol
We used the data analysis package MADCUBA2 (Martín et al. 2019) to search for all transitions from the Ga, Aa, Gg, and Gg′ conformers of n-propanol (or 1-propanol) within our dataset (see Fig. 1). We were unable to search for the Ag conformer because its energy levels are heavily perturbed by the Aa species and the spectroscopic parameters have not been reported so far (see Kisiel et al. 2010). The relative energies of the n-propanol con-formers are E = 0 K for Ga, E = 40.3 K for Aa, E = 64.7 K for Ag, E = 68.8 K for Gg, and E = 73.2 K for Gg′ (Kisiel et al. 2010). We note, however, that the conformers of n-propanol were modelled independently (i.e. without taking their zero-point energy into account) as it has been done in the past for other species towards G+0.693 such as imines, for which both the low- and high-energy conformers have been detected (see Rivilla et al. 2019). Our data reveal that only the two lowest-energy conformers, Ga and Aa (hereafter Ga-n-C3H7OH and Aa-n-C3H7OH, respectively; see Fig. 1), are detected towards G+0.693 (see below). The spectroscopic information of Ga-n-C3H7OH was extracted from the Cologne Database for Molecular Spectroscopy catalog (CDMS, entry 060505; Endres et al. 2016), which was derived from the rotational spectrum measured by Kisiel et al. (2010). The spectroscopic information for the remaining conformers of n-propanol was obtained by us using the data from Dreizler & Scappini (1981) and Kisiel et al. (2010).
The line identification and analysis of the transitions of Ga-n-C3H7OH and Aa-n-C3H7OH was carried out using the tool called spectral line identification and modelling (SLIM) of MADCUBA. SLIM uses the spectroscopic data entries from the molecular catalogues to generate synthetic spectra under the assumption of local thermodynamic equilibrium (LTE) and by considering line opacity effects. The LTE fit that best matches the observed line spectra of Ga-n-C3H7OH and Aa-n-C3H7OH provides the derived values for the molecular column densities (N), excitation temperatures (Tex), central radial velocities of the gas (vLSR), and the full widths at half maximum (FWHM) of the line emission.
Figures 2 and 3 present the unblended and slightly blended transitions of Ga-n-C3H7OH and Aa-n-C3H7OH, respectively, detected towards G+0.693. Table 1 reports the spectroscopic information of the transitions from these species together with the rms noise level measured in the spectra (rms), the derived integrated line intensities ( ) and the signal-to-noise ratio (S/N) (also in integrated intensity) obtained with MADCUBA-SLIM. The rms noise level (rms) was calculated at the velocity resolution reported in Table 1 using all the line-free parts of each spectrum within a velocity range of ± 200 km s−1 around each line. For the spectra with too few available line-free parts, a velocity range of ± 600 km s−1 around each line was used. To improve the visualisation of the detected lines, some of the spectra were smoothed to a velocity resolution of 4–8 km s−1, enough to provide ≥3 resolution elements over the line width. We stress that the smoothing of the lines does not affect our analysis in any form, as demonstrated by Rivilla et al. (2020).
In Figs. 2 and 3 and Table 1, we indicate the transitions that provide the identification of Ga-n-C3H7OH and Aa-n-C3H7OH with asterisks. All these transitions have an S /N ≥ 6, where the error in the integrated intensity of the lines is calculated as  , where δv is the velocity resolution of the spectra and Δv is the FWHM of the line emission. We note, however, that if a more conservative approach were taken (i.e. if we considered Δv as the full velocity range covered by the line), then the S/N would be lower by a factor sqrt(2) = 1.4. This would not affect the identification of the species reported here because all the bright lines that contribute to the identification of Ga-n-C3H7OH and Aa-n-C3H7OH would have an S/N ≥ 4.5 even after correcting by this factor. The remaining transitions of Ga-n-C3H7OH and Aa-n-C3H7OH reported in Table 1 and Figs. 2 and 3 without asterisks demonstrate that they are consistent with the species identification and their LTE fits. Figures 2 and 3 also show the 3 × rms noise level in intensity (dotted black lines) and the
  level (with N the number of channels across the FWHM), which is associated with the noise level in integrated intensity, that is, our detectability criterion (see the dotted red lines).
The 66,X →55,X, 44,X →33,X, and 31,2→20,2 transitions of Ga-n-C3H7OH at 162 332, 10 5032, and 40 341 MHz, respectively (see Fig. 2), are partly blended with HSC, s-propanal, and C2H5NCO lines of similar intensity (see the detections of some of these species in Rivilla et al. 2020; Rodríguez-Almeida et al. 2021b). However, we note that the global LTE fit (i.e. considering all molecular species) of the spectra at these frequencies perfectly matches the observed spectra (see the black histograms and solid blue lines in Fig. 2). For Aa-n-C3H7OH (see Fig. 3), the 101,10→90,9 and 92,8 →91,9 transitions are likely blended with lines from unidentified species, in addition to a small contribution from (CH2OH)2 for the 101,10 →90,9 line (see Table 1). The derived S/N of the 31,3→20,2 transition should be taken with caution since the LTE fit performed by MADCUBA-SLIM overpredicts the integrated intensity of this line. The remaining Ga-n-C3H7OH and Aa-n-C3H7OH transitions that we considered in our analysis but that are not shown here are consistent with their MADCUBA-SLIM LTE fits, although they appear heavily blended with lines from other molecular species.
The best LTE fit of the Ga-n-C3H7OH lines is obtained for a column density of N(Ga-n-C3H7OH) = (5.5 ± 0.4) × 1013 cm−2 and a Tex = 14 K, VLSR = 65.9 ± 1.0 km s−1 and Δv = 20kms−1 (Tex and Δv needed to be fixed for the SLIM-AUTOFIT algorithm to find convergence). For Aa-n-C3H7 OH, the best fit of the lines was reached for a N(Aa-n-C3H7OH) = (3.4 ± 0.3) × 1013 cm−2 and a Tex = 12.5 ± 2.0 K after fixing the central radial velocity and the FWHM of the source to VLSR = 69kms−1 and Δv = 20kms−1. The derived and assumed Tex, VLSR and Δv are consistent with those measured for other molecular species towards this source (see e.g. Requena-Torres et al. 2006; Zeng et al. 2018; Rivilla et al. 2020, Rivilla et al. 2021a; Rodríguez-Almeida et al. 2021a) and with the results obtained from the rotational diagrams of Ga-n-C3H7OH and Aa-n-C3H7OH shown in Figs. A.1 and A.2.
To derive the abundances of the Ga and Aa conformers of propanol, we assumed a H2 column density of 1.35 × 1023 cm−2 as measured towards G+0.693 (Martín et al. 2008). This provides an abundance of (4.1 ± 0.3) × 10−10 for Ga-n-C3H7OH and of (2.5 ± 0.2) × 10−10 for Aa-n-C3H7OH. The abundance ratio of the two detected conformers of n-propanol is Ga/Aa = 1.64. Considering this ratio and that the Aa conformer lies ~40 K above Ga, we can determine whether these two isomers are in thermo-dynamic equilibrium. With Eq. (3) of Rivilla et al. (2019), the derived Tkin is ~80K, consistent with the kinetic temperature range measured from CH3CN towards G+0.693 (between 70 and 150 K; see Zeng et al. 2018). The calculated Ga/Aa abundance ratio therefore suggests that both species are in thermodynamic equilibrium (understood as the equilibration between the abundances of the Ga and Aa conformers), as observed for other species such as the E/Z isomers of imines (see García de la Concepción et al. 2021).
The derived upper limits to the other two conformers of n-propanol for which spectroscopic data exist (Gg and Gg′) are presented in Table 2. They were calculated using the rms noise level of the brightest less blended transition spectra, and assuming a Tex = 12.5 K, that is, the same Tex as was inferred from Aa-n-C3H7OH (see above). The derived upper limits to their column densities and abundances are ≤ 1.6 × 1013 cm−2 and ≤1.2 × 10⁻¹⁰ for Gg-n-C3H7OH, and ≤5.7 × 1012 cm−2 and ≤4.2 × 10⁻¹¹ for Gg′-n-C3H7OH (see Table 2), respectively.
By using the abundance ratios Ga/Gg and Ga/Gg′, we can investigate whether the Gg and Gg′ conformers are also in thermodynamic equilibrium. The derived abundance ratios Ga/Gg ≥ 3.4 and Ga/Gg′ ≥ 9.7 yield kinetic temperatures Tkin≤56K and Tkin≤32K, respectively. These kinetic temperatures are lower than those measured towards G+0.693 (Zeng et al. 2018), which suggests that only the lower-energy con-formers of a molecular species could reach thermodynamic equilibrium via mechanisms such as multi-dimensional quantum tunnelling, as found for imines and acids (see García de la Concepción et al. 2021, 2022).
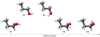 |
Fig. 1 Conformers of n-propanol (n-C3H7OH) represented as a function of relative energy. The two lowest-energy conformers are the Ga and Aa conform-ers, which have been detected towards G+0.693 (see Sect. 3.1). The x-axis is not to scale for visualisation purposes. The relative energies of the different conformers of n-propanol are E = 0 K for Ga, E = 40.3 K for Aa, E = 64.7 K for Ag, E = 68.8 K for Gg, and E = 73.2 K for Gg′ (see also Sect. 3.1). |
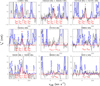 |
Fig. 2 Unblended and slightly blended transitions of Ga-n-C3H7OH detected towards G+0.693. The histogram and grey shaded area correspond to the observed IRAM 30 m and Yebes 40 m spectra. Red lines indicate the best LTE fit to the lines of Ga-n-C3H7OH reported in Table 1. Blue lines show the overall fit to the observed spectra considering all molecular species detected in G+0.693. The quantum numbers of the Ga-n-C3H7OH transitions are indicated in red at the bottom of the panels, while blue labels present the species identified in the shown spectra. The frequencies of the lines are shown in the upper part of each panel. The red asterisks indicate the transitions that provide the identification of Ga-n-C3H7OH. Dotted black lines indicate the 3 × rms level in intensity in the spectra. Dotted red lines show the detectability limit in the integrated area defined as |

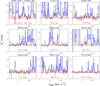 |
Fig. 3 Unblended and slightly blended transitions of Aa-n-C3H7OH detected towards G+0.693. The histogram, grey shaded area, colour lines, and labels are as in Fig. 2. Red lines indicate the best LTE fit to the lines of Aa-n-C3H7OH reported in Table 1. The frequencies of the lines are shown in the upper part of each panel, while the red asterisks indicate the transitions that contribute to the identification of Aa-n-C3H7OH. Dotted black lines indicate the 3 × rms level in intensity in the spectra. Dotted red lines show the detectability limit in the integrated area defined as |

3.2 Search of Isopropanol (I-Propanol) and Ethyl Methyl Ether
Isopropanol (also named isopropyl alcohol and 2-propanol) is a structural isomer of n-propanol. Its chemical formula is CH3CH(OH)CH3. We have searched for the gauche and anti conformers of i-propanol (g-i-C3H7OH and a-i-C3H7OH, respectively) in our dataset by using entries 060518 and 060519 of the CDMS molecular catalogue (Endres et al. 2016), obtained using the spectroscopic work of Maeda et al. (2006). The anti conformer is about 120 K higher in energy than the doubly degenerate gauche conformer.
None of the two conformers of i-propanol are detected (see Table 2), with upper limits to their column densities of ≤8.5 × 1012 cm−2 for g-i-C3H7OH and ≤3.9 × 1012 cm−2 for a-i-C3H7OH. These column densities translate into abundance upper limits of ≤6.3 × 10⁻¹¹ and ≤2.9 × 10⁻¹¹ for the gauche and anti conformers of i-propanol, respectively.
Propanol has a third structural isomer: ethyl methyl ether (CH3OCH2CH3 or methoxyethane). We have also searched for the trans conformer of this species (the lowest in energy) in our dataset by using the spectroscopic information reported by Fuchs et al. (2003) and by inserting the entry for this species in CDMS/JPL format into MADCUBA. This species has not been detected towards G+0.693 either, with upper limits to its column density and abundance of ≤3.8 × 1013 cm−2 and ≤2.8 × 10⁻¹⁰ (see Table 2), respectively.
Unblended or slightly blended transitions of Ga-n-C3H7OH and Aa-n-C3H7OH detected towards G+0.693.
3.3 Other Alcohols: Detection of the Syn and Anti forms of Vinyl Alcohol
We have also searched for other alcohols within our spectro-scopic survey towards G+0.693. We targeted vinyl alcohol (or ethenol, with formula H2C=CHOH), cyclopropanol (c-C3H5OH) and n-butanol (n-C4H9OH). We used the CDMS entries 044506 and 044507 for the syn and anti forms of vinyl alcohol (s-H2C=CHOH and a-H2C=CHOH in CDMS; Endres et al. 2016) based on the spectroscopic work of Melosso et al. (2019). The syn form of vinyl alcohol is the lowest in energy, with the anti form lying about 4.6 kJmol−1 (or 550 K) above the syn form (Rodler 1985). For cyclopropanol (c-C3H5OH), we took the spectroscopic information for the gauche conformer (the most stable one) from the work of Macdonald et al. (1978) and inserted the entry for this species in CDMS/JPL format into MADCUBA. In the same way, for n-butanol (both AGa-(E) and AGa-(A) methyl internal rotation substates), we calculated their spectroscopic information from the laboratory experiments and theoretical calculations of Kawashima et al. (2021).
Of all these species, only vinyl alcohol has been detected in both syn and anti forms (s-H2C=CHOH and a-H2C=CHOH, respectively) towards G+0.693. In Table 3 and Figs. 4 and 5, we report the clean and slightly blended transitions of the syn and anti forms of H2C=CHOH detected towards G+0.693 with an S/N ≥ 6 (see the transitions with asterisks). The rest of lines without asterisks are also shown in Table 3 and Figs. 4 and 5 to demonstrate that they are consistent with the identification of these species and their LTE fits.
Table 3 presents four clean transitions and three slightly blended transitions of s-H2C=CHOH, and three clean transitions and one slightly blended transition of a-H2C=CHOH. The 42,2→413 and 32,2→31,3 transitions of s-H2C=CHOH are blended with lines of C2H5CN and C2H3CN of similar intensity, respectively, while the 32,1→31,2 transition of a-H2C=CHOH is blended with CH3CHO (see Table 3). The 42,2→41,3 and 32,1→31,2 transitions of a-H2C=CHOH also present an S/N ≥ 6. However, these ratios are overestimated and should be taken with caution since they are calculated from the LTE fit of MADCUBA-SLIM and not from the Gaussian fit of the individual lines (see Table 3). As a result, these lines are not considered for the identification of a-H2C=CHOH.
We derived the physical parameters of s-H2C=CHOH and a-H2C=CHOH using the SLIM tool from MADCUBA (Martín et al. 2019). The best LTE fit for s-H2C=CHOH is obtained for a column density of (1.11 ± 0.08) × 1014 cm−2 and an excitation temperature of Tex = 8.0 ± 1.0K. For a-H2C=CHOH, the best fit of the lines is obtained for a column density of (1.3 ± 0.4) × 1013 cm−2 after fixing Tex = 14 K (as we did for Ga-n-propanol), Δv = 20kms−1 and VLSR = 69kms−1. These results are consistent with those obtained through the rotational diagrams of s-H2C=CHOH and a-H2C=CHOH (see Figs. A.3 and A.4). Assuming a H2 column density of 1.35 × 1023 cm−2 (Martín et al. 2008, see also Sect. 3.1), the derived column densities translate into molecular abundances of (8.2 ± 0.6) × 10−10 for s-H2C=CHOH, and of (9.6 ± 3.0) × 10−11 for a-H2C=CHOH. The syn/anti abundance ratio for H2C=CHOH is thus ~8.5.
By using again Equation 3 from Rivilla et al. (2019), we find a Tkin~260K, which is slightly higher than that measured towards G+0.693 (Zeng et al. 2018). If we had assumed a Tex = 8.0 K (i.e. the one obtained for s-H2C=CHOH), the derived column density would decrease by just a factor of 1.2, which would translate into a syn/anti abundance ratio ~10. This ratio would be consistent with a Tkin ~ 240 K, which is still higher than that determined by Zeng et al. (2018). This may mean that the two isomers of vinyl alcohol are not in thermodynamic equilibrium.
Finally, in Table 4, we report the upper limits to the column densities and abundances obtained for cyclopropanol and n-butanol. The upper limits to their abundance are ≤1.4× 10⁻¹⁰ and ≤4.1 × 10⁻¹¹, respectively.
Upper limits obtained for the Gg and Gg′ conformers of n-propanol for the anti and gauche conformers of i-propanol, and for the trans conformer of ethyl methyl ether.
Selected lines of the two forms of vinyl alcohol (H2C=CHOH), syn (s) and anti (a) detected towards G+0.693.
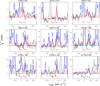 |
Fig. 4 Unblended and slightly blended transitions of s-H2C=CHOH detected towards G+0.693. For a description of the colours displayed in the plot, see Fig. 2. The spectroscopic information and the derived parameters from the best LTE fit of these lines are reported in Table 3. The frequencies of the lines are shown in the upper part of each panel, while the red asterisks indicate the transitions that contribute to the identification of s-H2C=CHOH. Dotted black lines indicate the 3 × rms level in intensity in the spectra. Dotted red lines show the detectability limit in integrated area defined as |

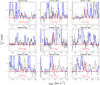 |
Fig. 5 Unblended and slightly blended transitions of a-H2C=CHOH detected towards G+0.693. For a description of the colours displayed in the plot, see Fig. 2. The spectroscopic information and the derived parameters from the best LTE fit of these lines are reported in Table 3. The frequencies of the lines are shown in the upper part of each panel. Red asterisks indicate the transitions that contribute to the identification of a-H2C=CHOH. Dotted black lines indicate the 3 × rms level in intensity in the spectra. Dotted red lines show the detectability limit in integrated area defined as |

Derived upper limits to the column densities and abundances of other alcohols observed towards G+0.693.
4 Discussion
4.1 Comparison of the Molecular Abundances of Propanol and Butanol with Smaller Alcohols
In order to gain some insight into the production efficiency of primary alcohols in the ISM, we compared the abundances and upper limits derived for n-propanol (n-C3H7OH) and n-butanol (n-C4H9OH) with those measured for methanol (CH3OH) and ethanol (C2H5OH) towards G+0.693 (see Fig. 6). The abundances of CH3OH and C2H5OH towards this giant molecular cloud have been provided recently by Rodríguez-Almeida et al. (2021a) and are (1.1 ± 0.2) × 10−7 for CH3OH and (4.6 ± 0.6) × 10−9 for C2H5OH.
From Fig. 6, it is clear that primary alcohols are produced about ten times less frequently each time a carbon atom is added to the chain (see red squares). Indeed, C2H5OH, n-C3H7OH, and n-C4H9OH present abundance ratios of 0.04, 0.006, and ≤0.0004, respectively, with respect to CH3OH. Note that the value above and the one shown in Fig. 6 for n-C3H7OH correspond to the sum of the abundances from both Ga and Aa conformers (see Sect. 3.1). The trend of decreasing abundance by roughly one order of magnitude for increasing complexity was already noted by Rodríguez-Almeida et al. (2021a) for CH3OH and C2H5OH as well as for thiols (with the -SH group). Here, we confirm that the same trend stands when the number of carbon atoms is increased to three and four within the chemical structure of primary alcohols.
By using IRAM 30 m and ALMA data, Tercero et al. (2015) and Müller et al. (2016) reported the abundances of CH3OH and C2H5OH and upper limits to the abundance of Ga-n-C3H7OH and i-propanol towards Orion KL and SgrB2 (N2), respectively. The C2H5OH/CH3OH abundance ratios are ~0.02 for Orion KL and ~0.05 for SgrB2 (N2), which are consistent with that found towards G+0.693 (~0.04). The upper limit to the Ga-n-C3H7OH/C2H5OH abundance ratio determined towards SgrB2 (N2) is ≤0.13, in agreement with the abundance ratio of ~0.14 measured towards G+0.693. For Orion KL, Tercero et al. (2015) reported a Ga-n-C3H7OH/C2H5OH abundance ratio of ≤0.017, that is, a factor of 10 lower than that obtained towards G+0.693. However, as noted by Müller et al. (2016), if the partition functions of C2H5OH and Ga-n-C3H7OH are corrected for conformational and vibrational contributions, this ratio becomes ≤ 0.07, which is of the same order of magnitude as those found towards SgrB2 (N2) and G+0.693.
For i-propanol, the upper limit to the abundance ratio with respect to CH3OH derived towards G+0.693 is consistent with that measured in the EMoCA survey towards the SgrB2 (N2) massive star-forming region (Müller et al. 2016). While the i-propanol abundance upper limit in SgrB2 (N2) provides an i-propanol abundance that is ≥430 times lower than the abundance of CH3OH, towards G+0.693 our measured upper limit gives an abundance that is ≥1700 times lower than that of CH3OH (Table 2). For the remaining alcohols explored in this work, vinyl alcohol is more than two orders of magnitude less abundant than CH3OH and a factor of 5 less abundant than C2H5OH, while methyl ethyl ether and cyclopropanol have abundances that are lower by factors of ≥500 and ≥800, respectively, than that of CH3OH (see Tables 2 and 4).
Finally, if we compare the derived upper limit abundance of methyl ethyl ether (CH3OCH2CH3) with the abundance of dimethyl ether (CH3OCH3) found towards G+0.693 (of 8.2 × 10⁻⁹; Requena-Torres et al. 2006), we find that dimethyl ether is a factor ≥30 more abundant than methyl ethyl ether, which is also consistent with the idea that the abundance of these COMs decreases by roughly one order of magnitude with the addition of a –CH2 group to their molecular structure.
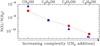 |
Fig. 6 Comparison of the molecular abundances of the primary alcohols methanol, ethanol, n-propanol, and n-butanol measured towards the giant molecular cloud G+0.693 (red squares) with the values predicted by the models of Charnley et al. (1995, blue triangles) for the case with initial solid abundances of 10−6, 10−7 , and 10−8 for C2H5OH, propanol, and butanol, respectively. Error bars are also shown in red for the measured abundances, and the downward red arrow indicates an upper limit. |
4.2 Chemistry of Propanol and Butanol in G+0.693
The chemistry of large alcohols was theoretically studied by Charnley et al. (1995) for the case of a massive hot molecular core. In this work, species such as CH3OH, C2H5OH, propanol (both n-C3H7OH and i-C3H7OH), and butanol (n-C4H9OH and t-C4H9OH) were assumed to be formed on the surface of dust grains and injected into the gas phase by the thermal evaporation of the grain mantles. The subsequent gas-phase chemistry yields pure ethers mainly through alkyl transfer and proton transfer reactions. Charnley et al. (1995) considered that the initial ice mantle abundance of propanol and butanol were factors of 10 and 100 lower, respectively, than that of solid ethanol.
In Sect. 4.1 we reported a similar trend for these large alcohols to decrease their abundance in G+0.693 by approximately a factor of 10 with the addition of a carbon atom. If we thus compare the modelling results of Charnley et al. (1995) with our measured abundances, the best match is found for the case with initial ice mantle abundances of 10−6, 10−7 , and 10−8 for C2H5OH, propanol and butanol, respectively. On timescales of 105 yr (the typical timescales that explain the rich chemistry in complex organics towards Galactic centre giant molecular clouds; see Requena-Torres et al. 2006), the predicted abundance of C2H5OH, propanol, and butanol in the gas phase are ~4 × 10⁻⁹, ~2 × 10⁻¹⁰, and ~1.5 × 10⁻¹¹ , respectively (see Fig. 3 in Charnley et al. 1995). These values are strikingly similar to those measured in G+0.693, that is, (4.6 ± 0.6) × 10−9 for C2H5OH (Rodríguez-Almeida et al. 2021a), (6.6 ± 0.5) × 10−10 for propanol, and ≤4 × 10⁻¹¹ for butanol (see blue triangles in Fig. 6). This suggests that even after gas-phase chemistry takes over, the decrease in the abundance of CH3OH, C2H5OH, propanol, and butanol by roughly one orderofmagnitude with an increasing number of carbon atoms is preserved in the gas phase, which may allow us to indirectly constrain the amount formed in the ices for these alcohols.
We note, however, that while the modelled propanol-to-C2H5OH abundance ratio is 0.05 (see Fig. 3 in Charnley et al. 1995), the same ratio measured in G+0.693 gives 0.15, which suggests that propanol is more efficiently produced under the highly energetic processing of the ISM in the Galactic centre than in typical Galactic hot cores (see Sect. 4.1 above). In addition, as pointed out by Requena-Torres et al. (2006), the models of Charnley et al. (1995) cannot explain the homogeneity of the COMs abundances across the different GMCs in the central molecular zone (or CMZ). Instead, a continuous replenishment of complex organic material from dust grains into the gas phase by large-scale shocks in the highly turbulent ISM of the Galactic centre needs to be invoked.
Charnley et al. (1995) assumed that propanol and butanol are present in ices, but did not explain how these species are formed. In the more recent chemical models of Manigand et al. (2021), propanol is formed on the surface of dust grains via two routes: (1) the successive hydrogenation of C3O, and (2) the radical-radical reaction between O and C3H8. The latter has two possible outcomes, O + C3H8→ C3H7OH and O + C3H8→ H2O + C3H6, with branching ratios of 20 and 80%, respectively. The models were applied to the case of the IRAS16293-2422 B low-mass hot corino, for which upper limits to the abundance of propanol were derived (Qasim et al. 2019a; Manigand et al. 2021). The results of Manigand et al. (2021) only reproduce the difference of a factor of 10 between the abundances of propanol and C2H5OH in the gas phase at the end of the simulations for models A1-E1, where an efficient destruction of C3 through the gas-phase reaction O + C3→C2 + CO is considered (see TableD1 in this work). We note, however, that the absolute abundances of propanol and C2H5OH predicted by these models clearly exceed the values observed towards G+0.693 (of ≥10−7–10−6; Manigand et al. 2021).
Laboratory experiments carried out by Qasim et al. (2019a) explored alternative formation routes for the formation of propanol in the ices such as the in situ recombination of HCO (formed after the hydrogenation of CO) with radicals formed via the processing of C2H2. This yields n-propanol after several hydrogenation steps where propenal (CH2CHCHO) and propanal (CH3CH2CHO) are intermediate steps. These species have been detected towards G+0.693 with abundances of 2.7 × 10⁻¹⁰ for CH2CHCHO and of 1.2 × 10⁻⁹ for CH3CH2CHO (see Table 4 in Requena-Torres et al. 2008)3. The abundance of CH3 CH2CHO is a factor of ~2 higher than that of n-propanol, which is consistent with the idea that all these species form concurrently on the surface of dust grains. Qasim et al. (2019b) also proposed that n-propanol and isopropanol could form in ices even at low temperatures through the radical-addition reaction between propyne (CH3CCH) and OH. This second mechanism, however, predicts an n-propanol-to-isopropanol abundance ratio of 1:1, which clearly differs from that measured towards G+0.693 (abundance ratio of 1:~0.1; see Sects. 3.1 and 3.2). The nondiffusive mechanism proposed by Qasim et al. (2019a) likely dominates the formation of these species towards G+0.693 since the dust grain temperatures in this source lie below 25 K (Rodríguez-Fernández et al. 2000).
4.3 Vinyl Alcohol: Comparison with Previous Observations
Vinyl alcohol has been reported tentatively towards the massive hot molecular core SgrB2(N) (Turner & Aponi 2001). More recently and based on a high-sensitivity spectroscopic survey carried out towards the molecular dark cloud TMC-1 with the Yebes 40m telescope, the syn conformer of vinyl alcohol (s-H2C=CHOH) was unambiguously identified (Agúndez et al. 2021). Our observations towards G+0.693 not only confirm the presence of s-H2C=CHOH in the ISM, but also present the first robust detection of the anti conformer of vinyl alcohol (a-H2C=CHOH) in space (see Sect. 3.3).
Vinyl alcohol is a structural isomer of acetaldehyde (CH3CHO) and therefore previous works have compared the abundance of both chemical species. Turner & Aponi (2001) showed that the column density of vinyl alcohol derived towards SgrB2(N) is similar to that measured for acetaldehyde. This is consistent with the results of Agúndez et al. (2021) towards TMC-1, where the abundance ratio s-H2C=CHOH/CH3CHO is ~1. In contrast, Martin-Drumel et al. (2019) did not detect vinyl alcohol in the EMoCA survey towards the high-mass star-forming region SgrB2(N2) (Belloche et al. 2016), with an abundance ratio s-H2C = CHOH/CH3CHO≤0.08.
Towards G+0.693, the measured abundance of CH3CHO is 3.7 × 10⁻⁹ (Sanz-Novo et al. 2022), while the total abundance of vinyl alcohol (considering both the syn and anti forms) is ~9 × 10⁻¹⁰. This implies that vinyl alcohol is less abundant by a factor of ~4 than CH3CHO towards the G+0.693 Galactic centre molecular cloud, with a H2C=CHOH-to-CH3CHO abundance ratio of 0.25 ± 0.02. This value lies between the abundance ratios found towards TMC-1 (of 1.0 ± 0.2; Agúndez et al. 2021) and SgrB2(N) (~1, although this value has large uncertainties; see Turner & Aponi 2001), and the ratio measured towards SgrB2(N2) (≤0.08; Martin-Drumel et al. 2019). The lack of detection of vinyl alcohol towards the SgrB2(N2) compact hot cores is consistent with the idea that the emission of vinyl alcohol arises mainly from the envelope of the SgrB2 molecular cloud. In Sect. 4.4 we discuss the possible chemical routes for the formation of vinyl alcohol.
4.4 Chemistry of Vinyl Alcohol in G+0.693
For vinyl alcohol, both gas-phase and grain-surface formation reactions have been proposed. For gas-phase formation, Agúndez et al. (2021) concluded that the most likely mechanism for the formation of this species is the dissociative recombination of CH3CHOH+, for which the CCO backbone is formed with a branching ratio of 23% (Hamberg et al. 2010). The subsequent hydrogenation of CCO could form vinyl alcohol together with acetaldehyde (Agúndez et al. 2021), although the branching ratios are unknown. We also note that the gas-phase reactions OH + C2H4 and OH + CH2CHCH3 could also yield vinyl alcohol, although they present activation barriers (Zhu et al. 2005; Zádor et al. 2009).
For grain-surface reactions, vinyl alcohol has been generated in interstellar ice analogues under proton irradiation of H2O/C2H2 ices (Hudson & Moore 2003) or electron irradiation of CO/CH4 and H2O/CH4 ices (Abplanalp et al. 2015; Bergantini et al. 2017). More recent experiments of non-energetic processing of ices also show that the co-deposition of C2H2 together with O2 and H atoms induces the formation of vinyl alcohol and acetaldehyde under low-temperature conditions (T = 10 K; see Chuang et al. 2020). Unfortunately, these works do not provide information about the branching ratios for the two species, and therefore it is not possible to assess which mechanism dominates the production of vinyl alcohol.
For the case of the Galactic centre molecular cloud G+0.693, multiple routes (both gas-phase and grain-surface) may indeed be at play since its chemistry is dominated by shocks and high cosmic-ray ionisation rates (see e.g. Zeng et al. 2018). The kinetic temperatures of the molecular gas towards this source (of 70-150 K; Zeng et al. 2018) could help overcome the activation barriers of the reactions OH + C2H4 and OH + CH2CHCH3 (see above; Zhu et al. 2005; Zádor et al. 2009). In addition, although the temperature of dust is low towards this cloud, the high-radiation field of secondary UV photons (induced by the high comic-rays ionisation rate measured in the Galactic centre, which is higher by factors 100–1000 than the standard value; see Goto et al. 2014) could process the ices, generating enough radicals that could react in situ on the surface, forming vinyl alcohol. A detailed chemical modelling of the G+0.693 source is needed to asses all these different formation mechanisms. We finally note that the isomerisation transformation of acetalde-hyde into vinyl alcohol is not possible (either in the gas phase or in water ices) due to the high relative energies between the two species and to the high activation energy barriers involved in this transformation (see Perrero et al. 2022).
4.5 Alcohols as Precursors of Lipids in Primitive Earth
Understanding the emergence of membranes is central to the problem of the origin of life. Membranes are indeed a key element since they enable the encapsulation and protection of the genetic information required for replication and of nutrients needed for metabolic processes (Ruiz-Mirazo et al. 2014). Current cell membranes are formed by a bilayer of phospholipids, that is, amphiphilic molecules that contain a polar head and a non-polar hydrophobic tail. Phospholipids, however, present a rather complex structure with an alcohol phosphate group (the polar hydrophilic head, where ethanolamine is one of the possible head groups; Rivilla et al. 2021a), a glycerol, and two hydrocarbon chains derived from fatty acids (the non-polar hydrophobic tails). Because of this complexity, it is thought that these structures likely appeared biosynthetically at a later stage as a result of the machinery of the individual cell (see Ruiz-Mirazo et al. 2014, and references therein).
Alternatively, simpler amphiphilic molecules have been proposed as prebiotic lipids such as fatty alcohols or even prenols, that is single-chain unsaturated alcohols that present double bonds (Ourisson et al. 1995). These amphiphilic compounds can assemble bi-layered supramolecular aggregates such as vesicles when they come in contact with water through the so-called hydrophobic effect4 and van der Waals interactions. The discovery in the ISM of n-propanol (a small chain primary alcohol) and of vinyl alcohol (a small alcohol with a double bond; see Sects. 3.1 and 3.3) thus opens the possibility that these molecules were sourced into a primitive Earth through the impact of meteorites and comets, possibly representing precursors of pre-biotic lipids such as fatty alcohols and prenols. The fact that alcohols up to pentanol have not only been detected in comets such as 67P/Churyumov-Gerasimenko (Altwegg et al. 2019), but also in carbonaceous chondrites such as the Murray and Orgueil meteorites (Jungclaus et al. 1976; Sephton 2002), supports the hypothesis of an exogenous delivery of precursors of prebiotic lipids into an early Earth.
5 Conclusions
We reported the discovery of n-propanol in the ISM with the detection of the two lowest-energy conformers, Ga-n-C3H7OH and Aa-n-C3H7OH. n-propanol was detected towards the Galactic centre GMC G+0.693, which is known to be one of the richest repository of complex organic molecules in our Galaxy. The derived abundance of n-propanol (considering both Gα and Aa conformers) is 6.6 × 10⁻¹⁰. By comparing this abundance with those of methanol and ethanol measured towards the same source, we find that the abundance of primary alcohols drops by approximately a factor of 10 by increasing complexity (i.e. by inserting a new CH2 group).
Finally, we also reported the detection of both syn and anti conformers of vinyl alcohol (H2C=CHOH) towards G+0.693. To our knowledge, this is the first time the latter conformer (anti) is firmly detected in the ISM. The derived abundance ratio between vinyl alcohol and acetaldehyde (its structural isomer) towards G+0.693 (of ~0.25), lies between those found toward TMC-1 and the SgrB2(N) molecular envelope (Turner & Aponi 2001; Agúndez et al. 2021), and the upper limit measured towards the SgrB2(N2) compact hot core (Martin-Drumel et al. 2019). The detection of these alcohols towards G+0.693 opens the possibility for precursors of prebiotic lipids to form in the ISM.
Acknowledgements
We would like to thank Carlos Briones for the fruitful discussions on possible prebiotic precursors of phospholipids and the formation of the first cell membranes. We also acknowledge the constructive and detailed report from an anonymous referee, who helped to improve the original version of the manuscript. Based on observations carried out with the IRAM 30m and Yebes 40m telescopes through projects 172-18 (PI: J. Martín-Pintado), 018-19 (PI: V. M. Rivilla) and 20A008 (PI: I. Jiménez-Serra). IRAM is supported by INSU/CNRS (France), MPG (Germany) and IGN (Spain). The 40 m radiotelescope at Yebes Observatory is operated by the Spanish Geographic Institute (IGN, Ministerio de Transportes, Movilidad y Agenda Urbana). I.J.-S. and J.M.-P. have received partial support from the Spanish State Research Agency (AEI) through project numbers PID2019-105552RB-C41 and MDM-2017-0737 Unidad de Excelencia “María de Maeztu” - Centro de Astrobiología (CSIC/INTA). L.F.R.-A. acknowledges support from a JAE-intro ICU studentship funded by the Spanish National Research Council (CSIC). L.F.R.-A., V.M.R. and L.C. also acknowledge support from the Comunidad de Madrid through the Atracción de Talento Investigador Modalidad 1 (Doctores con experiencia) Grant (COOL: Cosmic Origins Of Life; 2019-T1/TIC15379; PI: V.M.Rivilla). P.d.V. and B.T. thank the support from the European Research Council through Synergy Grant ERC-2013-SyG, G.A. 610256 (NANOCOSMOS) and from the Spanish Ministerio de Ciencia e Innovación (MICIU) through project PID2019-107115GB-C21. B.T. also acknowledges the Spanish MICIU for funding support from grant PID2019-106235GB-I00.
Appendix A Rotational Diagrams
In this section, we show the rotational diagrams obtained forGa-n-C3H7OH, Aa-n-C3H7OH, s-H2C=CHOH, and a-H2C=CHOH (see Figures A.1, A.2, A.3, and A.4), which have been detected towards G+0.693. The goal is to establish the reliability of the excitation temperatures (Tex) and column densities (N) derived by MADCUBA (see Sections 3.1 and 3.3). For these diagrams, we used all molecular transitions reported in Tables 1 and 3, except for Aa-n-C3H7OH, for which we did not consider the 92,8→91,9 and 101,10→90,9 transitions, which appear blended with U species.
The results of the rotational diagrams are Tex=16.9±3.1K and N=6.6±2.3×1013 cm−2 for Ga-n-C3H7OH, Tex=14.0±3.4K and N=5.1±2.2×1013 cm−2 for Aa-n-C3H7OH, Tex=8.715±0.008 K and N=1.5±0.3×1014 cm−2 for s-H2C=CHOH, and Tex=17.0±2.4K and N=1.5±0.4×1013 cm−2 for a-H2C=CHOH. These values are consistent with those obtained by MADCUBA.
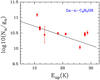 |
Fig. A.1 Rotational diagram obtained by using the rotational transitions of Ga-n-C3H7OH reported in Table 1. The derived parameters are Tex=16.9±3.1 K and N=6.6±2.3×1013 cm−2. |
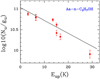 |
Fig. A.2 Rotational diagram obtained by using the rotational transitions of Aa-n-C3H7OH reported in Table 1, except the 92,8→ 91,9 and 101,10→90,9 lines that are blended with U species. The derived parameters areTex=14.0±3.4 K and N=5.1±2.2×1013 cm−2. |
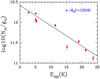 |
Fig. A.3 Rotational diagram obtained by using the rotational transitions of s-H2C=CHOH reported in Table 3. The derived parameters are Tex=8.715±0.008 K and N=1.5±0.3×1014 cm−2. |
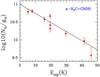 |
Fig. A.4 Rotational diagram obtained by using the rotational transitions of a-H2C=CHOH reported in Table 3. The derived parameters are Tex=17.0±2.4 K and N=1.5±0.4×1013 cm−2. |
References
- Abplanalp, M. J., Borsuk, A., Jones, B. M., & Kaiser, R. I. 2015, ApJ, 814, 45 [Google Scholar]
- Agúndez, M., Marcelino, N., Tercero, B., et al. 2021, A&A, 649, L4 [NASA ADS] [CrossRef] [EDP Sciences] [Google Scholar]
- Altwegg, K., Balsiger, H., & Fuselier, S. A. 2019, ARA&A, 57, 113 [NASA ADS] [CrossRef] [Google Scholar]
- Bakri, B., Demaison, J., Margulés, L., & Møllendal, H. 2001, J. Mol. Spectr., 208, 92 [NASA ADS] [CrossRef] [Google Scholar]
- Bar-On, Y. M., Phillips, R., & Milo, R. 2018, PNAS, 115, 6506 [NASA ADS] [CrossRef] [Google Scholar]
- Becker, S., Feldmann, J., Wiedemann, S., et al. 2019, Science, 366, 76B [NASA ADS] [CrossRef] [Google Scholar]
- Belloche, A., Müller, H. S. P., Garrod, R. T., & Menten, K. M. 2016, A&A, 587, A91 [NASA ADS] [CrossRef] [EDP Sciences] [Google Scholar]
- Belloche, A., Garrod, R. T., Müller, H. S. P., et al. 2019, A&A, 628, A10 [NASA ADS] [CrossRef] [EDP Sciences] [Google Scholar]
- Bergantini, A., Maksyutenko, P., & Kaiser, R. I. 2017, ApJ, 841, 96 [Google Scholar]
- Bernstein, M. P., Sandford, S. A., Allamandola, L. J., et al. 1999, Science, 283, 1135 [NASA ADS] [CrossRef] [Google Scholar]
- Blom, C. E., & Bauder A. 1981, Chem. Phys. Lett., 82, 492 [NASA ADS] [CrossRef] [Google Scholar]
- Charnley, S. B., Kress, M. E., Tielens, A. G. G. M., & Millar, T. J. 1995, ApJ, 448, 232 [Google Scholar]
- Chuang, K.-J., Fedoseev, G., Qasim, D., et al. 2020, A&A, 635, A199 [EDP Sciences] [Google Scholar]
- Chyba, C., & Sagan, C. 1992, Nature, 355, 125 [NASA ADS] [CrossRef] [Google Scholar]
- Davis, R. W., & Gerry, M. C. L. 1976, J. Mol. Spectr., 59, 407 [NASA ADS] [CrossRef] [Google Scholar]
- Deamer, D. W. 1985, Nature, 317, 792 [NASA ADS] [CrossRef] [Google Scholar]
- Deamer, D. W., Mahon, E. H., & Bosco, G. 1994, In Early Life on Earth, Nobel Symposium, ed. Bengtson, S. (New York: Columbia University Press), 84 [Google Scholar]
- Dreizler, H., & Scappini, F. 1981, Z. Nat. A., 36, 1187 [NASA ADS] [Google Scholar]
- Endres C. P., Schlemmer S., Schilke P., et al. 2016, J. Mol. Spectr., 327, 95 [NASA ADS] [CrossRef] [Google Scholar]
- Fuchs, U., Winnewisser, G., Groner, P., De Lucia, Frank C., & Herbst, E. 2003, ApJS, 144, 277 [NASA ADS] [CrossRef] [Google Scholar]
- Garay, G., & Lizano, S. 1999, PASP, 111, 1049 [NASA ADS] [CrossRef] [Google Scholar]
- García de la Concepcion, J., Jiménez-Serra, I., Carlos Corchado, J., Rivilla, V. M., & Martín-Pintado, J. 2021, ApJ, 912, L6 [CrossRef] [Google Scholar]
- García de la Concepción, J., Colzi, L., Jiménez-Serra, I., et al. 2022, A&A, 658, A150 [NASA ADS] [CrossRef] [EDP Sciences] [Google Scholar]
- Goto, M., Geballe, T. R., Indriolo, Nick, et al. 2014, ApJ, 786, 96 [CrossRef] [Google Scholar]
- Hamberg, M., Zhaunerchyk, V., Vigren, E., et al. 2010, A&A, 522, A90 [EDP Sciences] [Google Scholar]
- Hudson, R. L., & Moore, M. H. 2003, ApJ, 586, L107 [Google Scholar]
- Ilyushin, V. V., Endres, C. P., Lewen, F., Schlemmer, S., & Drouin, B. J. 2013, J. Mol. Spectr., 290, 31 [NASA ADS] [CrossRef] [Google Scholar]
- Jaman, A. I., Chakraborty, S., & Chakraborty, R. 2015, J. Mol. Struc., 1079, 402 [NASA ADS] [CrossRef] [Google Scholar]
- Jiménez-Serra, I., Caselli, P., Martín-Pintado, J., & Hartquist, T. W. 2008, A&A, 482, 549 [NASA ADS] [CrossRef] [EDP Sciences] [Google Scholar]
- Jiménez-Serra, I., Martín-Pintado, J., Rivilla, V. M., et al. 2020, Astro. Biol., 20, 1048 [Google Scholar]
- Jørgensen, J. K., Belloche, A., & Garrod, R. T. 2020, ARA&A, 58, 727 [Google Scholar]
- Jungclaus, G. A., Yuen, G. U., Moore, C. B., & Lawless, J. G. 1976, Meteoritics, 11, 231 [NASA ADS] [CrossRef] [Google Scholar]
- Kawashima, Y., Tanaka, Y., Uzuyama, T., & Hirota, E. 2021, J. Phys. Chem. A, 125, 1166 [NASA ADS] [CrossRef] [Google Scholar]
- Kisiel, Z., Dorosh, O., Maeda, A., et al. 2010, Phys. Chem. Chem. Phys., 12, 8329 [NASA ADS] [CrossRef] [Google Scholar]
- Macdonald, J. N., Norbury, D., & Sheridan, J. 1978, J. Chem. Soc., Faraday Trans. 2, 74, 1365 [CrossRef] [Google Scholar]
- Maeda, A., Medvedev, I. R., De Lucia, F. C., & Herbst, E. 2006, ApJS, 166, 650 [NASA ADS] [CrossRef] [Google Scholar]
- Manigand, S., Coutens, A., Loison, J.-C., et al. 2021, A&A, 645, A53 [EDP Sciences] [Google Scholar]
- Margulès, L., Ilyushin, V. V., McGuire, B. A., et al. 2020, J. Mol. Spectr., 371, 111304 [CrossRef] [Google Scholar]
- Marstokk, K. M., & Møllendal, H. 1973, J. Mol. Struct., 15, 137 [NASA ADS] [CrossRef] [Google Scholar]
- Martín, S., Mangum, J. G., Harada, N., et al. 2021, A&A, 656, A46 [NASA ADS] [CrossRef] [EDP Sciences] [Google Scholar]
- Martín, S., Requena-Torres M. A., Martín-Pintado, J., et al. 2008, ApJ, 678, 245 [CrossRef] [Google Scholar]
- Martín, S., Martín-Pintado, J., Blanco-Sánchez, C., et al. 2019, A&A, 631, A159 [Google Scholar]
- Martin-Drumel, M.-A., Lee, K. L. K., Belloche, A., et al. 2019, A&A, 623, A167 [NASA ADS] [CrossRef] [EDP Sciences] [Google Scholar]
- McCollom, T. M., Ritter, G., & Simoneit, B. R. T. 1999, Origins Life Evol. Biosph., 29, 153 [NASA ADS] [CrossRef] [Google Scholar]
- Melosso, M., McGuire, B. A., Tamassia, F., Degli Esposti, C., & Dore, L. 2019, ACS Earth Space Chem., 3, 1189 [Google Scholar]
- Müller, H. S. P., Belloche, A., Xu, L.-H., et al. 2016, A&A, 587, A92 [NASA ADS] [CrossRef] [EDP Sciences] [Google Scholar]
- Nooner, D. W., Gibert, J. M., Gelpi, E., & Oró, J. 1976, Geochim. Cosmochim. Acta, 40, 915 [NASA ADS] [CrossRef] [Google Scholar]
- Ourisson, G., & Nakatani, 1995, Y. Chem. Biol., 2, 631 [CrossRef] [Google Scholar]
- Perrero, J., Enrique-Romero, J., Martínez Bachs, B., et al. 2022, ACS Earth Space Chem., 6, 496 [NASA ADS] [CrossRef] [Google Scholar]
- Pszczółkowski, L. Białkowska-Jaworska, E., & Kisiel, Z. 2005, J. Mol. Spectr., 234, 106 [CrossRef] [Google Scholar]
- Qasim, D., Fedoseev, G., Chuang, K.-J., et al. 2019a, A&A, 627, A1 [NASA ADS] [CrossRef] [EDP Sciences] [Google Scholar]
- Qasim, D., Fedoseev, G., Lamberts, T., et al. 2019b, ACS Earth Space Chem., 3, 986 [NASA ADS] [CrossRef] [Google Scholar]
- Requena-Torres M. A., Martín-Pintado J., Rodríguez-Fernández N. J., et al. 2006, A&A, 455, 971 [NASA ADS] [CrossRef] [EDP Sciences] [Google Scholar]
- Requena-Torres M. A., Martín-Pintado J., Martín S., et al. 2008, ApJ, 672, 352 [NASA ADS] [CrossRef] [Google Scholar]
- Rivilla, V. M., Martín-Pintado, J., Jiménez-Serra, I., et al. 2019, MNRAS, 483, L114 [NASA ADS] [CrossRef] [Google Scholar]
- Rivilla, V. M., Martín-Pintado, J., Jiménez-Serra, I., et al. 2020, ApJ, 899, L28 [Google Scholar]
- Rivilla, V. M., Jiménez-Serra, I., Martín-Pintado, J., et al. 2021a, PNAS, 11801314R [Google Scholar]
- Rivilla, V. M., Jiménez-Serra, I., García de la Concepción, J., et al. 2021b, MNRAS, 506L, 79R [Google Scholar]
- Rivilla, V. M., García de la Concepción, J., Jiménez-Serra, I., et al. 2022, Frontiers in Astronomy and Space Sciences, 9, 829288 [NASA ADS] [CrossRef] [Google Scholar]
- Rodler, 1985, J. Mol. Spectr., 114, 23 [Google Scholar]
- Rodríguez-Almeida, L., Jiménez-Serra, I., Rivilla, V. M., et al. 2021a, ApJ, 912, L11 [CrossRef] [Google Scholar]
- Rodríguez-Almeida, L., Rivilla, V. M., Jimenez-Serra, I., et al. 2021b, A&A, 654, L1 [NASA ADS] [CrossRef] [EDP Sciences] [Google Scholar]
- Rodríguez-Fernández, N. J., Martín-Pintado, J., de Vicente, P., et al. 2000, A&A, 356, 695 [NASA ADS] [Google Scholar]
- Ruiz-Mirazo, K., Briones, C., & de la Escosura, A. 2014, Chem. Rev., 114, 285 [CrossRef] [Google Scholar]
- Sanz-Novo, M., Belloche, A., Rivilla, V. M., et al. 2022, A&A, in press, 10.1051/0004-6361/202142848 [Google Scholar]
- Sephton, M. A. 2002, Nat. Prod. Rep., 19, 292 [CrossRef] [Google Scholar]
- Tercero, B., Cernicharo, J., López, A., et al. 2015, A&A, 582, L1 [NASA ADS] [CrossRef] [EDP Sciences] [Google Scholar]
- Tercero, F., López-Pérez, J. A., Gallego, J. D., et al. 2021, A&A, 645, A37 [EDP Sciences] [Google Scholar]
- Turner, B. E., & Apponi, A. J. 2001, ApJ, 561, L207 [Google Scholar]
- Zádor, J., Jasper, A. W., & Miller, J. A. 2009, Phys. Chem. Chem. Phys., 11, 11040 [Google Scholar]
- Zeng, S., Jiménez-Serra, I., Rivilla, V. M., et al. 2018, MNRAS, 478, 2962 [Google Scholar]
- Zeng, S., Zhang, Q., Jiménez-Serra, I., et al. 2020, MNRAS, 497, 4896 [NASA ADS] [CrossRef] [Google Scholar]
- Zhu, R. S., Park, J., & Lin, M. C. 2005, Chem. Phys. Lett., 408, 25 [Google Scholar]
Note that the total amount of organic matter in the present biosphere is about 6 × 10¹⁴ kg (Bar-On et al. 2018).
MADCUBA, or MAdrid Data CUBe Analysis, is a software developed at the Center of Astrobiology in Madrid: https://cab.inta-csic.es/madcuba/index.html
The abundances shown in Table 4 of Requena-Torres et al. (2008) were obtained assuming a H2 column density of 4.1 × 1022 cm−2. Therefore, these abundances were corrected for the H2 column density assumed in this work of 1.35 × 1023 cm−2 inferred from C18O data by Martín et al. (2008).
The hydrophobic effect is the observed trend for non-polar substances to aggregate and exclude water molecules in an aqueous solution.
All Tables
Unblended or slightly blended transitions of Ga-n-C3H7OH and Aa-n-C3H7OH detected towards G+0.693.
Upper limits obtained for the Gg and Gg′ conformers of n-propanol for the anti and gauche conformers of i-propanol, and for the trans conformer of ethyl methyl ether.
Selected lines of the two forms of vinyl alcohol (H2C=CHOH), syn (s) and anti (a) detected towards G+0.693.
Derived upper limits to the column densities and abundances of other alcohols observed towards G+0.693.
All Figures
|
Fig. 1 Conformers of n-propanol (n-C3H7OH) represented as a function of relative energy. The two lowest-energy conformers are the Ga and Aa conform-ers, which have been detected towards G+0.693 (see Sect. 3.1). The x-axis is not to scale for visualisation purposes. The relative energies of the different conformers of n-propanol are E = 0 K for Ga, E = 40.3 K for Aa, E = 64.7 K for Ag, E = 68.8 K for Gg, and E = 73.2 K for Gg′ (see also Sect. 3.1). |
| In the text | |
|
Fig. 2 Unblended and slightly blended transitions of Ga-n-C3H7OH detected towards G+0.693. The histogram and grey shaded area correspond to the observed IRAM 30 m and Yebes 40 m spectra. Red lines indicate the best LTE fit to the lines of Ga-n-C3H7OH reported in Table 1. Blue lines show the overall fit to the observed spectra considering all molecular species detected in G+0.693. The quantum numbers of the Ga-n-C3H7OH transitions are indicated in red at the bottom of the panels, while blue labels present the species identified in the shown spectra. The frequencies of the lines are shown in the upper part of each panel. The red asterisks indicate the transitions that provide the identification of Ga-n-C3H7OH. Dotted black lines indicate the 3 × rms level in intensity in the spectra. Dotted red lines show the detectability limit in the integrated area defined as |
| In the text | |
|
Fig. 3 Unblended and slightly blended transitions of Aa-n-C3H7OH detected towards G+0.693. The histogram, grey shaded area, colour lines, and labels are as in Fig. 2. Red lines indicate the best LTE fit to the lines of Aa-n-C3H7OH reported in Table 1. The frequencies of the lines are shown in the upper part of each panel, while the red asterisks indicate the transitions that contribute to the identification of Aa-n-C3H7OH. Dotted black lines indicate the 3 × rms level in intensity in the spectra. Dotted red lines show the detectability limit in the integrated area defined as |
| In the text | |
|
Fig. 4 Unblended and slightly blended transitions of s-H2C=CHOH detected towards G+0.693. For a description of the colours displayed in the plot, see Fig. 2. The spectroscopic information and the derived parameters from the best LTE fit of these lines are reported in Table 3. The frequencies of the lines are shown in the upper part of each panel, while the red asterisks indicate the transitions that contribute to the identification of s-H2C=CHOH. Dotted black lines indicate the 3 × rms level in intensity in the spectra. Dotted red lines show the detectability limit in integrated area defined as |
| In the text | |
|
Fig. 5 Unblended and slightly blended transitions of a-H2C=CHOH detected towards G+0.693. For a description of the colours displayed in the plot, see Fig. 2. The spectroscopic information and the derived parameters from the best LTE fit of these lines are reported in Table 3. The frequencies of the lines are shown in the upper part of each panel. Red asterisks indicate the transitions that contribute to the identification of a-H2C=CHOH. Dotted black lines indicate the 3 × rms level in intensity in the spectra. Dotted red lines show the detectability limit in integrated area defined as |
| In the text | |
|
Fig. 6 Comparison of the molecular abundances of the primary alcohols methanol, ethanol, n-propanol, and n-butanol measured towards the giant molecular cloud G+0.693 (red squares) with the values predicted by the models of Charnley et al. (1995, blue triangles) for the case with initial solid abundances of 10−6, 10−7 , and 10−8 for C2H5OH, propanol, and butanol, respectively. Error bars are also shown in red for the measured abundances, and the downward red arrow indicates an upper limit. |
| In the text | |
|
Fig. A.1 Rotational diagram obtained by using the rotational transitions of Ga-n-C3H7OH reported in Table 1. The derived parameters are Tex=16.9±3.1 K and N=6.6±2.3×1013 cm−2. |
| In the text | |
|
Fig. A.2 Rotational diagram obtained by using the rotational transitions of Aa-n-C3H7OH reported in Table 1, except the 92,8→ 91,9 and 101,10→90,9 lines that are blended with U species. The derived parameters areTex=14.0±3.4 K and N=5.1±2.2×1013 cm−2. |
| In the text | |
|
Fig. A.3 Rotational diagram obtained by using the rotational transitions of s-H2C=CHOH reported in Table 3. The derived parameters are Tex=8.715±0.008 K and N=1.5±0.3×1014 cm−2. |
| In the text | |
|
Fig. A.4 Rotational diagram obtained by using the rotational transitions of a-H2C=CHOH reported in Table 3. The derived parameters are Tex=17.0±2.4 K and N=1.5±0.4×1013 cm−2. |
| In the text | |
Current usage metrics show cumulative count of Article Views (full-text article views including HTML views, PDF and ePub downloads, according to the available data) and Abstracts Views on Vision4Press platform.
Data correspond to usage on the plateform after 2015. The current usage metrics is available 48-96 hours after online publication and is updated daily on week days.
Initial download of the metrics may take a while.