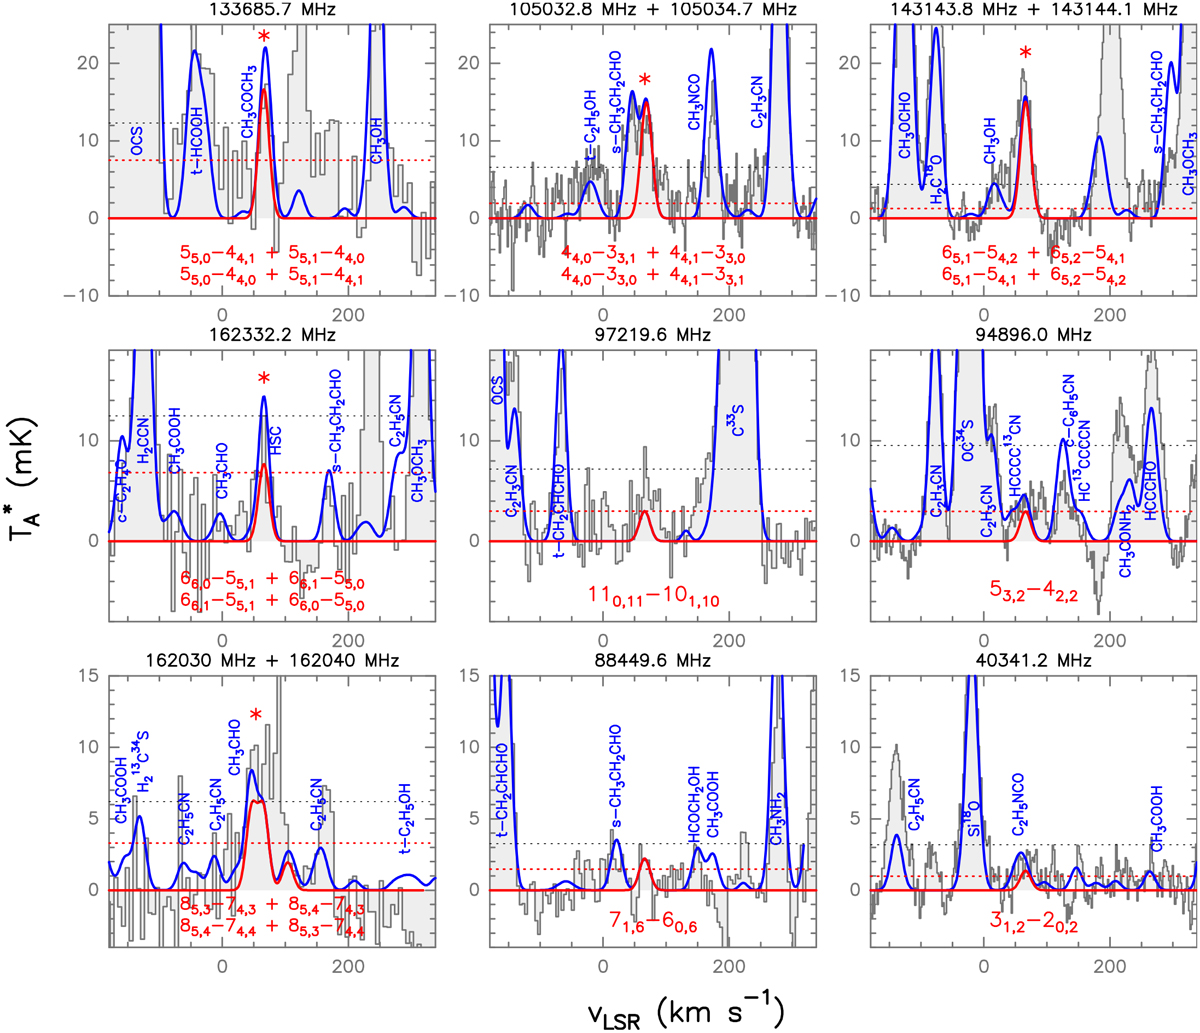
Fig. 2
Download original image
Unblended and slightly blended transitions of Ga-n-C3H7OH detected towards G+0.693. The histogram and grey shaded area correspond to the observed IRAM 30 m and Yebes 40 m spectra. Red lines indicate the best LTE fit to the lines of Ga-n-C3H7OH reported in Table 1. Blue lines show the overall fit to the observed spectra considering all molecular species detected in G+0.693. The quantum numbers of the Ga-n-C3H7OH transitions are indicated in red at the bottom of the panels, while blue labels present the species identified in the shown spectra. The frequencies of the lines are shown in the upper part of each panel. The red asterisks indicate the transitions that provide the identification of Ga-n-C3H7OH. Dotted black lines indicate the 3 × rms level in intensity in the spectra. Dotted red lines show the detectability limit in the integrated area defined as ![]() ,with N the number of channels across the line width.
,with N the number of channels across the line width.
Current usage metrics show cumulative count of Article Views (full-text article views including HTML views, PDF and ePub downloads, according to the available data) and Abstracts Views on Vision4Press platform.
Data correspond to usage on the plateform after 2015. The current usage metrics is available 48-96 hours after online publication and is updated daily on week days.
Initial download of the metrics may take a while.