Fig. 6
Download original image
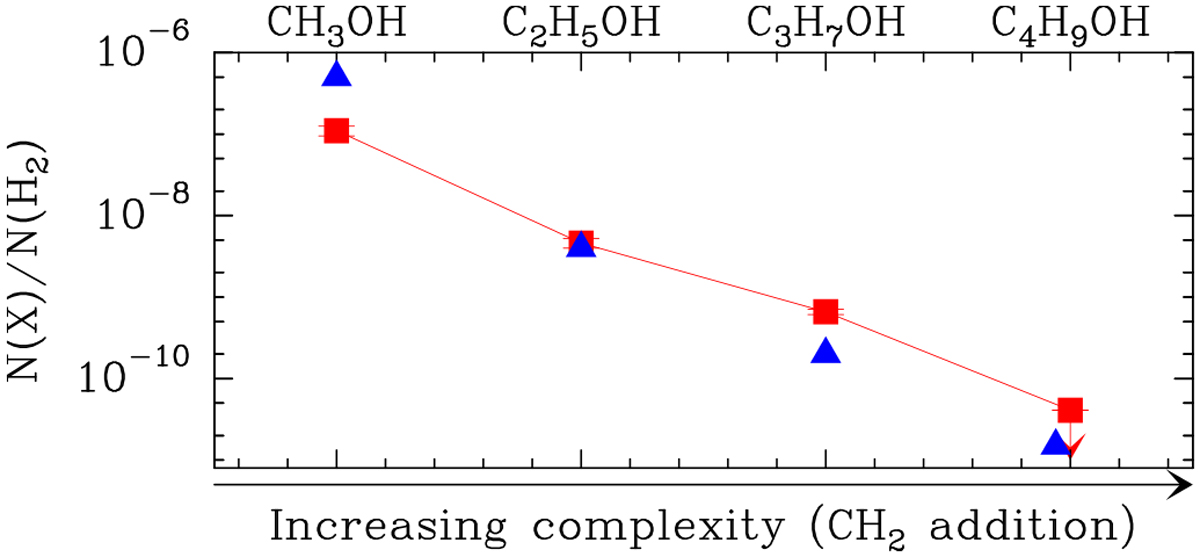
Comparison of the molecular abundances of the primary alcohols methanol, ethanol, n-propanol, and n-butanol measured towards the giant molecular cloud G+0.693 (red squares) with the values predicted by the models of Charnley et al. (1995, blue triangles) for the case with initial solid abundances of 10−6, 10−7 , and 10−8 for C2H5OH, propanol, and butanol, respectively. Error bars are also shown in red for the measured abundances, and the downward red arrow indicates an upper limit.
Current usage metrics show cumulative count of Article Views (full-text article views including HTML views, PDF and ePub downloads, according to the available data) and Abstracts Views on Vision4Press platform.
Data correspond to usage on the plateform after 2015. The current usage metrics is available 48-96 hours after online publication and is updated daily on week days.
Initial download of the metrics may take a while.