Fig. 4
Download original image
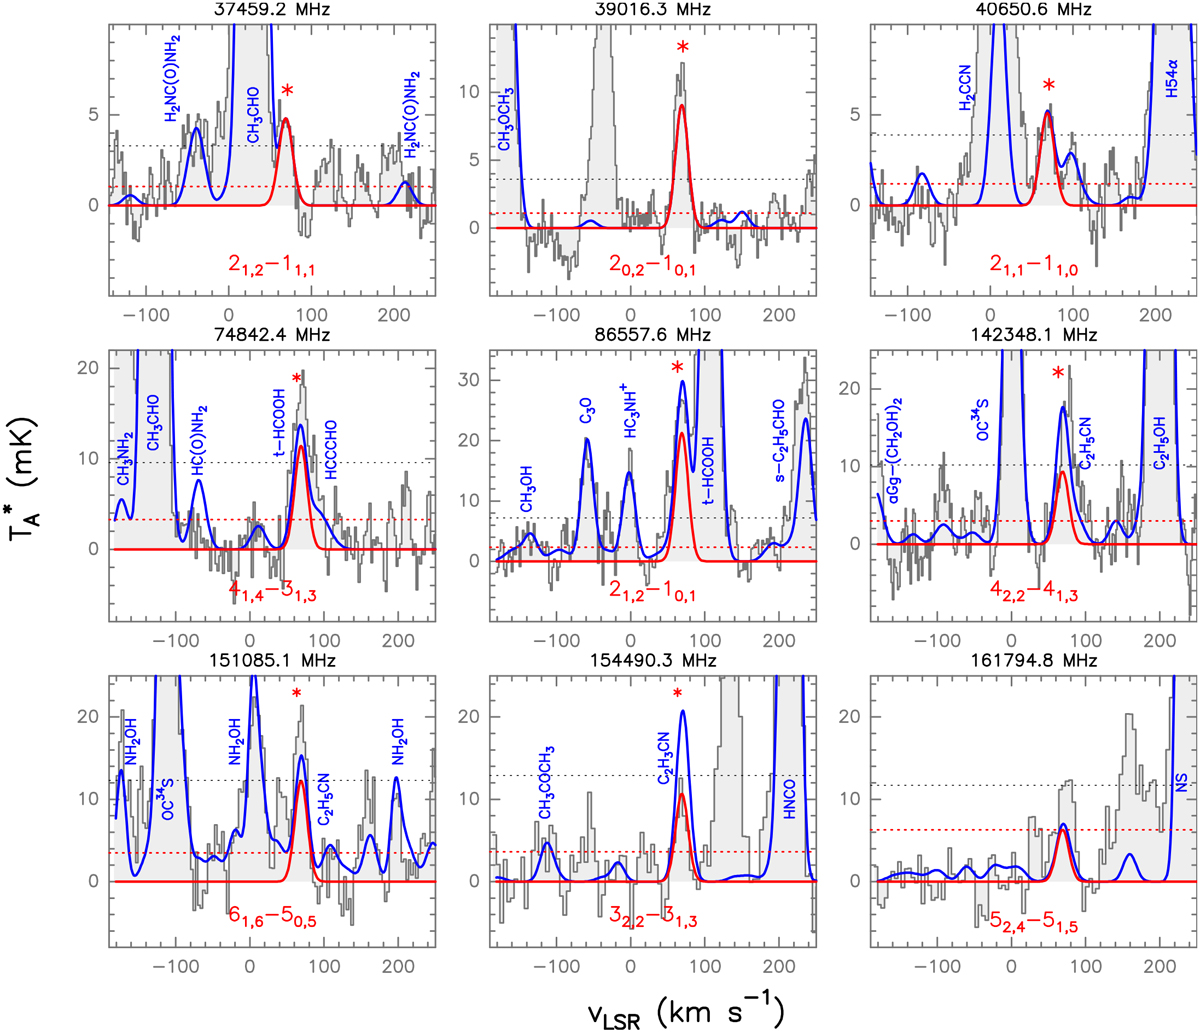
Unblended and slightly blended transitions of s-H2C=CHOH detected towards G+0.693. For a description of the colours displayed in the plot, see Fig. 2. The spectroscopic information and the derived parameters from the best LTE fit of these lines are reported in Table 3. The frequencies of the lines are shown in the upper part of each panel, while the red asterisks indicate the transitions that contribute to the identification of s-H2C=CHOH. Dotted black lines indicate the 3 × rms level in intensity in the spectra. Dotted red lines show the detectability limit in integrated area defined as ![]() , with N the number of channels across the linewidth.
, with N the number of channels across the linewidth.
Current usage metrics show cumulative count of Article Views (full-text article views including HTML views, PDF and ePub downloads, according to the available data) and Abstracts Views on Vision4Press platform.
Data correspond to usage on the plateform after 2015. The current usage metrics is available 48-96 hours after online publication and is updated daily on week days.
Initial download of the metrics may take a while.