Open Access
Fig. 5
Download original image
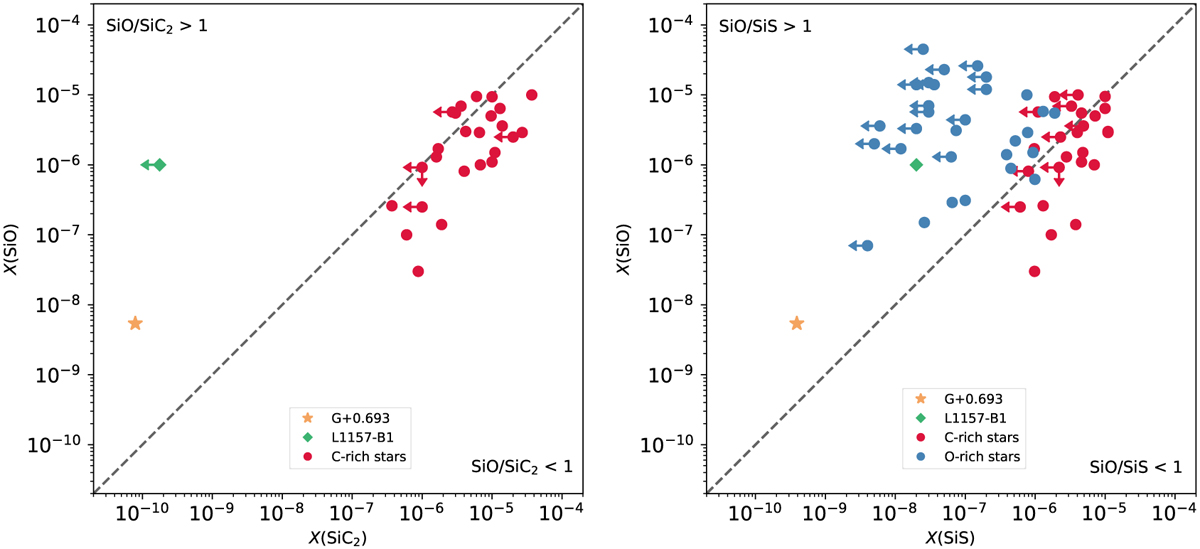
Comparison of abundances between different pairs of molecules. The plots show the derived fractional abundances relative to H2 of SiO vs. SiC2 (left panel), and SiO vs. SiS (right panel). The sources with nondetections are denoted with arrows. The dashed line represents equal abundances of molecules.
Current usage metrics show cumulative count of Article Views (full-text article views including HTML views, PDF and ePub downloads, according to the available data) and Abstracts Views on Vision4Press platform.
Data correspond to usage on the plateform after 2015. The current usage metrics is available 48-96 hours after online publication and is updated daily on week days.
Initial download of the metrics may take a while.