Fig. 1
Download original image
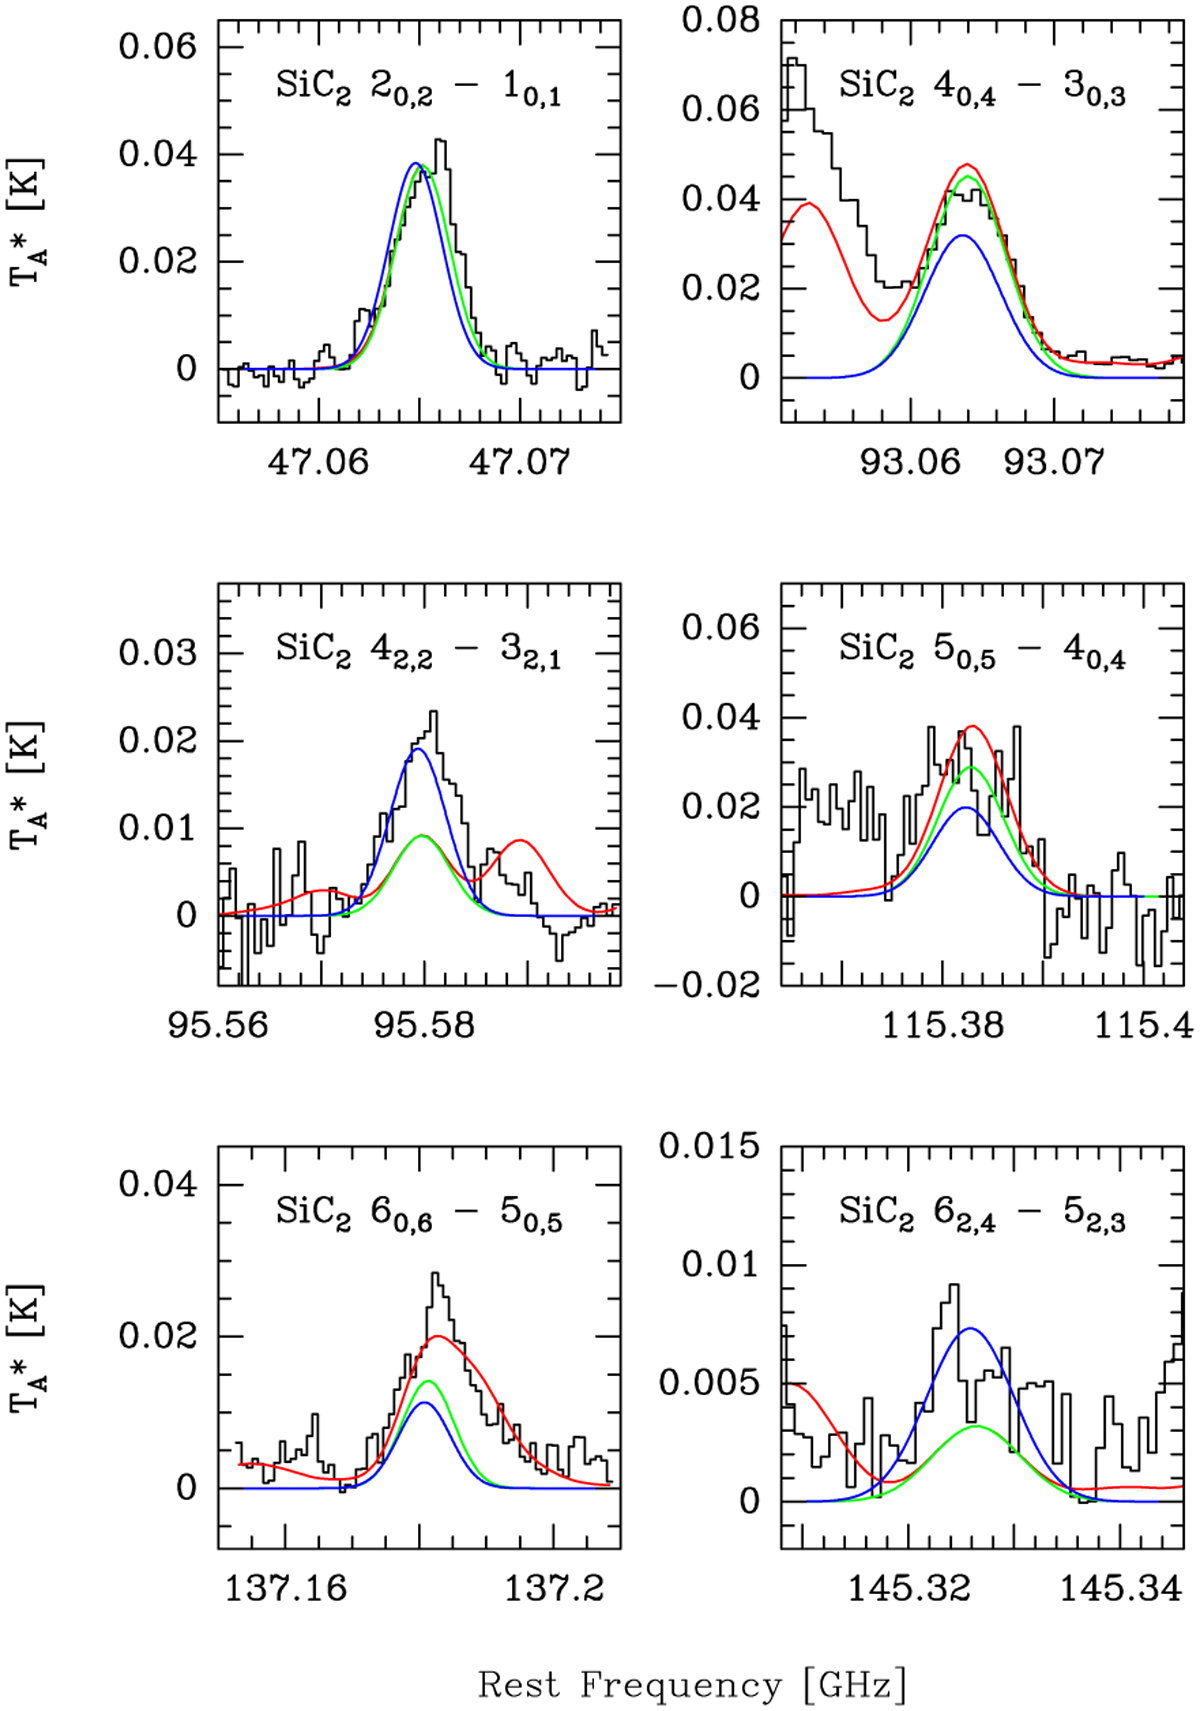
Observed spectra of SiC2 toward G + 0.693 (black histogram). The green lines correspond to the synthetic spectra calculated assuming LTE. The red lines show the synthetic spectra that account for the emission of all the molecules identified toward G + 0.693, including SiC2. The blue lines correspond to the line profiles calculated using Radex.
Current usage metrics show cumulative count of Article Views (full-text article views including HTML views, PDF and ePub downloads, according to the available data) and Abstracts Views on Vision4Press platform.
Data correspond to usage on the plateform after 2015. The current usage metrics is available 48-96 hours after online publication and is updated daily on week days.
Initial download of the metrics may take a while.