Fig. 4
Download original image
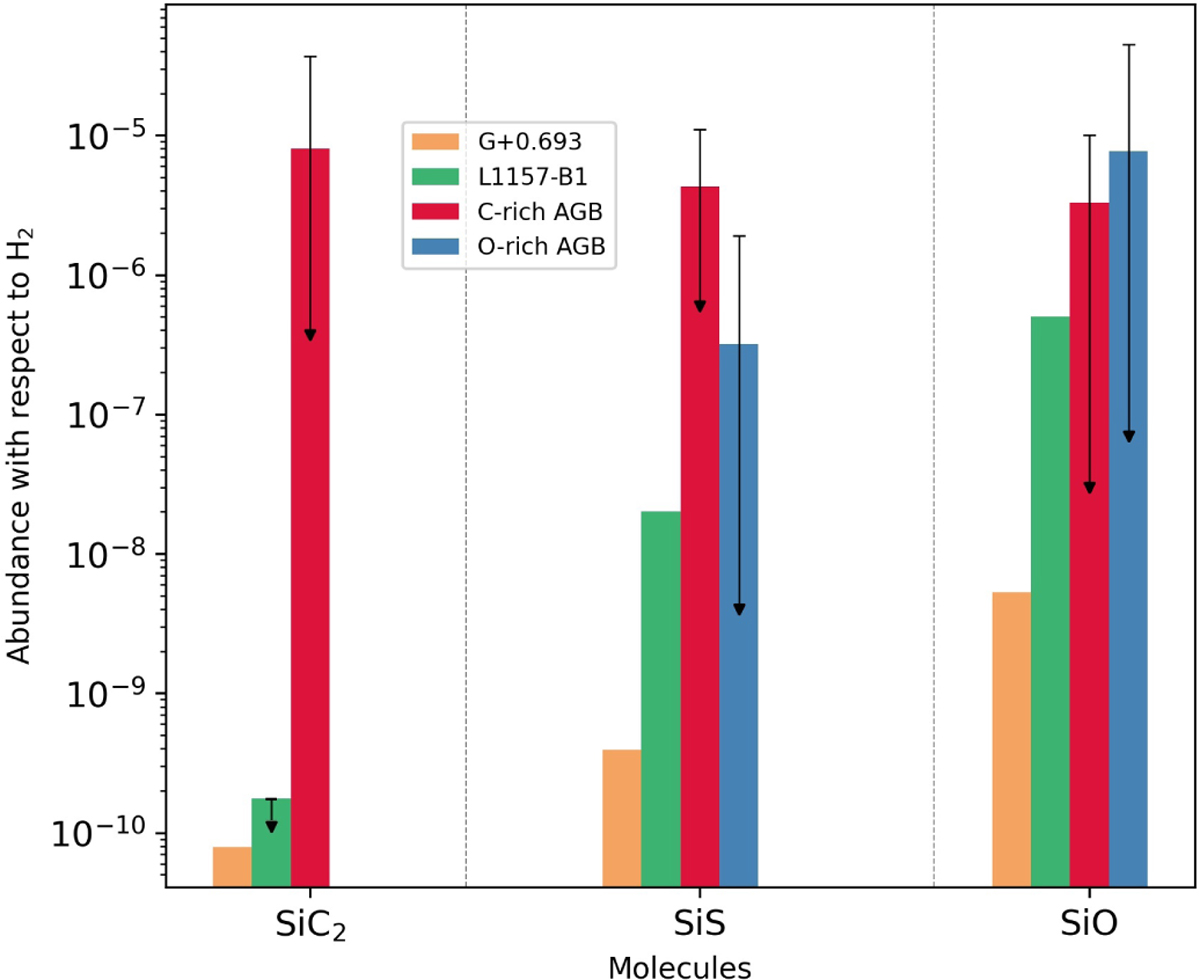
Bar plot comparing the fractional abundance of SiC2, SiS, and SiO relative to H2 in different environments. For G + 0.693, the abundances are obtained from this work. For L1157-B1, the SiO and SiS abundances are taken from Podio et al. (2017), while the upper limit on the SiC2 abundance is derived in this work using the ASAI survey (Lefloch et al. 2018). The abundances of the carbon-rich AGB stars and oxygen-rich AGB stars are from Massalkhi et al. (2018, 2019) and Massalkhi et al. (2020), respectively. For the AGB stars, the height of the bar corresponds to the average fractional abundance derived in the studied samples, while the error bar refers to the wide range of values found. Downward-pointing arrows represent upper limits to the abundance.
Current usage metrics show cumulative count of Article Views (full-text article views including HTML views, PDF and ePub downloads, according to the available data) and Abstracts Views on Vision4Press platform.
Data correspond to usage on the plateform after 2015. The current usage metrics is available 48-96 hours after online publication and is updated daily on week days.
Initial download of the metrics may take a while.