| Issue |
A&A
Volume 678, October 2023
|
|
|---|---|---|
| Article Number | A36 | |
| Number of page(s) | 6 | |
| Section | The Sun and the Heliosphere | |
| DOI | https://doi.org/10.1051/0004-6361/202346735 | |
| Published online | 29 September 2023 | |
Transient dark ribbons at the outer boundaries of sunspot superpenumbrae in the chromosphere
School of Physics and Optoelectronics Engineering, Anhui University, Hefei 230601, PR China
e-mail: This email address is being protected from spambots. You need JavaScript enabled to view it.
Received:
25
April
2023
Accepted:
24
July
2023
Abstract
Context. Although the flow of material in sunspot superpenumbrae has been studied intensively, detailed observations about the evolution of material flow at the outer boundaries of sunspot superpenumbrae are rare.
Aims. We study the evolution of the flow of material at the outer boundaries of superpenumbrae.
Methods. Based on Hα observations from the New Vacuum Solar Telescope, we tracked the evolution of the flow of material at the outer boundaries of superpenumbrae in the chromosphere. Data from the Solar Dynamics Observatory Helioseismic Magnetic Imager were employed to examine the photospheric magnetic field environment relevant to the material flow.
Results. We observed transient dark ribbons (TDRs) at the outer boundary of a sunspot superpenumbra in the chromosphere on 2018 May 12. The TDRs are located in the middle of the sunspot and a flocculus, and both of them have negative magnetic fields. While the ratio of the length and width of a TDR is greater than 8, we tracked the TDR from its formation to disappearance, so that six TDRs were studied in detail. Five TDRs were formed by the connection of several small dark sticks from end to end, and the sixth TDR was formed by the merging of two thin sticks. In the later stage of the TDR evolution, five TDRs were broken down into several small dark sticks, and the sixth TDR dissipated with oscillation. During the evolution process, no obvious flow of material along the TDRs is detected.
Conclusions. We suggest that these TDRs are an observational representation of the regular aggregation of superpenumbral fibril footpoints and adjacent solar flocculus fibril footpoints at the outer boundaries of the sunspot superpenumbrae.
Key words: Sun: chromosphere / sunspots
© The Authors 2023
 Open Access article, published by EDP Sciences, under the terms of the Creative Commons Attribution License (https://creativecommons.org/licenses/by/4.0), which permits unrestricted use, distribution, and reproduction in any medium, provided the original work is properly cited.
This article is published in open access under the Subscribe to Open model. This email address is being protected from spambots. You need JavaScript enabled to view it. to support open access publication.
1. Introduction
Sunspots are the dark feature on the surface of the sun. They represent the core of the solar active region, where the solar magnetic field is concentrated. A typical sunspot is comprised of an umbra and a penumbra (Sobotka 1997; Solanki 2003). In recent years, significant progress has been made in the study of the fine structures of sunspot umbrae and penumbrae. Umbral dots and light bridges are commonly present in sunspot umbrae. These bright structures are observed within dark umbrae and characterized as enhancements in brightness (Schüssler & Vögler 2006; Kitai et al. 2007). Penumbrae, on the other hand, are comprised of many bright and dark filaments (Joshi 2014; Sobotka & Puschmann 2022). Some research has revealed that bright penumbral filaments are made up of penumbra grains (Schlichenmaier et al. 1998).
The most prominent dynamic phenomenon in sunspots is the Evershed flow, which is a horizontal outflow in the penumbra. It originates from penumbral grains and terminates primarily at the outer boundary of the penumbra (Beck & Choudhary 2020). There is an annular region around the periphery of a sunspot that is like a moat or moat cell (Sheeley 1969). The presence of moats indicates that energy is stored locally and is not transmitted to great distances (Nye et al. 1988). The systematic behavior of large-scale outflows surrounding sunspots is referred to as moat flows (Vargas Domínguez et al. 2008). There are many moving flux knots around sunspots that are named moving magnetic features (MMFs; Harvey & Harvey 1973; Zhang et al. 2003; Hagenaar & Shine 2005). MMFs originate in the middle of the penumbra and move radially to the moat boundary, mainly along the dark penumbra (Lee 1992; Li et al. 2019). Previous studies have shown two types of MMFs (Hagenaar et al. 2012): bipolar and unipolar MMFs. They have the same or the opposite polarity as the sunspots. The unipolar MMFs are considered as the movement of single magnetic elements with the same polarity as the sunspot from which they originate, while bipolar MMFs move almost outward along the penumbral filaments, with Ω-shaped or U-shaped loops (Zuccarello et al. 2009; Li et al. 2019). The penumbral Evershed flow in the sunspot moat manifests as some MMFs (Cabrera Solana et al. 2006).
In addition to the umbra and penumbra, chromospheric fibrils surrounding a sunspot form a superpenumbra, which delimits the outer chromospheric boundary of a sunspot (Bray et al. 1974). Moreover, some large pores are also surrounded by the superpenumbra (Sobotka et al. 2013). The superpenumbra is similar to the penumbra, but extends much farther than the penumbra (Howard & Harvey 1964). A lateral extension from the magnetic field concentration in the solar photosphere, the fibrils host dynamic behavior that can be observed in the chromosphere. They can be considered tracers of the chromospheric magnetic field (Schad et al. 2013). Therefore, the superpenumbral fibrils may align with the magnetic field line and connect much farther out into the solar surface than a typical sunspot penumbra (Jing et al. 2019). According to the three-dimensional solar atmosphere model (Liu et al. 2018), the upper boundary layer of a canopy is associated with superpenumbral fibrils, which may lie in the upper chromosphere and transition region. It is worth noting that dark superpenumbral fibrils usually begin near the outer boundary of the penumbra. However, about one-third of them begin well within the penumbra (sometimes near the umbral boundary), and most superpenumbral fibrils terminate at the boundary of the penumbra to the quiet Sun (Balasubramaniam et al. 2004; Louis et al. 2014). As a result, the distance between two nearby fibrils increases from 1″ in the inner penumbra to 2″–3″ or even more at the outer superpenumbral boundary (Sobotka et al. 2013).
Although the brightness and shape of individual fibrils can undergo slight changes over a few minutes, the overall fibril pattern of the superpenumbra changes slowly. This occurs within several hours to a day or more (Thomas & Weiss 2008). The inverse Evershed flow is an inflow toward the sunspot in the chromosphere (Thomas 1994; Maltby 1997; Georgakilas & Christopoulou 2003), combined with a downflow near the boundary of the umbra, which exists in the dark superpenumbral fibrils. It is generally thought that a siphon flow is the mechanism behind the inverse Evershed flow. The highest speed of this flow is 2–3 km s−1 near the outer boundary of penumbra (Alissandrakis et al. 1988). In addition, high-speed intermittent flows with velocities of ±20 km s−1 move along superpenumbral and plage-related fibrils (Vissers & Rouppe van der Voort 2012).
Although extensive research on sunspot superpenumbrae has been carried out, details about the activities at their outer boundaries remain scarce. With the improvement of the observational instruments, we have an excellent opportunity to further study the fine structures of the outer boundaries of sunspot superpenumbrae in the chromosphere. In this paper, we report the discovery of transient dark ribbons (TDRs) at the outer boundaries of sunspot superpenumbrae. To our knowledge, TDRs have rarely been reported before. The data used in this paper come from the New Vacuum Solar Telescope (NVST; Liu et al. 2014) and the Solar Dynamics Observatory (SDO; Pesnell et al. 2012).
2. Observation and data analysis
The Fuxian Solar Observatory employs the NVST as its primary observational instrument. The NVST has a parabolic imaging mirror with a clear aperture of 985 mm and is primarily tasked with observing the fine structure of the photosphere and chromosphere. In this work, we used two sets of data that were observed on 2018 May 12 and on 2020 November 10, respectively. From 00:43 UT to 02:55 UT on 2018 May 12, the NVST pointed to a sunspot and a flocculus with a center at (N03°, E26°), a field of view of 142″ × 142″, and a pixel size of 0.″136. Although the data on 2018 May 12 have four cadences (7 s, 8 s, 9 s, and 10 s), the main cadence is 9 s. From 06:44 UT to 09:01 UT on 2020 November 10, the NVST pointed to a sunspot and a flocculus with a center at (S23°, W11°), a field of view of 172″ × 172″, and a pixel size of 0.″165. The cadences on 2020 November 10 are 44 s and 45 s, and the main cadence is 45 s. The data were calibrated by subtracting the dark current and correcting for the flat field, and the images were reconstructed to level 1+ through the application of speckle masking (Weigelt 1977; Lohmann et al. 1983).
We also adopted line-of-sight magnetograms observed by the Helioseismic Magnetic Imager (HMI; Scherrer et al. 2012) on board the SDO. The HMI line-of-sight magnetograms from 22:00 UT on 2018 May 11 to 03:00 UT on 2018 May 12 and from 04:30 UT to 09:30 UT on 2020 November 10 with a spatial sampling of 0.″6 per pixel and a cadence of 45 s were used to investigate the magnetic field of the TDRs. The HMI data collected on 2018 May 12 and 2020 November 10 were rotated differentially to the reference times (00:43:58 UT and 06:44:53 UT) and subsequently cross-correlated with the corresponding images obtained from the NVST to align them with the strong magnetic center of the sunspot.
3. Results
We present TDRs at the outer boundary of a sunspot superpenumbra in the chromosphere on 2018 May 12. The observations indicate that the TDRs, approximately perpendicular to superpenumbral fibrils, are located between the sunspot and the flocculus, and both the sunspot and the flocculus have negative magnetic fields, as shown in Figs. 1a,b. To investigate the evolution of the TDRs, we started to record a TDR only when the ratio of its length and its width was greater than 8, while the TDR is well developed. Six TDRs satisfied this condition, and we tracked them from their formation to disappearance.
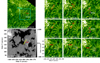 |
Fig. 1. Overview of the TDRs on 2018 May 12. Panels a and b: NVST Hα image and HMI magnetogram displaying a TDR in the chromosphere and its corresponding photospheric magnetic environment, respectively. Panels c1–c3: Hα images showing the connection of three dark sticks (s1, s2, and s3) and the subsequent formation of TDR1. Panels d1–d3: Hα images showing the connection of two dark sticks (s4 and s5) and the subsequent formation of TDR2. Panels e1–e3: Hα images showing the mergence of two sticks (s6 and s7) and the formation of TDR3. The cyan rectangle in panel (a) outlines the field of view (FOV1) of Figs. 1c1–c3, d1–d3, e1–e3, and 2a1–a6. The white dotted rectangle outlines the field of view (FOV2) of Figs. 3a1–a3 and b1–b3. The solid yellow curves in panels a and b denote the contours of TDR2. The solid yellow curves in panels c3, d3, and e3 denote the contours of TDR1, TDR2, and TDR3, respectively. The solid yellow curves in panel c1 denote the contours of three dark sticks s1, s2, and s3. The solid yellow curves in panel c2 denote the contours of two dark sticks s1 and s23. The solid yellow curves in panels d1 and d2 denote the contours of two dark sticks s4 and s5. A and B are the endpoints of s4 and s5. The yellow solid curves in panels e1 and e2 denote the contours of two dark sticks s6 and s7. The magenta arrows represent the direction of the merging. The solid white curves in panels c3, d3, and e3 denote the contours of 11 superpenumbral fibrils. |
The first example is displayed in the field of view (FOV1) of Fig. 1a. At 01:46:52 UT, three dark sticks (s1, s2, and s3) were located at the outer boundary of the sunspot superpenumbra (Fig. 1c1). In the next minute, s2 and s3 connected together to form a new dark stick s23 (see Fig. 1c2). About 3 min later, a transient dark ribbon TDR1 formed, with a length of about 10.5 Mm at 01:50:22 UT (see Fig. 1c3). At 01:56:08 UT, two dark sticks (s4 and s5) were clearly observed at the outer boundary of the sunspot superpenumbra (Fig. 1d1). Almost 2.5 min later, s4 and s5 connected. A long transient dark ribbon TDR2 formed (Fig. 1d3), with a length of 10.6 Mm. In the same region, two other dark sticks (s6 and s7) that were not located on the same line (Fig. 1e1), with lengths of 6.9 Mm and 4.6 Mm, respectively, developed gradually, and then their lengths became 8.0 Mm and 5.4 Mm (Fig. 1e2), respectively. Finally, they merged and formed a longer TDR3 (Fig. 1e3), with a length of 10.6 Mm.
To examine the motion of material along a TDR, six light curves along TDR4 were plotted (see Fig. 2) during the formation and disappearance of TDR4. The light variation of each point is independent of nearby points. For instance, the brightness of the characteristic points A and B decreases gradually and smoothly during the formation process (Figs. 2b1–b4), and no sudden decrease signals from nearby points are detected. We therefore suggest that no motion of material along TDR4 is observed, and the decreasing trend probably arises from local material accumulation. During the disappearing period (Figs. 2b5, b6), the brightness increases, implying that the material diminishes in TDR4.
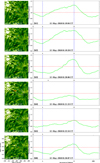 |
Fig. 2. Six light curves along TDR4 during its formation and disappearance. Panels a1–a6: Hα images showing the evolution of TDR4. Panels b1–b6: light curves of TDR4. The abscissa represents the length of TDR4, and the ordinate represents the ratio of the brightness of TDR4 to the background value. A and B are the characteristic points in TDR4. The solid yellow curves in panels a1, a4, and a6 denote the contours of TDR4, and the solid white curves denote the contours of two superpenumbral fibrils 12 and 13, respectively. |
Through checking the Hα images, we realized that there are two dissipation patterns for the TDRs. The first pattern is that a TDR breaks down into several small dark sticks. Figures 3a1–a3 show an example of this pattern. From 02:20:15 UT to 02:22:46 UT, an emission enhancement was identified around TDR5 in the NVST Hα images. At 02:22:46 UT, two small bright points BP1 and BP2 appeared on the left side of TDR5, resulting in its division into two parts L1 and L2 (Fig. 3a2). This phenomenon is thought to be due to the disturbance around TDR5, and continuous disturbance results in L1 breaking down into three dark sticks (as indicated by the solid yellow curves DS1, DS2, and DS3 in Fig. 3a3). In addition, the disturbance of a third bright point BP3 faded L2 into a smaller dark stick (DS4). The second pattern is that a TDR is dissipated by oscillation. The middle part of TDR6 (Fig. 3b1) displays oscillatory movement (Fig. 3b2), and then, TDR6 fades away (Fig. 3b3). A time-slice plot (Fig. 3c) along A–B (Fig. 3b2) displays the oscillation pattern, with a period of 4 min and an amplitude of 0.5 Mm.
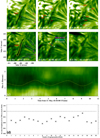 |
Fig. 3. Two dissipation patterns of the TDRs. Panels a1–a3: Hα images showing the dissipation of TDR5 when it breaks down into multiple small dark sticks. The yellow curve in panel a1 denotes the contour of TDR5, and the solid white curves denote the contours of three superpenumbral fibrils 14, 15, and 16, respectively. The cyan circles in panels a2 and a3 outline the bright points BP1, BP2, and BP3, respectively. The yellow curves in panels a2 and a3 outline the dark sticks L1, L2, DS1, DS2, DS3, and DS4. Panels b1–b3: Hα images showing that the oscillatory movement in the middle part of TDR6. Panel c: time–slice plot of an Hα image along the cut A–B marked in panel b2. The yellow curve in panel b1 denotes the contours of TDR6, and the solid white curves denote the contours of four superpenumbral fibrils 17, 18, 19, and 20, respectively. The dotted magenta, cyan, and white lines in panel b2 represent the position of the central axis of TDR6 at three times. The dotted yellow line in panel c represents the trajectory of the central axis of TDR6. Panel d: Ratios of the brightness of 6 TDRs TDR1, TDR2, TDR3, TDR4, TDR5, and TDR6 to the brightness of the 20 superpenumbral fibrils (shown in Figs. 1c3, d3, e3, 2a4, and 3a1, b1). |
In addition, we calculated the ratios of the brightness of the six TDRs (TDR1 in Fig. 1c3, TDR2 in Fig. 1d3, TDR3 in Fig. 1e3, TDR4 in Fig. 2a4, TDR5 in Fig. 3a1, and TDR6 in Fig. 3b1) to that of the nearby sunspot superpenumbral fibrils (as represented by the white curves in the corresponding figures), and 20 ratios were obtained. We note that all the ratios are lower than one (Fig. 3d), indicating that the material density within the TDRs is greater than in the superpenumbral fibrils.
In order to examine the universality of the existence of TDRs, we selected another set of data on 2020 November 20. Three TDRs (marked r1, r2, and r3) are displayed in Figs. 4c–e. Due to the poor temporal resolution (a cadence of 45 s) of the data, we cannot track the evolution of these TDRs.
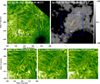 |
Fig. 4. Overview of TDRs on 2020 November 10. Panels a and b: NVST Hα image and HMI magnetogram displaying a TDR in the chromosphere and its corresponding photospheric magnetic environment, respectively. Panels c–e: Hα images showing TDRs r1, r2, and r3 appearing at different times in the region enclosed by the blue rectangle. The yellow curves in panels a and b denote the contours of r2. The yellow curves in panels c–e denote the contours of three TDRs. |
4. Conclusions and discussion
By employing data with a high spatial and temporal resolution in Hα, we studied six TDRs at the outer boundary of a sunspot superpenumbra in the chromosphere. The formation time, lifetime, length, formation pattern, and dissipation pattern are listed in Table 1. Our results indicate that the average lifetime of the TDRs is about 288 s, and the average length is 9.5 Mm. Five TDRs are formed by the connection of several small dark sticks from end to end, and the sixth TDR is formed by the merging of two thin sticks that are not in the same line. Similarly, two distinct dissipation patterns are observed. Five TDRs break down into several small dark sticks, and the sixth TDR dissipates through oscillation.
Basic information of the TDRs on 2018 May 12
In the solar atmosphere, one type of the dark structure is the filament. Filaments are relatively cool plasma condensations that are suspended in the chromosphere and corona. TDRs are morphologically similar to the filaments, but the difference between TDRs and the filaments is distinct. Filaments are always located at the boundary between the opposite-polarity magnetic field (Martin 1998) and above the magnetic polarity inversion lines. In contrast, the TDRs in this study are located in the middle of a sunspot and a flocculus, both of which have negative magnetic fields.
According to the results presented in Fig. 2, we understand that no obvious material flows along TDRs. For filaments, however, many observations show that material flows along the spine of the filament (Panesar et al. 2020). Maltby (1975) achieved high-resolution chromospheric Dopplergrams and observed that the chromospheric material generally flows along the channels of fibrils in the lower and middle chromosphere. Observations have indicated that the chromospheric material generally flows along the orientations of superpenumbral fibrils (Zhang et al. 1991). Moreover, the ratios of the TDR brightness to the superpenumbral fibril brightness (Fig. 3d) are all lower than one, that is, TDRs are darker than fibrils. We suggest that at a given time, the material in fibrils moves to their footpoints and thus increases the material density in TDRs (regular distribution of these fibril footpoints) compared to that in superpenumbral fibrils.
The dissipation and disappearance of TDRs are different from the filaments. At the later phase of the filament lifetime, the helical kink instability plays an important role in the filament eruptions (Williams et al. 2005; Yang et al. 2017; Hou et al. 2018). Magnetic reconnection sometimes results in the eruption of the filaments (Xue et al. 2020; Zhang et al. 2021). In addition, diminishing background magnetic fields might trigger the filament eruptions (Joshi et al. 2016; Hou et al. 2020). During the dissipation process of TDRs, some bright points around the TDRs (see Figs. 3a2–a3) were observed. We suggest that these bright points disturb the TDRs and break them down into smaller dark sticks. Additionally, we also observed oscillation within a TDR. In the solar atmosphere, recently observed oscillations have been interpreted and modeled as magnetohydrodynamic wave modes (Ireland et al. 2010). In the presence of strong magnetic fields, the most spectacular and powerful waves evolve in the sunspot atmosphere. Throughout the sunspot area, continuously propagating waves generate strong oscillations in spectral intensity and velocity. Oscillations are distinct in sunspots (Shine et al. 1991), including 3-min umbral waves and 5-min running penumbral waves (Zhou & Liang 2017; Fu et al. 2022). The oscillation in the TDR is also caused by the convective motion and destroys the integrity of the orderly arrangement of footpoints. From an observational point of view, the TDR is destroyed by the oscillation.
To illustrate the formation of the TDRs, two sketches are displayed in Fig. 5. At beginning, some fibrils that connect to the sunspot (the flocculus) are rooted within supergranules (Leighton 1963; Clark 1968; Parker 1979). Among these supergranules, there is a lane. The converging flows in the supergranular cells with velocities of 0.3–0.5 km s−1 (Simon & Leighton 1964; Zhang et al. 1998) sweep the fibrils into the lane. The regular distribution of these fibril footpoints in the lane manifests as a TDR.
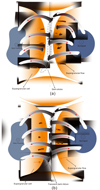 |
Fig. 5. Two schematic drawings illustrating the formation of a TDR. Panel a: superpenumbral fibril footpoints and adjacent flocculus fibril footpoints rooted within supergranules and some footpoints forming dark sticks. The four red regions represent four supergranular cells, and the red arrows within the cells represent the supergranular flows. Among these cells, there is a lane. The irregular area on the left represents the solar flocculus, and the circle on the right represents the sunspot. Both of them have negative fields. The red arrows indicate the magnetic field directions. Panel b: supergranular flows in the cells sweeping these fibril footpoints into the lane. The regular distribution of these footpoints in the lane manifests as a TDR. |
It is noteworthy that the material behavior at the outer boundaries of sunspot superpenumbrae is studied only rarely. Our observations have uncovered a new phenomenon at the outer boundaries of sunspot superpenumbrae, where the regular aggregation of both superpenumbral fibril footpoints and adjacent flocculus fibril footpoints results in the formation of TDRs. This provides a new understanding of material evolution in the chromosphere. Further investigation to determine the universality or specificity of TDRs is needed.
Acknowledgments
The authors thank the anonymous referee for helpful suggestions and comments. The observations used in our work are provided by the NVST and SDO teams. This work is supported by the National Key R&D Programs of China (2021YFA1600500, 2019YFA0405000), the National Natural Science Foundation of China (12073001), and the Anhui Project (Z010118169).
References
- Alissandrakis, C. E., Dialetis, D., Mein, P., Schmieder, B., & Simon, G. 1988, A&A, 201, 339 [NASA ADS] [Google Scholar]
- Balasubramaniam, K. S., Pevtsov, A., & Rogers, J. 2004, ApJ, 608, 1148 [NASA ADS] [CrossRef] [Google Scholar]
- Beck, C., & Choudhary, D. P. 2020, ApJ, 891, 119 [NASA ADS] [CrossRef] [Google Scholar]
- Bray, R. J., Loughhead, R. E., & Chapman, R. D. 1974, Phys. Today, 27, 57 [NASA ADS] [CrossRef] [Google Scholar]
- Cabrera Solana, D., Bellot Rubio, L. R., Beck, C., & del Toro Iniesta, J. C. 2006, ApJ, 649, L41 [NASA ADS] [CrossRef] [Google Scholar]
- Clark, A., Jr. 1968, Sol. Phys., 4, 386 [NASA ADS] [CrossRef] [Google Scholar]
- Fu, L., Zhu, Z., Yuan, D., et al. 2022, RAA, 22, 115009 [Google Scholar]
- Georgakilas, A. A., & Christopoulou, E. B. 2003, ApJ, 584, 509 [NASA ADS] [CrossRef] [Google Scholar]
- Hagenaar, H. J., & Shine, R. A. 2005, ApJ, 635, 659 [Google Scholar]
- Hagenaar, H., Shine, R., Ryutova, M., & Dalda, A. S. 2012, ASP Conf. Ser., 454, 181 [NASA ADS] [Google Scholar]
- Harvey, K., & Harvey, J. 1973, Sol. Phys., 28, 61 [Google Scholar]
- Hou, Y. J., Zhang, J., Li, T., Yang, S. H., & Li, X. H. 2018, A&A, 619, A100 [NASA ADS] [CrossRef] [EDP Sciences] [Google Scholar]
- Hou, Y. J., Li, T., Song, Z. P., & Zhang, J. 2020, A&A, 640, A101 [NASA ADS] [CrossRef] [EDP Sciences] [Google Scholar]
- Howard, R., & Harvey, J. W. 1964, ApJ, 139, 1328 [NASA ADS] [CrossRef] [Google Scholar]
- Ireland, J., Marsh, M. S., Kucera, T. A., & Young, C. A. 2010, Sol. Phys., 264, 403 [NASA ADS] [CrossRef] [Google Scholar]
- Jing, J., Li, Q., Liu, C., et al. 2019, ApJ, 880, 143 [CrossRef] [Google Scholar]
- Joshi, J. 2014, PhD Thesis, Technical University of Braunschweig, Germany [Google Scholar]
- Joshi, N. C., Schmieder, B., Magara, T., Guo, Y., & Aulanier, G. 2016, ApJ, 820, 126 [NASA ADS] [CrossRef] [Google Scholar]
- Kitai, R., Watanabe, H., Nakamura, T., et al. 2007, PASJ, 59, S585 [NASA ADS] [CrossRef] [Google Scholar]
- Lee, J. W. 1992, Sol. Phys., 139, 267 [NASA ADS] [CrossRef] [Google Scholar]
- Leighton, R. B. 1963, ARA&A, 1, 19 [NASA ADS] [CrossRef] [Google Scholar]
- Li, Q., Deng, N., Jing, J., Liu, C., & Wang, H. 2019, ApJ, 876, 129 [NASA ADS] [CrossRef] [Google Scholar]
- Liu, S., Zhang, H.-Q., Choudhary, D. P., Srivastava, A. K., & Nath Dwivedi, B. 2018, RAA, 18, 130 [Google Scholar]
- Liu, Z., Xu, J., Gu, B.-Z., et al. 2014, RAA, 14, 705 [Google Scholar]
- Lohmann, A. W., Weigelt, G., & Wirnitzer, B. 1983, Appl. Opt., 22, 4028 [NASA ADS] [CrossRef] [Google Scholar]
- Louis, R. E., Balthasar, H., Kuckein, C., et al. 2014, Astron. Nachr., 335, 161 [NASA ADS] [CrossRef] [Google Scholar]
- Maltby, P. 1975, Sol. Phys., 43, 91 [NASA ADS] [CrossRef] [Google Scholar]
- Maltby, P. 1997, ASP Conf. Ser., 118, 91 [NASA ADS] [Google Scholar]
- Martin, S. F. 1998, Sol. Phys., 182, 107 [Google Scholar]
- Nye, A., Bruning, D., & Labonte, B. J. 1988, Sol. Phys., 115, 251 [NASA ADS] [CrossRef] [Google Scholar]
- Panesar, N. K., Tiwari, S. K., Moore, R. L., & Sterling, A. C. 2020, ApJ, 897, L2 [NASA ADS] [CrossRef] [Google Scholar]
- Parker, E. N. 1979, ApJ, 230, 905 [Google Scholar]
- Pesnell, W. D., Thompson, B. J., & Chamberlin, P. C. 2012, Sol. Phys., 275, 3 [Google Scholar]
- Schad, T. A., Penn, M. J., & Lin, H. 2013, ApJ, 768, 111 [NASA ADS] [CrossRef] [Google Scholar]
- Scherrer, P. H., Schou, J., Bush, R. I., et al. 2012, Sol. Phys., 275, 207 [Google Scholar]
- Schlichenmaier, R., Jahn, K., & Schmidt, H. U. 1998, A&A, 337, 897 [NASA ADS] [Google Scholar]
- Schüssler, M., & Vögler, A. 2006, ApJ, 641, L73 [Google Scholar]
- Sheeley, N. R. J. 1969, Sol. Phys., 9, 347 [NASA ADS] [CrossRef] [Google Scholar]
- Shine, R., Tarbell, T., Title, A., et al. 1991, Bull. Am. Astron. Soc., 23, 1033 [Google Scholar]
- Simon, G. W., & Leighton, R. B. 1964, ApJ, 140, 1120 [Google Scholar]
- Sobotka, M. 1997, ASP Conf. Ser., 118, 155 [Google Scholar]
- Sobotka, M., & Puschmann, K. G. 2022, A&A, 662, A13 [NASA ADS] [CrossRef] [EDP Sciences] [Google Scholar]
- Sobotka, M., Švanda, M., Jurčák, J., et al. 2013, A&A, 560, A84 [EDP Sciences] [Google Scholar]
- Solanki, S. K. 2003, A&A Rev., 11, 153 [NASA ADS] [CrossRef] [Google Scholar]
- Thomas, J. H. 1994, in Solar Surface Magnetism, eds. R. J. Rutten, & C. J. Schrijver, NATO Advanced Study Institute (ASI) Series C, 433, 219 [NASA ADS] [CrossRef] [Google Scholar]
- Thomas, J. H., & Weiss, N. O. 2008, Sunspots and Starspots (Cambridge: Cambridge University Press) [CrossRef] [Google Scholar]
- Vargas Domínguez, S., Rouppe van der Voort, L., Bonet, J. A., et al. 2008, ApJ, 679, 900 [Google Scholar]
- Vissers, G., & Rouppe van der Voort, L. 2012, ApJ, 750, 22 [Google Scholar]
- Weigelt, G. P. 1977, Opt. Commun., 21, 55 [NASA ADS] [CrossRef] [Google Scholar]
- Williams, D. R., Török, T., Démoulin, P., van Driel-Gesztelyi, L., & Kliem, B. 2005, ApJ, 628, L163 [NASA ADS] [CrossRef] [Google Scholar]
- Xue, Z., Yan, X., Yang, L., et al. 2020, A&A, 633, A121 [NASA ADS] [CrossRef] [EDP Sciences] [Google Scholar]
- Yang, S., Zhang, J., Zhu, X., & Song, Q. 2017, ApJ, 849, L21 [NASA ADS] [CrossRef] [Google Scholar]
- Zhang, H., Ai, G., Sakurai, T., & Kurokawa, H. 1991, Sol. Phys., 136, 269 [NASA ADS] [CrossRef] [Google Scholar]
- Zhang, J., Wang, J., Wang, H., & Zirin, H. 1998, A&A, 335, 341 [NASA ADS] [Google Scholar]
- Zhang, J., Solanki, S. K., & Wang, J. 2003, A&A, 399, 755 [NASA ADS] [CrossRef] [EDP Sciences] [Google Scholar]
- Zhang, Y., Bastian, T. S., Liu, J. H., et al. 2021, ApJ, 910, 40 [NASA ADS] [CrossRef] [Google Scholar]
- Zhou, X., & Liang, H. 2017, Ap&SS, 362, 46 [NASA ADS] [CrossRef] [Google Scholar]
- Zuccarello, F., Romano, P., Guglielmino, S. L., et al. 2009, A&A, 500, L5 [NASA ADS] [CrossRef] [EDP Sciences] [Google Scholar]
All Tables
All Figures
|
Fig. 1. Overview of the TDRs on 2018 May 12. Panels a and b: NVST Hα image and HMI magnetogram displaying a TDR in the chromosphere and its corresponding photospheric magnetic environment, respectively. Panels c1–c3: Hα images showing the connection of three dark sticks (s1, s2, and s3) and the subsequent formation of TDR1. Panels d1–d3: Hα images showing the connection of two dark sticks (s4 and s5) and the subsequent formation of TDR2. Panels e1–e3: Hα images showing the mergence of two sticks (s6 and s7) and the formation of TDR3. The cyan rectangle in panel (a) outlines the field of view (FOV1) of Figs. 1c1–c3, d1–d3, e1–e3, and 2a1–a6. The white dotted rectangle outlines the field of view (FOV2) of Figs. 3a1–a3 and b1–b3. The solid yellow curves in panels a and b denote the contours of TDR2. The solid yellow curves in panels c3, d3, and e3 denote the contours of TDR1, TDR2, and TDR3, respectively. The solid yellow curves in panel c1 denote the contours of three dark sticks s1, s2, and s3. The solid yellow curves in panel c2 denote the contours of two dark sticks s1 and s23. The solid yellow curves in panels d1 and d2 denote the contours of two dark sticks s4 and s5. A and B are the endpoints of s4 and s5. The yellow solid curves in panels e1 and e2 denote the contours of two dark sticks s6 and s7. The magenta arrows represent the direction of the merging. The solid white curves in panels c3, d3, and e3 denote the contours of 11 superpenumbral fibrils. |
| In the text | |
|
Fig. 2. Six light curves along TDR4 during its formation and disappearance. Panels a1–a6: Hα images showing the evolution of TDR4. Panels b1–b6: light curves of TDR4. The abscissa represents the length of TDR4, and the ordinate represents the ratio of the brightness of TDR4 to the background value. A and B are the characteristic points in TDR4. The solid yellow curves in panels a1, a4, and a6 denote the contours of TDR4, and the solid white curves denote the contours of two superpenumbral fibrils 12 and 13, respectively. |
| In the text | |
|
Fig. 3. Two dissipation patterns of the TDRs. Panels a1–a3: Hα images showing the dissipation of TDR5 when it breaks down into multiple small dark sticks. The yellow curve in panel a1 denotes the contour of TDR5, and the solid white curves denote the contours of three superpenumbral fibrils 14, 15, and 16, respectively. The cyan circles in panels a2 and a3 outline the bright points BP1, BP2, and BP3, respectively. The yellow curves in panels a2 and a3 outline the dark sticks L1, L2, DS1, DS2, DS3, and DS4. Panels b1–b3: Hα images showing that the oscillatory movement in the middle part of TDR6. Panel c: time–slice plot of an Hα image along the cut A–B marked in panel b2. The yellow curve in panel b1 denotes the contours of TDR6, and the solid white curves denote the contours of four superpenumbral fibrils 17, 18, 19, and 20, respectively. The dotted magenta, cyan, and white lines in panel b2 represent the position of the central axis of TDR6 at three times. The dotted yellow line in panel c represents the trajectory of the central axis of TDR6. Panel d: Ratios of the brightness of 6 TDRs TDR1, TDR2, TDR3, TDR4, TDR5, and TDR6 to the brightness of the 20 superpenumbral fibrils (shown in Figs. 1c3, d3, e3, 2a4, and 3a1, b1). |
| In the text | |
|
Fig. 4. Overview of TDRs on 2020 November 10. Panels a and b: NVST Hα image and HMI magnetogram displaying a TDR in the chromosphere and its corresponding photospheric magnetic environment, respectively. Panels c–e: Hα images showing TDRs r1, r2, and r3 appearing at different times in the region enclosed by the blue rectangle. The yellow curves in panels a and b denote the contours of r2. The yellow curves in panels c–e denote the contours of three TDRs. |
| In the text | |
|
Fig. 5. Two schematic drawings illustrating the formation of a TDR. Panel a: superpenumbral fibril footpoints and adjacent flocculus fibril footpoints rooted within supergranules and some footpoints forming dark sticks. The four red regions represent four supergranular cells, and the red arrows within the cells represent the supergranular flows. Among these cells, there is a lane. The irregular area on the left represents the solar flocculus, and the circle on the right represents the sunspot. Both of them have negative fields. The red arrows indicate the magnetic field directions. Panel b: supergranular flows in the cells sweeping these fibril footpoints into the lane. The regular distribution of these footpoints in the lane manifests as a TDR. |
| In the text | |
Current usage metrics show cumulative count of Article Views (full-text article views including HTML views, PDF and ePub downloads, according to the available data) and Abstracts Views on Vision4Press platform.
Data correspond to usage on the plateform after 2015. The current usage metrics is available 48-96 hours after online publication and is updated daily on week days.
Initial download of the metrics may take a while.