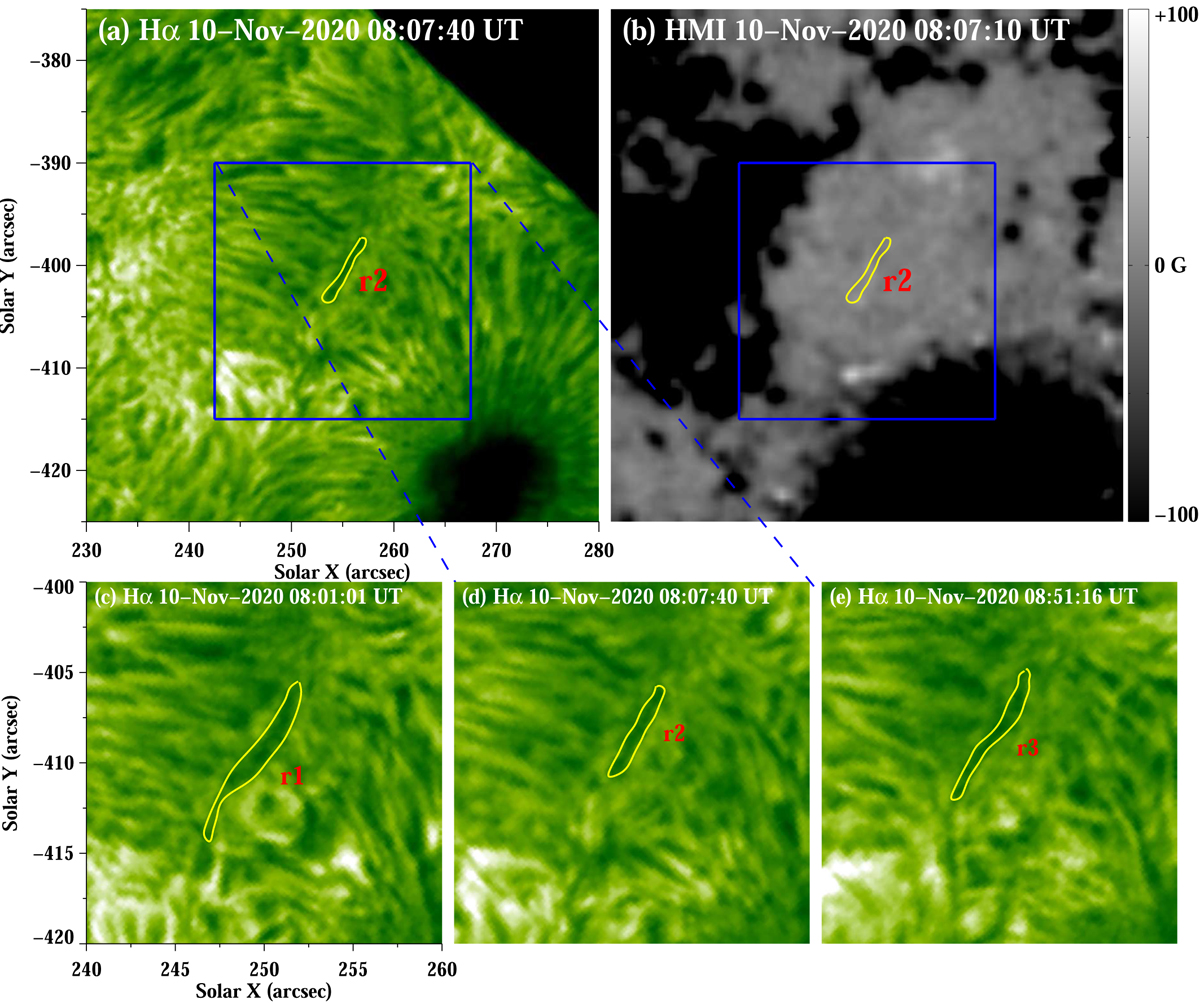
Fig. 4.
Download original image
Overview of TDRs on 2020 November 10. Panels a and b: NVST Hα image and HMI magnetogram displaying a TDR in the chromosphere and its corresponding photospheric magnetic environment, respectively. Panels c–e: Hα images showing TDRs r1, r2, and r3 appearing at different times in the region enclosed by the blue rectangle. The yellow curves in panels a and b denote the contours of r2. The yellow curves in panels c–e denote the contours of three TDRs.
Current usage metrics show cumulative count of Article Views (full-text article views including HTML views, PDF and ePub downloads, according to the available data) and Abstracts Views on Vision4Press platform.
Data correspond to usage on the plateform after 2015. The current usage metrics is available 48-96 hours after online publication and is updated daily on week days.
Initial download of the metrics may take a while.