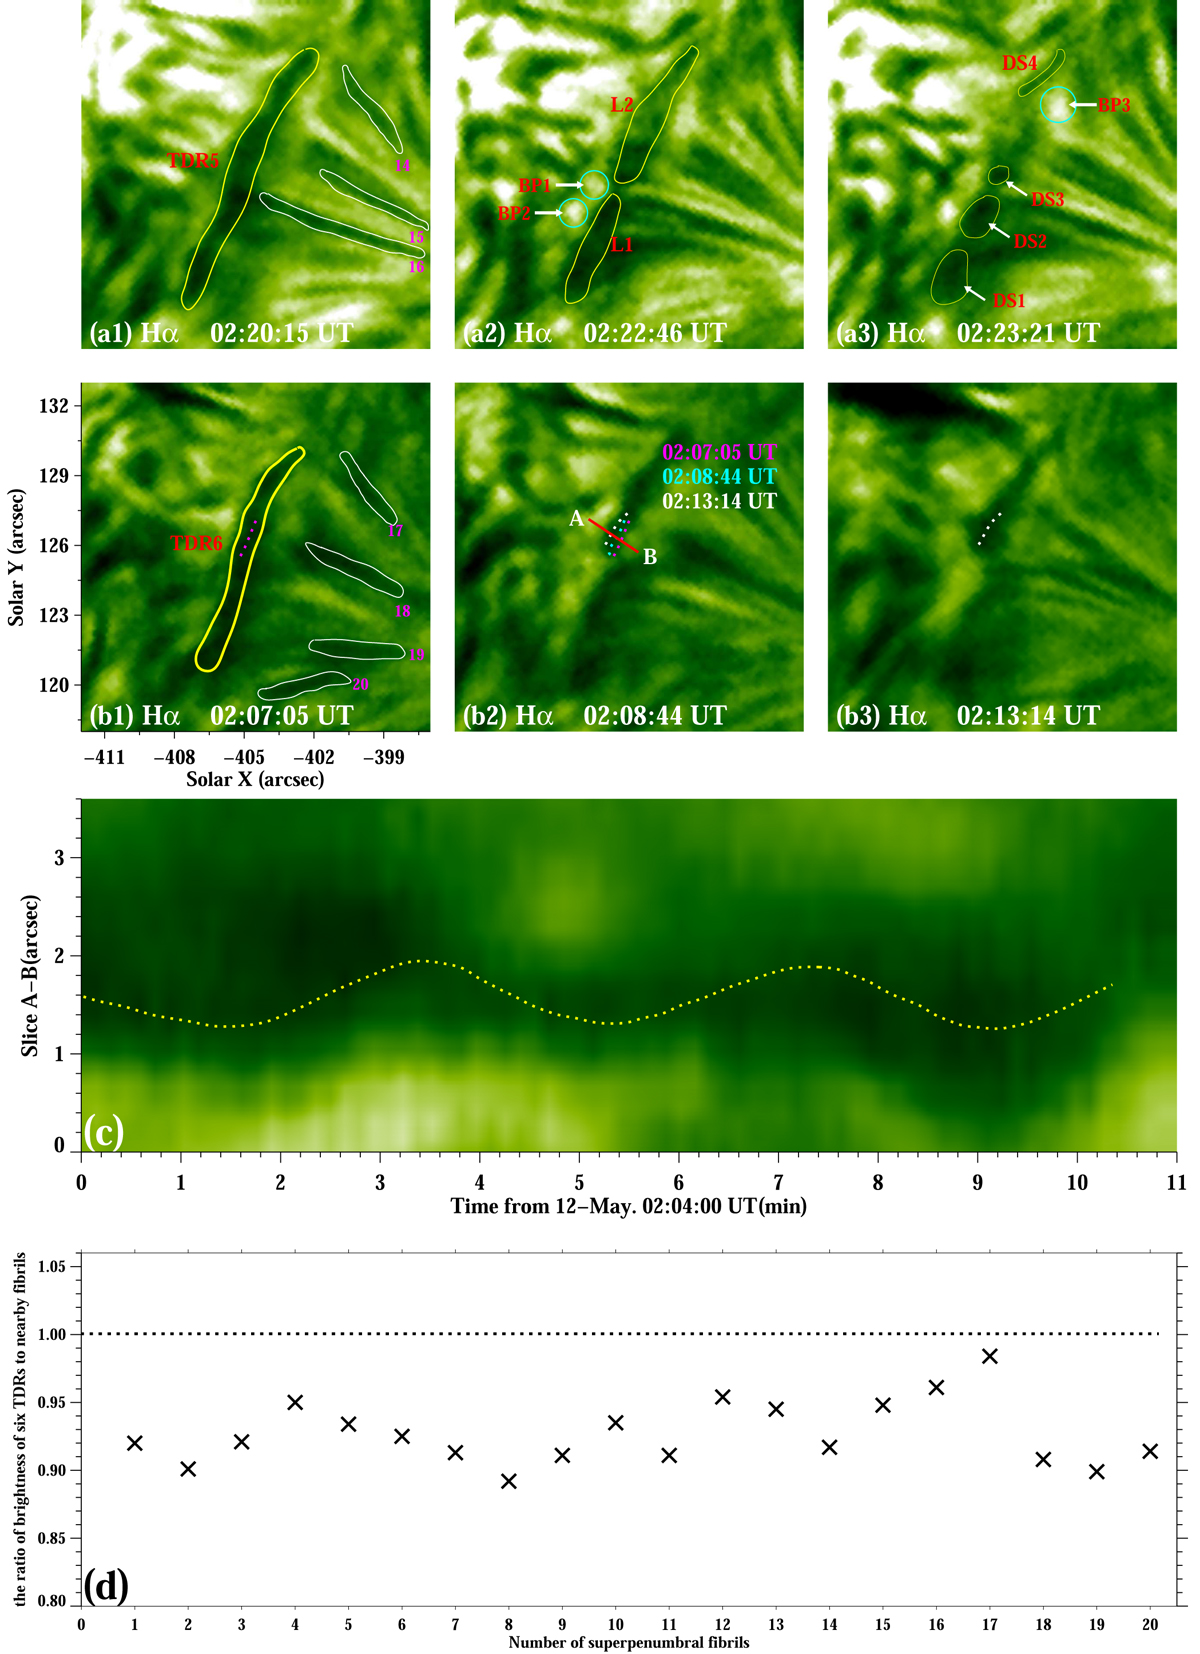
Fig. 3.
Download original image
Two dissipation patterns of the TDRs. Panels a1–a3: Hα images showing the dissipation of TDR5 when it breaks down into multiple small dark sticks. The yellow curve in panel a1 denotes the contour of TDR5, and the solid white curves denote the contours of three superpenumbral fibrils 14, 15, and 16, respectively. The cyan circles in panels a2 and a3 outline the bright points BP1, BP2, and BP3, respectively. The yellow curves in panels a2 and a3 outline the dark sticks L1, L2, DS1, DS2, DS3, and DS4. Panels b1–b3: Hα images showing that the oscillatory movement in the middle part of TDR6. Panel c: time–slice plot of an Hα image along the cut A–B marked in panel b2. The yellow curve in panel b1 denotes the contours of TDR6, and the solid white curves denote the contours of four superpenumbral fibrils 17, 18, 19, and 20, respectively. The dotted magenta, cyan, and white lines in panel b2 represent the position of the central axis of TDR6 at three times. The dotted yellow line in panel c represents the trajectory of the central axis of TDR6. Panel d: Ratios of the brightness of 6 TDRs TDR1, TDR2, TDR3, TDR4, TDR5, and TDR6 to the brightness of the 20 superpenumbral fibrils (shown in Figs. 1c3, d3, e3, 2a4, and 3a1, b1).
Current usage metrics show cumulative count of Article Views (full-text article views including HTML views, PDF and ePub downloads, according to the available data) and Abstracts Views on Vision4Press platform.
Data correspond to usage on the plateform after 2015. The current usage metrics is available 48-96 hours after online publication and is updated daily on week days.
Initial download of the metrics may take a while.