Fig. 1.
Download original image
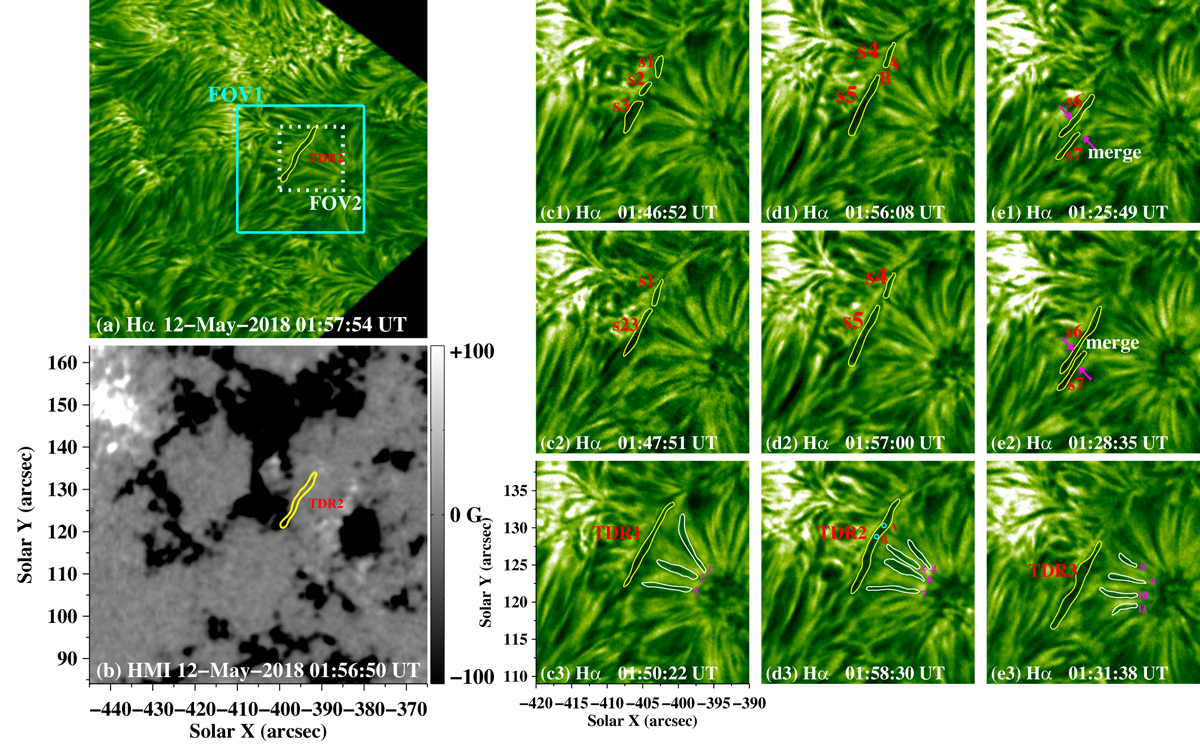
Overview of the TDRs on 2018 May 12. Panels a and b: NVST Hα image and HMI magnetogram displaying a TDR in the chromosphere and its corresponding photospheric magnetic environment, respectively. Panels c1–c3: Hα images showing the connection of three dark sticks (s1, s2, and s3) and the subsequent formation of TDR1. Panels d1–d3: Hα images showing the connection of two dark sticks (s4 and s5) and the subsequent formation of TDR2. Panels e1–e3: Hα images showing the mergence of two sticks (s6 and s7) and the formation of TDR3. The cyan rectangle in panel (a) outlines the field of view (FOV1) of Figs. 1c1–c3, d1–d3, e1–e3, and 2a1–a6. The white dotted rectangle outlines the field of view (FOV2) of Figs. 3a1–a3 and b1–b3. The solid yellow curves in panels a and b denote the contours of TDR2. The solid yellow curves in panels c3, d3, and e3 denote the contours of TDR1, TDR2, and TDR3, respectively. The solid yellow curves in panel c1 denote the contours of three dark sticks s1, s2, and s3. The solid yellow curves in panel c2 denote the contours of two dark sticks s1 and s23. The solid yellow curves in panels d1 and d2 denote the contours of two dark sticks s4 and s5. A and B are the endpoints of s4 and s5. The yellow solid curves in panels e1 and e2 denote the contours of two dark sticks s6 and s7. The magenta arrows represent the direction of the merging. The solid white curves in panels c3, d3, and e3 denote the contours of 11 superpenumbral fibrils.
Current usage metrics show cumulative count of Article Views (full-text article views including HTML views, PDF and ePub downloads, according to the available data) and Abstracts Views on Vision4Press platform.
Data correspond to usage on the plateform after 2015. The current usage metrics is available 48-96 hours after online publication and is updated daily on week days.
Initial download of the metrics may take a while.