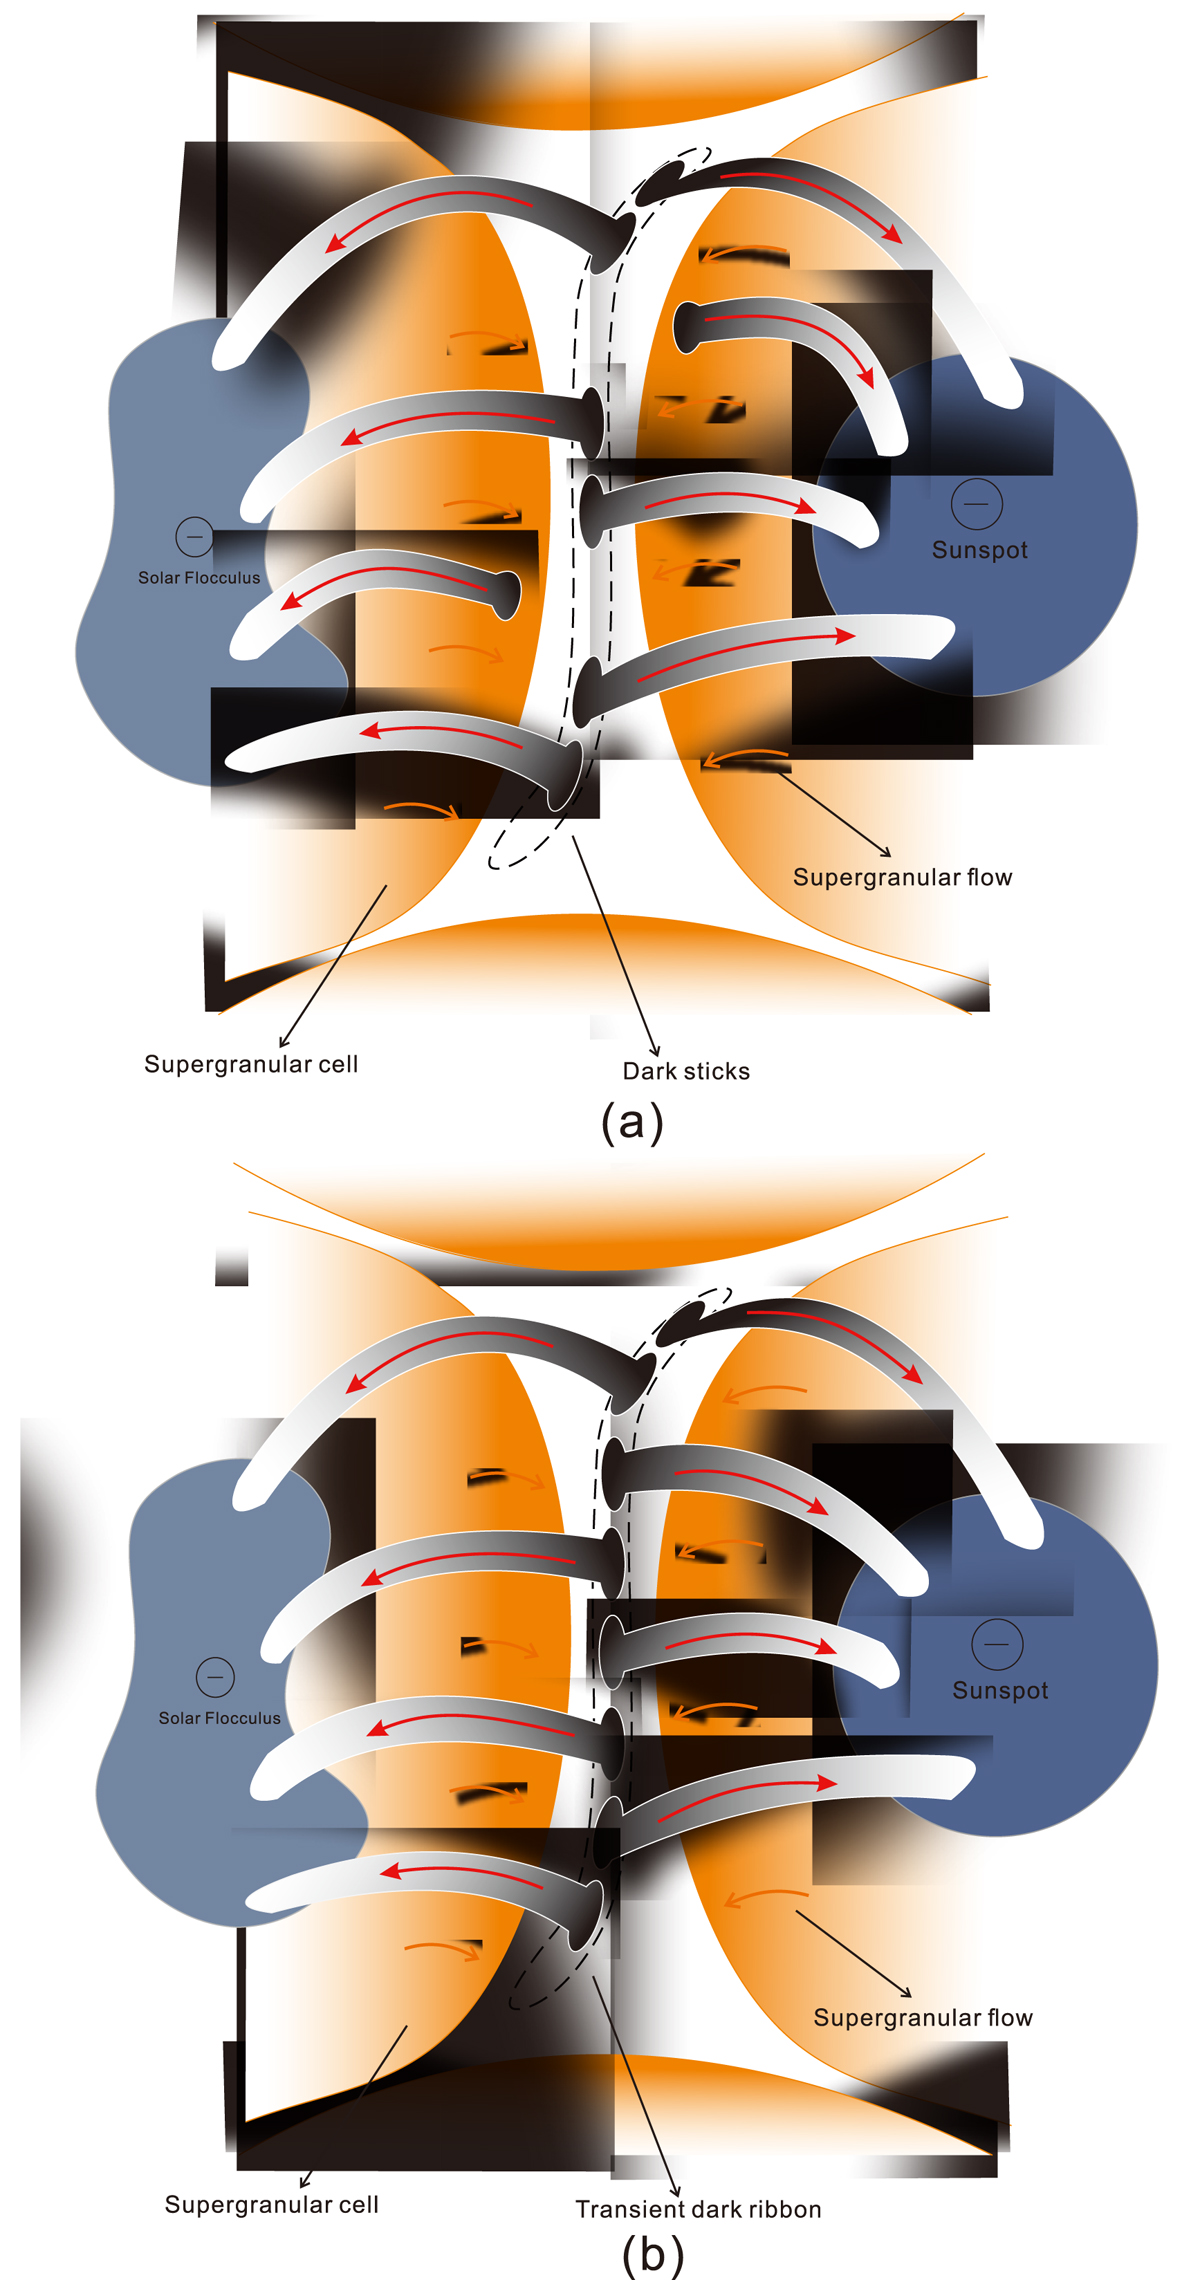
Fig. 5.
Download original image
Two schematic drawings illustrating the formation of a TDR. Panel a: superpenumbral fibril footpoints and adjacent flocculus fibril footpoints rooted within supergranules and some footpoints forming dark sticks. The four red regions represent four supergranular cells, and the red arrows within the cells represent the supergranular flows. Among these cells, there is a lane. The irregular area on the left represents the solar flocculus, and the circle on the right represents the sunspot. Both of them have negative fields. The red arrows indicate the magnetic field directions. Panel b: supergranular flows in the cells sweeping these fibril footpoints into the lane. The regular distribution of these footpoints in the lane manifests as a TDR.
Current usage metrics show cumulative count of Article Views (full-text article views including HTML views, PDF and ePub downloads, according to the available data) and Abstracts Views on Vision4Press platform.
Data correspond to usage on the plateform after 2015. The current usage metrics is available 48-96 hours after online publication and is updated daily on week days.
Initial download of the metrics may take a while.