| Issue |
A&A
Volume 676, August 2023
|
|
|---|---|---|
| Article Number | L11 | |
| Number of page(s) | 8 | |
| Section | Letters to the Editor | |
| DOI | https://doi.org/10.1051/0004-6361/202347050 | |
| Published online | 17 August 2023 | |
Letter to the Editor
A constant N2H+ (1-0)-to-HCN (1-0) ratio on kiloparsec scales
1
Observatorio Astronómico Nacional (IGN), C/Alfonso XII 3, 28014 Madrid, Spain
e-mail: This email address is being protected from spambots. You need JavaScript enabled to view it.
2
Centro de Desarrollos Tecnológicos, Observatorio de Yebes (IGN), 19141 Yebes, Guadalajara, Spain
3
LERMA, Observatoire de Paris, PSL Research University, CNRS, Sorbonne Universités, 75014 Paris, France
4
Finnish Centre for Astronomy with ESO (FINCA), University of Turku, Vesilinnantie 5, 20014 Turku, Finland
5
Aalto University Metsähovi Radio Observatory, Metsähovintie 114, 02540 Kylmälä, Finland
6
Argelander-Institut für Astronomie, Universität Bonn, Auf dem Hügel 71, 53121 Bonn, Germany
7
Department of Astrophysics, University of Vienna, Türkenschanzstrasse 17, 1180 Vienna, Austria
8
European Southern Observatory (ESO), Karl-Schwarzschild-Straße 2, 85748 Garching, Germany
9
Universität Heidelberg, Zentrum für Astronomie, Institut für Theoretische Astrophysik, Albert-Ueberle-Strasse 2, 69120 Heidelberg, Germany
10
Department of Physics & Astronomy, University of Wyoming, Laramie, WY, USA
11
Cardiff Hub for Astrophysics Research & Technology, School of Physics & Astronomy, Cardiff University, Queens Buildings, Cardiff CF24 3AA, UK
12
Haystack Observatory, Massachusetts Institute of Technology, 99 Millstone Rd., Westford, MA 01886, USA
13
Universität Heidelberg, Interdisziplinäres Zentrum für Wissenschaftliches Rechnen, Im Neuenheimer Feld 225, 69120 Heidelberg, Germany
14
Department of Astronomy, The Ohio State University, 140 West 18th Ave, Columbus, OH 43210, USA
15
Department of Physics, Tamkang University, No. 151, Yingzhuan Road, Tamsui District, New Taipei City 251301, Taiwan
16
Institut de Radioastronomie Millimétrique (IRAM), 300 Rue de la Piscine, 38406 Saint Martin d’Hères, France
17
National Astronomical Observatory of Japan, 2-21-1 Osawa, Mitaka, Tokyo 181-8588, Japan
18
Max Planck Institute for Astronomy, Königstuhl 17, 69117 Heidelberg, Germany
19
Sub-department of Astrophysics, Department of Physics, University of Oxford, Keble Road, Oxford OX1 3RH, UK
Received:
30
May
2023
Accepted:
31
July
2023
Abstract
Nitrogen hydrides such as NH3 and N2H+ are widely used by Galactic observers to trace the cold dense regions of the interstellar medium. In external galaxies, because of limited sensitivity, HCN has become the most common tracer of dense gas over large parts of galaxies. We provide the first systematic measurements of N2H+ (1-0) across different environments of an external spiral galaxy, NGC 6946. We find a strong correlation (r > 0.98, p < 0.01) between the HCN (1-0) and N2H+ (1-0) intensities across the inner ∼8 kpc of the galaxy, at kiloparsec scales. This correlation is equally strong between the ratios N2H+ (1-0)/CO (1-0) and HCN (1-0)/CO (1-0), tracers of dense gas fractions (fdense). We measure an average intensity ratio of N2H+ (1-0)/HCN (1-0) = 0.15 ± 0.02 over our set of five IRAM-30m pointings. These trends are further supported by existing measurements for Galactic and extragalactic sources. This narrow distribution in the average ratio suggests that the observed systematic trends found in kiloparsec-scale extragalactic studies of fdense and the efficiency of dense gas (SFEdense) would not change if we employed N2H+ (1-0) as a more direct tracer of dense gas. At kiloparsec scales our results indicate that the HCN (1-0) emission can be used to predict the expected N2H+ (1-0) over those regions. Our results suggest that, even if HCN (1-0) and N2H+ (1-0) trace different density regimes within molecular clouds, subcloud differences average out at kiloparsec scales, yielding the two tracers proportional to each other.
Key words: galaxies: ISM / ISM: molecules / radio lines: galaxies
© The Authors 2023
 Open Access article, published by EDP Sciences, under the terms of the Creative Commons Attribution License (https://creativecommons.org/licenses/by/4.0), which permits unrestricted use, distribution, and reproduction in any medium, provided the original work is properly cited.
This article is published in open access under the Subscribe to Open model. This email address is being protected from spambots. You need JavaScript enabled to view it. to support open access publication.
1. Introduction
Understanding the link between star formation and the available molecular reservoir is crucial to comprehending how gas density regulates star formation over cosmic time. While a variety of molecular lines are commonly employed to infer properties of the sites of current or future star formation, the rotational transitions of carbon monoxide (CO) have been the preferred tracers of the bulk molecular ISM in the Milky Way and other galaxies (e.g., Dame et al. 1987; Bally et al. 1987; Kuno et al. 2007) because of the CO abundance and low critical density (∼102 cm−3).
Star formation has been shown to take place in the densest parts of molecular clouds (e.g., Heiderman et al. 2010; Lada et al. 2010, 2012; Evans et al. 2014). These dense and compact regions are difficult to resolve in external galaxies. Lines that are more difficult to excite, such as HCN (1-0), and their ratio to low-density tracers, such as low-J CO, offer the best way to routinely probe the physical conditions and distribution of dense gas in external galaxies (e.g., Leroy et al. 2017). Over the last decade, multiple extragalactic surveys have mapped the dense gas content at low resolution (kiloparsec scales; e.g., EMPIRE Bigiel et al. 2016; Jiménez-Donaire et al. 2019) and high resolution (parsec scales; e.g., Gallagher et al. 2018b; Querejeta et al. 2019; Bešlić et al. 2021; Sánchez-García et al. 2022; Eibensteiner et al. 2022). All these studies share a key result: the HCN-to-IR ratio, an observational proxy for the star formation efficiency of dense gas (SFEdense), depends on the host galaxy and local environment. While these observed trends are in contrast to a hypothesized constant SFEdense above some critical surface density as observed on much smaller scales in the Milky Way (e.g., Lada et al. 2010, 2012; Evans et al. 2014), this conclusion critically rests on our ability to estimate dense gas masses.
In addition to dust continuum emission, nitrogen hydrides, such as NH3 and N2H+, are widely used in Galactic observations to trace cold and dense regions. N2H+ is a very selective high-density tracer, as it only efficiently forms once CO is heavily depleted (Bergin & Tafalla 2007), and therefore traces cold dense gas. Recent studies in the Galaxy compared the emission of dense gas tracers including HCN and N2H+, with dust temperatures or visual extinction (e.g., Kauffmann et al. 2017; Pety et al. 2017; Barnes et al. 2020; Evans et al. 2020; Patra et al. 2022; Dame & Lada 2023). The results in Orion, Perseus, and W49 (Kauffmann et al. 2017; Pety et al. 2017; Tafalla et al. 2021) show that N2H+ is the only emission line among the dense gas surveys that remains undetected at low densities (NH2 < 1022 cm−2, nH2 < 104 cm−3), but efficiently emits at higher densities, becoming the only truly density-selective tracer in their sample.
Because radio observations of NH3 and N2H+ in different extragalactic environments are very costly and sensitivity limited, previous works have mainly focused on the brightest targets: active galactic nuclei (AGNs), starburst galaxies, and ultra-luminous infrared galaxies (ULIRGs; e.g., Mauersberger & Henkel 1991; Meier & Turner 2005, 2012; Watanabe et al. 2014; Aladro et al. 2015; Martín et al. 2021). We present the first extragalactic observations of N2H+ (1-0) and HCN (1-0) in a wide range of dynamical conditions and star formation properties sampled across an entire galaxy disk, NGC 6946. This nearby source (7.72 Mpc, Anand et al. 2018) is a gas-rich, very actively star-forming double-barred spiral galaxy. The five positions observed cover very diverse environments within a galaxy disk. These include a central starburst, spiral and interarm regions, as well as the outer disk. The selected regions span 1.7 dex (a factor of ∼50) in star formation rate (SFR) surface density. The observations presented here provide a crucial benchmark to understand how well HCN performs as a tracer of cold dense gas that favors N2H+ emission, in a representative external galaxy.
2. Observations and data reduction
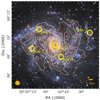 |
Fig. 1. NGC 6946 with EMPIRE CO (1-0) contours overlaid on an optical image. The contours illustrate the IRAM-30m 12CO (1-0) integrated intensities. The millimeter observations have a resolution of 26″(∼800 pc), indicated by the orange circle. The contours are drawn at arbitrary intervals between 5 and 200 K km s−1 to highlight the distribution of the molecular gas disk. The yellow circles indicate the locations of our pointed N2H+(1-0) and HCN(1-0) observations, covering a wide range of galactic environmental conditions: center (0), spiral arms (1 and 2), interarm (4), and outskirts (3). The size represents the 28″ resolution of the IRAM-30m beam at ∼86 GHz. |
We observed NGC 6946 with the IRAM-30m telescope from 2018 to 2020, using the 3 mm band (E090) of the dual-polarization Eight MIxer Receiver (EMIR, Carter et al. 2012). The observations presented here correspond to a total ∼90 h of on-source observing time (see Table 2). We achieved an angular resolution of ∼28″ at 86 GHz. Additional details on the observations, as well as N2H+ (1-0) and HCN (1-0) data reduction and analysis are given in Appendix A.
Main properties of NGC 6946.
Summary of observations and spectral line parameters for each observed position.
NGC 6946 belongs to the IRAM-30m survey EMPIRE (Jiménez-Donaire et al. 2019), and thus a suite of high critical density tracers as well as CO (1-0) and carbon isotopologs are publicly available. These lines were mapped at ∼30″ resolution across a total area of 4.5′×6.5′; therefore, a direct comparison to common dense and bulk molecular gas tracers is possible. For this study we used the CO (1-0) EMPIRE integrated intensity maps of NGC 6946 (Jiménez-Donaire et al. 2019) to compare the line ratios derived for each observed position in Fig. 1.
3. Results
N2H+ (1-0) and HCN (1-0) were successfully detected at every position with a peak signal-to-noise ratio higher than or equal to 3. The spectra presented in Fig. A.1 show that the detected line centroid of N2H+ (1-0) agrees with the mean HCN (1-0) velocity, and the two transition lines show similar line widths within ≤5%, indicating that the presence of HCN-emitting gas is always accompanied by gas emitting N2H+ in our ∼28″ beam (∼1 kpc). It is not possible to resolve the hyperfine structure (hfs) of these lines in the observed positions since the splitting separation (∼12 km s−1 for HCN (1-0) and ∼15 km s−1 for N2H+(1-0)) is smaller than the measured line widths. Table 2 reports the spectral line parameters derived for each emission line, in every observed position.
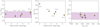 |
Fig. 2. Calculated IN2H+/IHCN ratios (left) from our measurements and IHCN/ICO ratios (middle) from EMPIRE survey data (Jiménez-Donaire et al. 2019), as a function of galactocentric radius in NGC 6946. Each observed position is indicated. The right panel shows IN2H+/IHCN as a function of IHCN/ICO, illustrating that IN2H+/IHCN remains approximately constant, while fdense changes by a factor of ∼4. The purple region shows the range of previous literature values found for the central regions of starburst galaxies, AGNs, and ULIRGs (e.g., Mauersberger & Henkel 1991; Watanabe et al. 2014; Aladro et al. 2015; Nishimura et al. 2016b; Eibensteiner et al. 2022, but see also Fig. 4). |
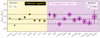 |
Fig. 4. IN2H+/IHCN ratios observed toward nearby galaxies (Aladro et al. 2015; Watanabe et al. 2014; Mauersberger & Henkel 1991; Nguyen et al. 1992; Eibensteiner et al. 2022; Nishimura et al. 2016b; Takano et al. 2019, and this work) and Galactic molecular clouds (Jones et al. 2012; Pety et al. 2017; Barnes et al. 2020; Yun et al. 2021). For galaxies with several measurements, we represent their mean values with associated uncertainties. The sizes of the circular markers are given in logarithmic scale. For visual reasons, the markers for the Galactic regions are scaled with 500 and the markers in the extragalactic regions with 300. The solid line represents the mean value among all samples, while the dashed lines indicate a 3σ dispersion from the mean. |
The left panel of Fig. 2 shows our estimated N2H+ (1-0)-to-HCN (1-0) intensity ratios (IN2H+/IHCN) as a function of galactocentric radius and observed position. We measure IN2H+/IHCN ratios that range between 0.12 and 0.20 in NGC 6946, with a mean value of 0.15 ± 0.02 and a standard deviation of 0.03. Our line ratios agree well with the range of observed IN2H+/IHCN values in nearby starbursts, AGNs, and ULIRGs (see also Fig. 4), as reflected by the purple area in the plot. This compilation is available in Table B.1. The middle panel of Fig. 2 shows the HCN (1-0)-to-CO (1-0) intensity ratios (IHCN/ICO) from EMPIRE (Jiménez-Donaire et al. 2019) extracted at the same positions.
While IHCN/ICO systematically decreases by a factor of ∼4 with increasing galactocentric distance, IN2H+/IHCN appears to be constant across the galaxy disk. We compare our observations (yellow stars) to a compilation of literature measurements in the left panel of Fig. 3, showing integrated intensities of N2H+(1-0) as a function of HCN (1-0). This includes measurements of resolved Galactic clouds (squares, Jones et al. 2012; Pety et al. 2017; Barnes et al. 2020; Yun et al. 2021) and kiloparsec-scale regions in nearby galaxies (circles, Mauersberger & Henkel 1991; Watanabe et al. 2014; Aladro et al. 2015; Nishimura et al. 2016b; Takano et al. 2019; Eibensteiner et al. 2022). While these data are taken at different resolutions (from 0.1 pc to 10 kpc), we note that such measurements are scarce and constitute our only source of comparison. It is clear from the plot that the strong correlation between IN2H+ and IHCN is observed across a wide variety of systems. A fit to the global literature data (including this work) yields
 (1)
(1)
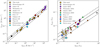 |
Fig. 3. Correlation between N2H+ (1-0), HCN (1-0) and CO (1-0) intensities and line ratios. Left: comparison between IN2H+ and IHCN in our observed locations (yellow stars), including available data for nearby galaxies (circles, Aladro et al. 2015; Watanabe et al. 2014; Mauersberger & Henkel 1991; Nguyen et al. 1992; Eibensteiner et al. 2022; Nishimura et al. 2016b; Takano et al. 2019) and Galactic molecular clouds (squares, Jones et al. 2012; Pety et al. 2017; Barnes et al. 2020; Yun et al. 2021). The solid line represents a linear fit to the ensemble data in both panels, showing that the two emission lines are strongly correlated (r > 0.98) across almost four orders of magnitude. The dashed lines indicate a 3σ dispersion from the mean. Right: IN2H+/ICO as a function of IHCN/ICO for NGC 6946 and the same literature compilation. The two ratios, both proxies for the dense gas fraction, also remain well correlated across almost three orders of magnitude. |
We measured the strength and significance of the correlation between the derived intensities with the Spearman rank correlation coefficient, r = 0.96, with a p-value < 0.001. We note that this strong correlation between IN2H+ and IHCN holds, while IHCN (and IN2H+) varies across almost three orders of magnitude.
The right panel of Fig. 3 shows the correlation of IN2H+/ICO as a function of the commonly used fdense tracer, IHCN/ICO, for the same literature compilation. These plots indicate that the two line ratios are correlated across several orders of magnitude, suggesting that they are equally good at tracing variations in fdense. A fit to all available data yields
 (2)
(2)
with r = 0.99, and p-value < 0.001. Figure 4 shows the observed line ratio ranges for our literature compilation in detail, targeting nearby galaxies, starbursts, AGNs and ULIRGs, as well as Milky Way regions. The solid line in the plot indicates a mean value of 0.15 ± 0.03 for the global IN2H+/IHCN ratio. The dashed lines represent a 3σ deviation from this mean. Our average value for NGC 6946 is in good agreement with the literature values, within the uncertainties. In this broad comparison, the Orion B cloud is the only clear outlier from the correlation with a IN2H+/IHCN ratio that is three times smaller than the average value of 0.15 found from the literature compilation. In contrast, our sampled ratios in NGC 6946 are very compatible with those found in low-metallicity environments such as the Large Magellanic Cloud (LMC), where we would expect important differences in the chemical composition of the clouds due to its deficiency in N-bearing molecules (Dufour et al. 1982). Lower HCN/HCO+ ratios have been measured in the low-metallicity galaxies LMC and IC 10 (Nishimura et al. 2016a,b; Patra et al. 2022), compared to the normal star-forming disks sampled by EMPIRE (Jiménez-Donaire et al. 2019).
4. Implications for extragalactic dense gas observations
Several studies have questioned whether the low-J transitions of HCN and HCO+, commonly used high critical density tracers, actually trace cold dense gas emission (e.g., Pety et al. 2017; Kauffmann et al. 2017; Tafalla et al. 2021). While these transitions have high critical densities, using this parameter as an indication of dense gas is an oversimplification. Among other effects, Shirley (2015) showed that radiative trapping and excitation lower the effective critical density of these lines by one or two orders of magnitude (see also Jiménez-Donaire et al. 2017). This causes a large fraction of the HCN emission to be subthermally excited (Leroy et al. 2017; Jones et al. 2023; García-Rodríguez et al. 2023). Moreover, electron excitation can significantly contribute to its emissivity (Goldsmith & Kauffmann 2017). In fact, HCN (1-0) has a higher critical density than that of N2H+ (1-0) (4.7 × 10⁵ vs. 6.1 × 104 cm−3 at 10 K, respectively), but the effective density is slightly higher for N2H+ (1-0), which is significantly less opaque than HCN (1-0) (Shirley 2015, see Table 1), even though both lines show hfs. Some studies focusing on a small number of local clouds find extended regions with low-density gas (50 − 100 cm−3) that contribute significantly to the global emission seen in HCN and HCO+ (Evans et al. 2020). In particular, Pety et al. (2017) and Kauffmann et al. (2017) find that the vast majority of the HCN and HCO+ luminosities come from regions with AV < 8 mag, while most dense star-forming cores are seen at AV ≥ 8 mag. Both studies also agree that N2H+ is able to selectively trace gas at much higher densities in Orion A and Orion B, where at least 50% of its emission comes from regions with AV ≥ 16 mag.
In addition, N2H+ primarily originates from cold gas (< 20 K). In contrast, HCN is often found to originate from gas with moderate temperatures (> 35 K; e.g., Pety et al. 2017; Barnes et al. 2020). One of the reasons why the N2H+ molecule is a particularly good tracer of cold dense gas is that it is destroyed by CO via ion–neutral interactions (Meier & Turner 2005). In addition, N2H+ formation depends on the available amount of  to react with N2, a process in which N2 competes with CO. In cold high-density gas, CO freezes out onto the dust grains, eliminating the main N2H+ destroyer and making available more
  to react with N2 (Caselli & Ceccarelli 2012). The combined result is a significant enhancement of the N2H+ abundance in cold and dense gas. Since the excitation conditions are similar for N2H+ (1-0) and HCN (1-0), it is the depletion of CO that makes the N2H+ (1-0) emission an ideal tracer of cold dense gas. Consequently, N2H+ yields a bright emission line in the densest regions of molecular clouds (Caselli et al. 1999; Bergin & Tafalla 2007), while in those same regions carbon-bearing molecules freeze onto the dust grains (Tafalla et al. 2002; Bergin & Tafalla 2007). Recent Galactic work has shown that while HCN (1-0) extends over a significant fraction of the cloud, it scales linearly with the H2 column density of the gas (e.g., Tafalla et al. 2021; Dame & Lada 2023). In NGC 6946, cloud-to-cloud variations are averaged out at the scales we probe, yielding N2H+ proportional to HCN emission. If indeed N2H+ can selectively pick the densest and coldest regions (with a typical AV ≥ 16 mag) and HCN mainly traces gas in regions with AV ∼ 6 − 8 mag, our remarkably constant IN2H+/IHCN ratio across the disk of NGC 6946 suggests that cloud structures are similar and subcloud differences average out at kiloparsec scales, yielding the two tracers proportional to each other.
The implications for extragalactic work are large. Over the last two decades, many studies have extended the strong correlation found by Gao & Solomon (2004) between HCN luminosity and IR-traced SFRs, from resolved galaxy disks (e.g., Usero et al. 2015; Gallagher et al. 2018b; Jiménez-Donaire et al. 2019) to individual cores in the Galaxy (e.g., Wu et al. 2005, 2010; Stephens et al. 2016; Shimajiri et al. 2017). Using HCN (1-0) to trace dense gas, Bigiel et al. (2016), Jiménez-Donaire et al. (2019), and Neumann et al. (2023), among others, find systematic variations in fdense and SFEdense as a function of galactic environment. These results, however, are subject to the interpretation of the HCN emissivity. Our observations show a clear correlation between IN2H+ and IHCN within a prototypical star-forming galaxy, NGC 6946, over a wide range of galactic radii, in regions with different morphologies (circumnuclear regions, spiral arms, and interarm region). These results are also in agreement with existing measurements for starbursts, ULIRGs, AGNs, and individual Galactic regions, where we find a constant ratio across more than three orders of magnitude in integrated intensities. This constant IN2H+/IHCN provides evidence that the variation of HCN (1-0) emission could be an interesting tool to estimate the cold dense gas traced by N2H+ (1-0) across approximately kiloparsec-size regions. Moreover, ratios of other lines with different critical densities such as IHCN/ICO and IN2H+/ICO can interchangeably be used as good indicators for fdense in other galaxies, at least at kiloparsec scales, as previously pointed out by Leroy et al. (2017) and Gallagher et al. (2018a). Additional kiloparsec-scale observations, however, are needed to confirm the observed trends in other nearby galaxies, including galaxy outskirts; high-resolution observations are also needed.
The strong correlation we observe implies that the amount of gas traced by HCN (1-0) is proportional to the amount of star-forming high-density gas traced by N2H+ (1-0) at kiloparsec scales. This is expected if the structure of individual star-forming molecular clouds is similar overall among different clouds, and is scale-free. The shape of the probability distribution of column densities (N-PDF) in the observed molecular clouds is best described by power-law functions (Kainulainen et al. 2009; Schneider et al. 2013; Lombardi et al. 2015; Abreu-Vicente et al. 2015) in their high-density regimes. Kiloparsec-sized extragalactic observations capture ensembles of molecular clouds, where we expect the resulting PDF of the ensemble to reflect this power-law shape if the individual clouds are indeed self-similar (e.g., independent of the scale). In that case, the ratio of gas traced by HCN (1-0) and N2H+ (1-0) (sensitive to moderate to high column density thresholds) is expected to be relatively constant. N2H+ is selective of cold dense gas, that is expected to ultimately form stars. It is interesting to find bright N2H+ emission in regions where HCN is also present, because HCN often traces moderately dense warmer gas (e.g., Barnes et al. 2020). This suggests that when observing a large region of another galaxy, it is common to find small highly shielded regions where conditions are conducive for N2H+ to be abundant, likely similar to the dark clouds found in our Galaxy. Our observations suggest that these regions have an approximately constant proportion to the warmer more excited dense gas, perhaps associated with photodissociation regions (PDRs), that likely dominate HCN emission. This could make sense given that the PDRs are natural products of star formation, and the conditions where N2H+ forms may be a relatively universal prerequisite to form stars. This adds significant weight to the interpretation of extragalactic HCN measurements in terms of tracing dense star-forming gas and the associated fdense and SFEdense.
5. Summary and conclusions
In this work we study the relation between N2H+ (1-0) and HCN (1-0) across the disk of NGC 6946, based on extensive observations with the IRAM-30m dish at ∼90 GHz. We find that the integrated intensities from the two emission lines are strongly correlated within the galaxy disk at kiloparsec scales. Moreover, this correlation is also extended to a wide range of physical environments including Galactic clouds, nearby starburst galaxies, AGNs, ULIRGs, and even low-metallicity regimes. Dense gas fractions, as probed by IHCN/ICO and IN2H+/ICO, are also very well correlated across several orders of magnitude. Our results directly address recent discussions of varying fdense and SFEdense within and across galaxies, and indicate that despite the known caveats for HCN emission, this molecule can be used instead of canonical Galactic dense gas tracers like N2H+ to estimate fdense, at least on kiloparsec scales.
Acknowledgments
This work is based on observations carried out with the IRAM-30m telescope. IRAM is supported by INSU/CNRS (France), MPG (Germany) and IGN (Spain). The authors would like to thank E. Pellegrini, D. Harsono and S. Ellison for useful discussions, and the referee, Neal Evans, for a constructive and helpful report. A.H. acknowledges funding from the European Research Council (ERC) under the European Union’s Horizon 2020 research and innovation programme (Grant agreement Nos. 851435). R.S.K. and S.C.O.G. acknowledge financial support from the ERC via the ERC Synergy Grant “ECOGAL” (project ID 855130), from the German Excellence Strategy via the Heidelberg Cluster of Excellence (EXC 2181 – 390900948) “STRUCTURES”, and from the German Ministry for Economic Affairs and Climate Action in project “MAINN” (funding ID 50OO2206). R.S.K. also thanks for computing resources provided bwHPC and DFG through grant INST 35/1134-1 FUGG and for data storage at SDS@hd through grant INST 35/1314-1 FUGG. M.J.J.D. and M.Q. acknowledge support from the Spanish grant PID2019-106027GA-C44, funded by MCIN/AEI/10.13039/501100011033. M.C. gratefully acknowledges funding from the DFG through an Emmy Noether Research Group (grant number CH2137/1-1). L.N. acknowledges funding from the Deutsche Forschungsgemeinschaft (DFG, German Research Foundation) – 516405419. A.U. acknowledges support from the Spanish grants PGC2018-094671-B-I00, funded by MCIN/AEI/10.13039/501100011033 and by “ERDF A way of making Europe”, and PID2019-108765GB-I00, funded by MCIN/AEI/10.13039/501100011033.
References
- Abreu-Vicente, J., Kainulainen, J., Stutz, A., Henning, T., & Beuther, H. 2015, A&A, 581, A74 [CrossRef] [EDP Sciences] [Google Scholar]
- Aladro, R., Martín, S., Riquelme, D., et al. 2015, A&A, 579, A101 [NASA ADS] [CrossRef] [EDP Sciences] [Google Scholar]
- Anand, G. S., Rizzi, L., & Tully, R. B. 2018, AJ, 156, 105 [NASA ADS] [CrossRef] [Google Scholar]
- Bally, J., Stark, A. A., Wilson, R. W., & Henkel, C. 1987, ApJS, 65, 13 [Google Scholar]
- Barnes, A. T., Kauffmann, J., Bigiel, F., et al. 2020, MNRAS, 497, 1972 [NASA ADS] [CrossRef] [Google Scholar]
- Bergin, E. A., & Tafalla, M. 2007, ARA&A, 45, 339 [Google Scholar]
- Bešlić, I., Barnes, A. T., Bigiel, F., et al. 2021, MNRAS, 506, 963 [CrossRef] [Google Scholar]
- Bigiel, F., Leroy, A. K., Jiménez-Donaire, M. J., et al. 2016, ApJ, 822, L26 [NASA ADS] [CrossRef] [Google Scholar]
- Carter, M., Lazareff, B., Maier, D., et al. 2012, A&A, 538, A89 [NASA ADS] [CrossRef] [EDP Sciences] [Google Scholar]
- Caselli, P., & Ceccarelli, C. 2012, A&A Rev., 20, 56 [NASA ADS] [CrossRef] [Google Scholar]
- Caselli, P., Walmsley, C. M., Tafalla, M., Dore, L., & Myers, P. C. 1999, ApJ, 523, L165 [Google Scholar]
- Crosthwaite, L. P. 2002, PASP, 114, 929 [NASA ADS] [CrossRef] [Google Scholar]
- Dame, T. M., & Lada, C. J. 2023, ApJ, 944, 197 [NASA ADS] [CrossRef] [Google Scholar]
- Dame, T. M., Ungerechts, H., Cohen, R. S., et al. 1987, ApJ, 322, 706 [NASA ADS] [CrossRef] [Google Scholar]
- de Blok, W. J. G., Walter, F., Brinks, E., et al. 2008, AJ, 136, 2648 [NASA ADS] [CrossRef] [Google Scholar]
- de Vaucouleurs, G., de Vaucouleurs, A., Corwin, Herold G. J., et al. 1991, Third Reference Catalogue of Bright Galaxies (New York: Springer) [Google Scholar]
- Dufour, R. J., Shields, G. A., Talbot, R. J. J., 1982, ApJ, 252, 461 [NASA ADS] [CrossRef] [Google Scholar]
- Eibensteiner, C., Barnes, A. T., Bigiel, F., et al. 2022, A&A, 659, A173 [CrossRef] [EDP Sciences] [Google Scholar]
- Evans, N. J., II, Heiderman, A., & Vutisalchavakul, N. 2014, ApJ, 782, 114 [CrossRef] [Google Scholar]
- Evans, N. J., II, Kim, K.-T., Wu, J., et al. 2020, ApJ, 894, 103 [NASA ADS] [CrossRef] [Google Scholar]
- Gallagher, M. J., Leroy, A. K., Bigiel, F., et al. 2018a, ApJ, 868, L38 [CrossRef] [Google Scholar]
- Gallagher, M. J., Leroy, A. K., Bigiel, F., et al. 2018b, ApJ, 858, 90 [NASA ADS] [CrossRef] [Google Scholar]
- Gao, Y., & Solomon, P. M. 2004, ApJ, 606, 271 [NASA ADS] [CrossRef] [Google Scholar]
- García-Rodríguez, A., Usero, A., Leroy, A. K., et al. 2023, A&A, 672, A96 [NASA ADS] [CrossRef] [EDP Sciences] [Google Scholar]
- Goldsmith, P. F., & Kauffmann, J. 2017, ApJ, 841, 25 [Google Scholar]
- Goulding, A. D., & Alexander, D. M. 2009, MNRAS, 398, 1165 [NASA ADS] [CrossRef] [Google Scholar]
- Heiderman, A., Evans, N. J., II, Allen, L. E., Huard, T., & Heyer, M., 2010, ApJ, 723, 1019 [Google Scholar]
- Jiménez-Donaire, M. J., Bigiel, F., Leroy, A. K., et al. 2017, MNRAS, 466, 49 [CrossRef] [Google Scholar]
- Jiménez-Donaire, M. J., Bigiel, F., Leroy, A. K., et al. 2019, ApJ, 880, 127 [CrossRef] [Google Scholar]
- Jones, P. A., Burton, M. G., Cunningham, M. R., et al. 2012, MNRAS, 419, 2961 [Google Scholar]
- Jones, G. H., Clark, P. C., Glover, S. C. O., & Hacar, A. 2023, MNRAS, 520, 1005 [NASA ADS] [CrossRef] [Google Scholar]
- Kainulainen, J., Beuther, H., Henning, T., & Plume, R. 2009, A&A, 508, L35 [NASA ADS] [CrossRef] [EDP Sciences] [Google Scholar]
- Kauffmann, J., Goldsmith, P. F., Melnick, G., et al. 2017, A&A, 605, L5 [NASA ADS] [CrossRef] [EDP Sciences] [Google Scholar]
- Kuno, N., Sato, N., Nakanishi, H., et al. 2007, PASJ, 59, 117 [NASA ADS] [Google Scholar]
- Lada, C. J., Lombardi, M., & Alves, J. F. 2010, ApJ, 724, 687 [Google Scholar]
- Lada, C. J., Forbrich, J., Lombardi, M., & Alves, J. F. 2012, ApJ, 745, 190 [NASA ADS] [CrossRef] [Google Scholar]
- Leroy, A. K., Walter, F., Bigiel, F., et al. 2009, AJ, 137, 4670 [Google Scholar]
- Leroy, A. K., Schinnerer, E., Hughes, A., et al. 2017, ApJ, 846, 71 [Google Scholar]
- Leroy, A. K., Sandstrom, K. M., Lang, D., et al. 2019, ApJS, 244, 24 [Google Scholar]
- Lombardi, M., Alves, J., & Lada, C. J. 2015, A&A, 576, L1 [NASA ADS] [CrossRef] [EDP Sciences] [Google Scholar]
- Martín, S., Mangum, J. G., Harada, N., et al. 2021, A&A, 656, A46 [NASA ADS] [CrossRef] [EDP Sciences] [Google Scholar]
- Mauersberger, R., & Henkel, C. 1991, A&A, 245, 457 [NASA ADS] [Google Scholar]
- Meier, D. S., & Turner, J. L. 2005, ApJ, 618, 259 [NASA ADS] [CrossRef] [Google Scholar]
- Meier, D. S., & Turner, J. L. 2012, ApJ, 755, 104 [NASA ADS] [CrossRef] [Google Scholar]
- Neumann, L., Gallagher, M. J., Bigiel, F., et al. 2023, MNRAS, 521, 3348 [NASA ADS] [CrossRef] [Google Scholar]
- Nguyen, Q. R., Jackson, J. M., Henkel, C., Truong, B., & Mauersberger, R. 1992, ApJ, 399, 521 [NASA ADS] [CrossRef] [Google Scholar]
- Nishimura, Y., Shimonishi, T., Watanabe, Y., et al. 2016a, ApJ, 829, 94 [NASA ADS] [CrossRef] [Google Scholar]
- Nishimura, Y., Shimonishi, T., Watanabe, Y., et al. 2016b, ApJ, 818, 161 [NASA ADS] [CrossRef] [Google Scholar]
- Patra, S., Evans, N. J., II, Kim, K.-T., et al. 2022, AJ, 164, 129 [NASA ADS] [CrossRef] [Google Scholar]
- Pety, J., Guzmán, V. V., Orkisz, J. H., et al. 2017, A&A, 599, A98 [NASA ADS] [CrossRef] [EDP Sciences] [Google Scholar]
- Querejeta, M., Schinnerer, E., Schruba, A., et al. 2019, A&A, 625, A19 [NASA ADS] [CrossRef] [EDP Sciences] [Google Scholar]
- Sánchez-García, M., García-Burillo, S., Pereira-Santaella, M., et al. 2022, A&A, 660, A83 [NASA ADS] [CrossRef] [EDP Sciences] [Google Scholar]
- Schinnerer, E., Böker, T., Emsellem, E., & Lisenfeld, U. 2006, ApJ, 649, 181 [NASA ADS] [CrossRef] [Google Scholar]
- Schneider, N., André, P., Könyves, V., et al. 2013, ApJ, 766, L17 [NASA ADS] [CrossRef] [Google Scholar]
- Shimajiri, Y., André, P., Braine, J., et al. 2017, A&A, 604, A74 [NASA ADS] [CrossRef] [EDP Sciences] [Google Scholar]
- Shirley, Y. L. 2015, PASP, 127, 299 [Google Scholar]
- Stephens, I. W., Jackson, J. M., Whitaker, J. S., et al. 2016, ApJ, 824, 29 [NASA ADS] [CrossRef] [Google Scholar]
- Tafalla, M., Myers, P. C., Caselli, P., Walmsley, C. M., & Comito, C. 2002, ApJ, 569, 815 [Google Scholar]
- Tafalla, M., Usero, A., & Hacar, A. 2021, A&A, 646, A97 [NASA ADS] [CrossRef] [EDP Sciences] [Google Scholar]
- Takano, S., Nakajima, T., & Kohno, K. 2019, PASJ, 71, S20 [Google Scholar]
- Usero, A., Leroy, A. K., Walter, F., et al. 2015, AJ, 150, 115 [Google Scholar]
- Watanabe, Y., Sakai, N., Sorai, K., & Yamamoto, S. 2014, ApJ, 788, 4 [NASA ADS] [CrossRef] [Google Scholar]
- Wu, J., Evans, N. J., II, Gao, Y., et al. 2005, ApJ, 635, L173 [NASA ADS] [CrossRef] [Google Scholar]
- Wu, J., Evans, N. J., II, Shirley, Y. L., & Knez, C. 2010, ApJS, 188, 313 [NASA ADS] [CrossRef] [Google Scholar]
- Yun, H.-S., Lee, J.-E., Choi, Y., et al. 2021, ApJS, 256, 16 [NASA ADS] [CrossRef] [Google Scholar]
Appendix A: Observations and data analysis
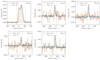 |
Fig. A.1. Individual spectra for each observed position as a function of the LSR velocity. The orange lines show the N2H+ (1-0) spectrum, while the blue lines show the HCN (1-0) emission divided by a factor of 5. The vertical dashed lines delimit the windows used to reduce the data and derive the spectral line parameters. N2H+ (1-0) shows good agreement with the mean HCN LSR velocity. Table 2 reports the derived spectral line parameters. |
The data were taken as part of projects 061-18, 055-20, 054-20, and 159-20 (PI: M. J. Jiménez-Donaire). The E090 receiver yielded an instantaneous bandwidth of 15.6 GHz per polarization, and used the fast Fourier transform (FFT) spectrometers with 195 kHz spectral resolution (FTS200, ∼0.5 km s−1) to record the data. The observations were performed in five different positions, representative of distinct environments within the nearby galaxy NGC 6946 (see Fig. 1). These were carried out in wobbler-switching mode with a total ON-OFF throw of ±110″ in azimuth and a wobbling frequency of 0.5 Hz. Four of these positions were previously observed by Usero et al. (2015), but those observations were not sensitive enough to detect N2H+(1-0). Every position was observed only when the line emission in the OFF positions along the Azimuth axis could not produce significant contamination. We did this by checking the integrated intensity and velocity in the HERACLES CO (2-1) cube of the target galaxy (Leroy et al. 2009). We tuned EMIR with a local oscillator frequency of ∼88.07 GHz, which allowed us to simultaneously observe HCN (1-0) in the lower-outer subband, and N2H+ (1-0) transition in the lower-inner subband. Additionally, other fainter transitions, such as dense gas isotopologs (H13CN (1-0), H13CO+ (1-0), and HN13C (1-0)), are present in the observed band and will be analyzed in a future paper. The angular resolution of the IRAM-30m at the frequency of HCN (1-0) is 27.9″. This sets our working resolution, which corresponds to a spatial resolution of ∼0.92 kpc at the distance of NGC 6946. Because the observations of N2H+ (1-0) and
HCN (1-0) have similar beam sizes, aperture corrections are not applied.
During the course of the observations, the focus of the telescope was checked on planets (Mars and Saturn) or bright quasars (K3-50A) at the beginning of each session and then every ∼3 hours. In addition, it was also checked at sunset and sunrise if needed. We corrected the telescope pointing approximately every 1–1.5 hours using point-like sources close to NGC 6946, such as 2037+511, 1226+023, 1928+738, and 1253-055. We obtained a standard chopper wheel calibration every ∼15 minutes to place the data on the antenna temperature scale ( ). The weather conditions were good overall, and the mean radiometer opacity at 225 GHz was measured at around 0.5.
The spectra for each observed location were calibrated with MRTCAL1 as part of the GILDAS2 software package. The data were then converted to main beam temperature (TMB) with the available beam efficiencies from the IRAM documentation3 (Feff = 95% and Beff = 81% at 3 mm) following equation  . We extracted the target emission lines using the Continuum and Line Analysis Single-dish Software4 (CLASS). We subtracted a third-order polynomial baseline in each spectrum, and avoided fitting the baseline within the velocity range of molecular emission by using the available CO velocity field maps from the EMPIRE survey. Thus, we omitted the range of ±150 km s−1 centered around the galactic mean CO (1-0) velocity. The individual spectra were then re-gridded to have a 4 km s−1 channel width across the full bandpass, and averaged to produce a final spectrum per observed location. For each position, we calculated the integrated intensities by summing over the velocity range containing bright molecular emission HCN (1-0) (see dashed limits in Fig. A.1). Finally, we measured the root mean square (rms) noise level of TMB at line-free channels of the HCN and N2H+ spectra. These values and detailed information about the observations can be found in Table 2.
Figure A.1 presents the resulting individual spectra obtained for the five different positions shown in Fig. 1, plotted in main-beam brightness temperatures and smoothed to a common spectral resolution of 4 km s−1. The average rms noise level achieved by the observations is 0.46 mK for the HCN (1-0) spectra and 0.34 mK for N2H+ (1-0).
Appendix B: Literature data
The data presented in Table B.1 contains the most up-to-date N2H+ (1-0) and HCN (1-0) observations in the literature. This compilation includes the data used to construct Fig. 3 and Fig.4. Upper limits given by Nishimura et al. (2016a) were not employed in the plots. When this compilation table is used, the original studies providing the various data sets should be referenced.
Galactic and extragalactic N2H+ (1-0) and HCN (1-0) line measurements.
All Tables
Summary of observations and spectral line parameters for each observed position.
All Figures
|
Fig. 1. NGC 6946 with EMPIRE CO (1-0) contours overlaid on an optical image. The contours illustrate the IRAM-30m 12CO (1-0) integrated intensities. The millimeter observations have a resolution of 26″(∼800 pc), indicated by the orange circle. The contours are drawn at arbitrary intervals between 5 and 200 K km s−1 to highlight the distribution of the molecular gas disk. The yellow circles indicate the locations of our pointed N2H+(1-0) and HCN(1-0) observations, covering a wide range of galactic environmental conditions: center (0), spiral arms (1 and 2), interarm (4), and outskirts (3). The size represents the 28″ resolution of the IRAM-30m beam at ∼86 GHz. |
| In the text | |
|
Fig. 2. Calculated IN2H+/IHCN ratios (left) from our measurements and IHCN/ICO ratios (middle) from EMPIRE survey data (Jiménez-Donaire et al. 2019), as a function of galactocentric radius in NGC 6946. Each observed position is indicated. The right panel shows IN2H+/IHCN as a function of IHCN/ICO, illustrating that IN2H+/IHCN remains approximately constant, while fdense changes by a factor of ∼4. The purple region shows the range of previous literature values found for the central regions of starburst galaxies, AGNs, and ULIRGs (e.g., Mauersberger & Henkel 1991; Watanabe et al. 2014; Aladro et al. 2015; Nishimura et al. 2016b; Eibensteiner et al. 2022, but see also Fig. 4). |
| In the text | |
|
Fig. 4. IN2H+/IHCN ratios observed toward nearby galaxies (Aladro et al. 2015; Watanabe et al. 2014; Mauersberger & Henkel 1991; Nguyen et al. 1992; Eibensteiner et al. 2022; Nishimura et al. 2016b; Takano et al. 2019, and this work) and Galactic molecular clouds (Jones et al. 2012; Pety et al. 2017; Barnes et al. 2020; Yun et al. 2021). For galaxies with several measurements, we represent their mean values with associated uncertainties. The sizes of the circular markers are given in logarithmic scale. For visual reasons, the markers for the Galactic regions are scaled with 500 and the markers in the extragalactic regions with 300. The solid line represents the mean value among all samples, while the dashed lines indicate a 3σ dispersion from the mean. |
| In the text | |
|
Fig. 3. Correlation between N2H+ (1-0), HCN (1-0) and CO (1-0) intensities and line ratios. Left: comparison between IN2H+ and IHCN in our observed locations (yellow stars), including available data for nearby galaxies (circles, Aladro et al. 2015; Watanabe et al. 2014; Mauersberger & Henkel 1991; Nguyen et al. 1992; Eibensteiner et al. 2022; Nishimura et al. 2016b; Takano et al. 2019) and Galactic molecular clouds (squares, Jones et al. 2012; Pety et al. 2017; Barnes et al. 2020; Yun et al. 2021). The solid line represents a linear fit to the ensemble data in both panels, showing that the two emission lines are strongly correlated (r > 0.98) across almost four orders of magnitude. The dashed lines indicate a 3σ dispersion from the mean. Right: IN2H+/ICO as a function of IHCN/ICO for NGC 6946 and the same literature compilation. The two ratios, both proxies for the dense gas fraction, also remain well correlated across almost three orders of magnitude. |
| In the text | |
|
Fig. A.1. Individual spectra for each observed position as a function of the LSR velocity. The orange lines show the N2H+ (1-0) spectrum, while the blue lines show the HCN (1-0) emission divided by a factor of 5. The vertical dashed lines delimit the windows used to reduce the data and derive the spectral line parameters. N2H+ (1-0) shows good agreement with the mean HCN LSR velocity. Table 2 reports the derived spectral line parameters. |
| In the text | |
Current usage metrics show cumulative count of Article Views (full-text article views including HTML views, PDF and ePub downloads, according to the available data) and Abstracts Views on Vision4Press platform.
Data correspond to usage on the plateform after 2015. The current usage metrics is available 48-96 hours after online publication and is updated daily on week days.
Initial download of the metrics may take a while.