Fig. 4.
Download original image
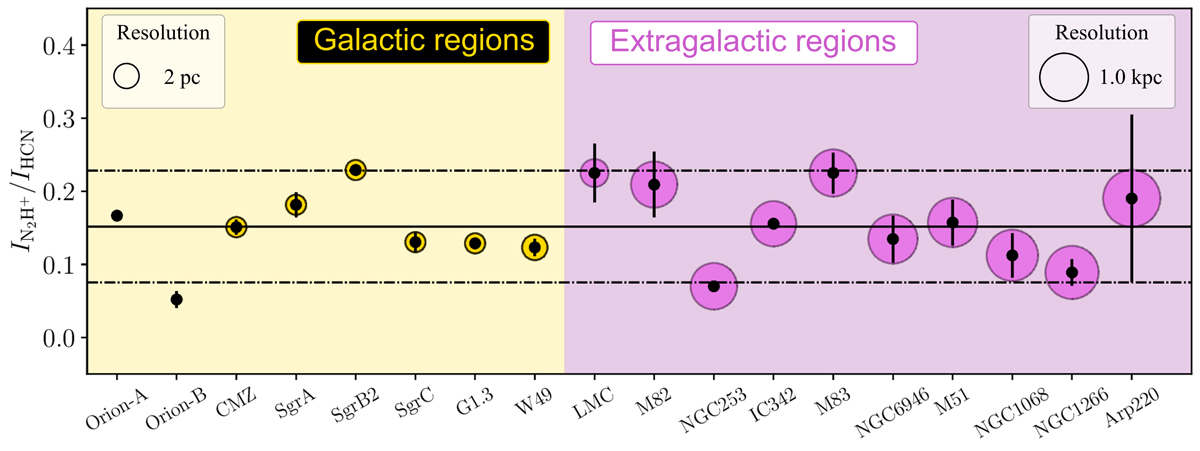
IN2H+/IHCN ratios observed toward nearby galaxies (Aladro et al. 2015; Watanabe et al. 2014; Mauersberger & Henkel 1991; Nguyen et al. 1992; Eibensteiner et al. 2022; Nishimura et al. 2016b; Takano et al. 2019, and this work) and Galactic molecular clouds (Jones et al. 2012; Pety et al. 2017; Barnes et al. 2020; Yun et al. 2021). For galaxies with several measurements, we represent their mean values with associated uncertainties. The sizes of the circular markers are given in logarithmic scale. For visual reasons, the markers for the Galactic regions are scaled with 500 and the markers in the extragalactic regions with 300. The solid line represents the mean value among all samples, while the dashed lines indicate a 3σ dispersion from the mean.
Current usage metrics show cumulative count of Article Views (full-text article views including HTML views, PDF and ePub downloads, according to the available data) and Abstracts Views on Vision4Press platform.
Data correspond to usage on the plateform after 2015. The current usage metrics is available 48-96 hours after online publication and is updated daily on week days.
Initial download of the metrics may take a while.