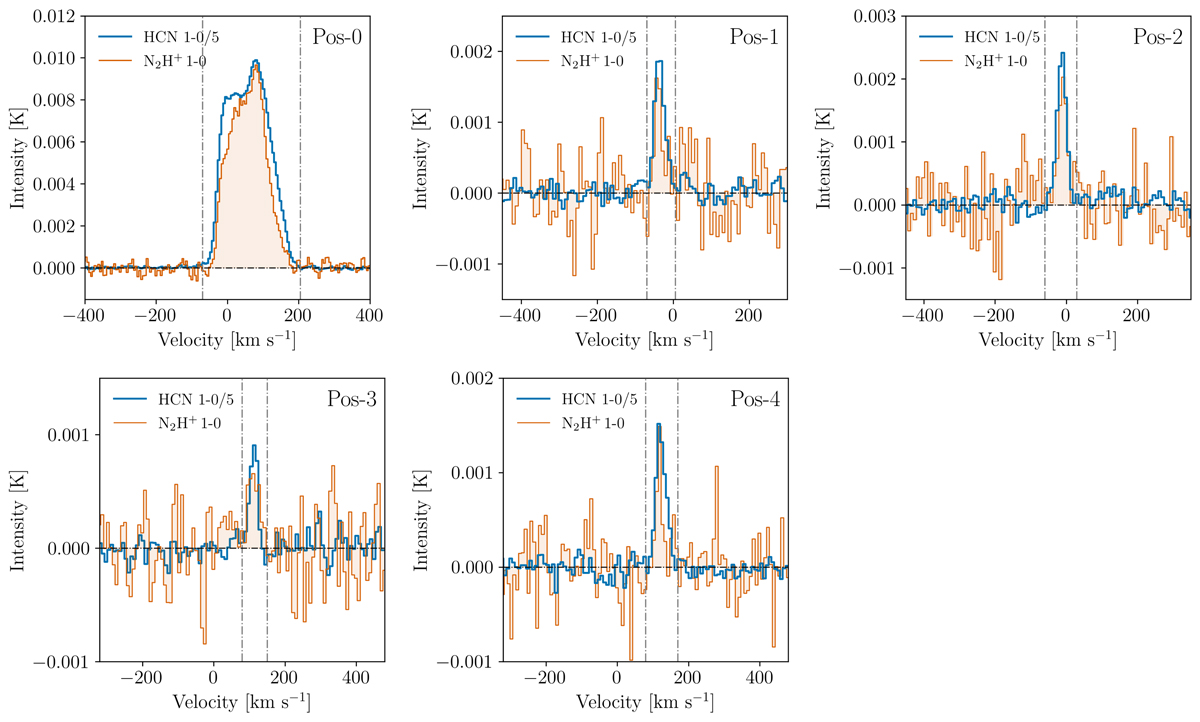
Fig. A.1.
Download original image
Individual spectra for each observed position as a function of the LSR velocity. The orange lines show the N2H+ (1-0) spectrum, while the blue lines show the HCN (1-0) emission divided by a factor of 5. The vertical dashed lines delimit the windows used to reduce the data and derive the spectral line parameters. N2H+ (1-0) shows good agreement with the mean HCN LSR velocity. Table 2 reports the derived spectral line parameters.
Current usage metrics show cumulative count of Article Views (full-text article views including HTML views, PDF and ePub downloads, according to the available data) and Abstracts Views on Vision4Press platform.
Data correspond to usage on the plateform after 2015. The current usage metrics is available 48-96 hours after online publication and is updated daily on week days.
Initial download of the metrics may take a while.