Fig. 3.

Download original image
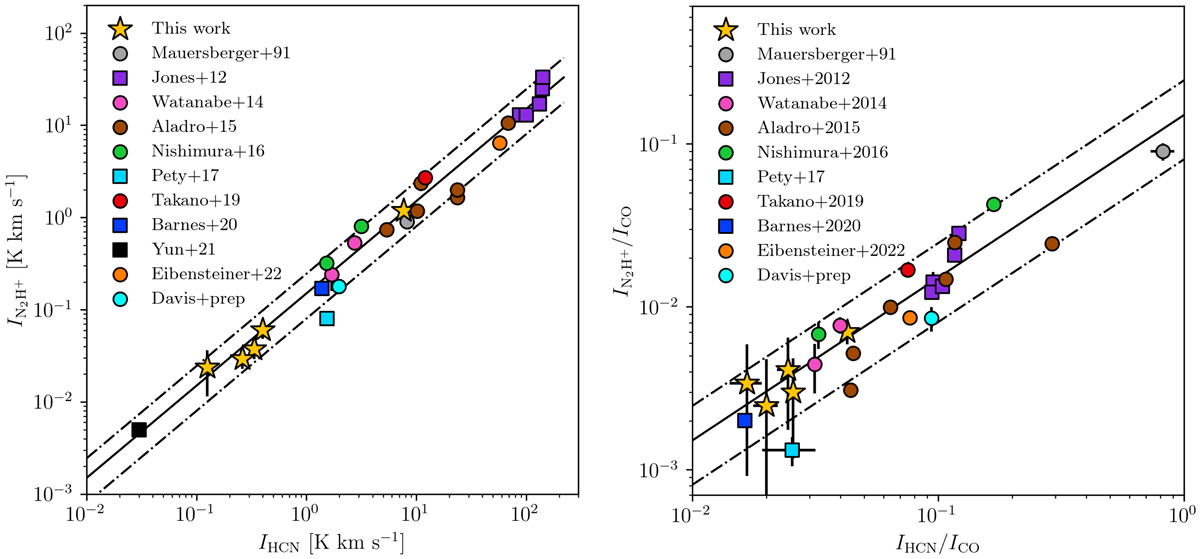
Correlation between N2H+ (1-0), HCN (1-0) and CO (1-0) intensities and line ratios. Left: comparison between IN2H+ and IHCN in our observed locations (yellow stars), including available data for nearby galaxies (circles, Aladro et al. 2015; Watanabe et al. 2014; Mauersberger & Henkel 1991; Nguyen et al. 1992; Eibensteiner et al. 2022; Nishimura et al. 2016b; Takano et al. 2019) and Galactic molecular clouds (squares, Jones et al. 2012; Pety et al. 2017; Barnes et al. 2020; Yun et al. 2021). The solid line represents a linear fit to the ensemble data in both panels, showing that the two emission lines are strongly correlated (r > 0.98) across almost four orders of magnitude. The dashed lines indicate a 3σ dispersion from the mean. Right: IN2H+/ICO as a function of IHCN/ICO for NGC 6946 and the same literature compilation. The two ratios, both proxies for the dense gas fraction, also remain well correlated across almost three orders of magnitude.
Current usage metrics show cumulative count of Article Views (full-text article views including HTML views, PDF and ePub downloads, according to the available data) and Abstracts Views on Vision4Press platform.
Data correspond to usage on the plateform after 2015. The current usage metrics is available 48-96 hours after online publication and is updated daily on week days.
Initial download of the metrics may take a while.


