| Issue |
A&A
Volume 676, August 2023
|
|
|---|---|---|
| Article Number | A19 | |
| Number of page(s) | 8 | |
| Section | Stellar structure and evolution | |
| DOI | https://doi.org/10.1051/0004-6361/202346758 | |
| Published online | 28 July 2023 | |
An insight into Capella (α Aurigae): From the extent of core overshoot to its evolutionary history
1
INAF, Observatory of Rome, Via Frascati 33, 00078 Monte Porzio Catone (RM), Italy
e-mail: This email address is being protected from spambots. You need JavaScript enabled to view it.
2
Dipartimento di Fisica, Sapienza Università di Roma, Piazzale Aldo Moro 5, 00185 Roma, Italy
3
Dipartimento di Fisica e Astronomia Augusto Righi, Università degli Studi di Bologna, Via Gobetti 93/2, 40129 Bologna, Italy
Received:
27
April
2023
Accepted:
17
June
2023
Abstract
Context. The binary star α Aurigae (otherwise known as Capella) is extremely important to understanding the core hydrogen and helium burning phases of stars, as its primary star is likely evolving through the core helium burning phase. Moreover, the masses of the star’s two components are ∼2.5 M⊙ and ∼2.6 M⊙, meaning they fall into a mass range in which the extension of the core overshoot during the main sequence phase is uncertain.
Aims. We aim to derive the extent of the core overshoot experienced during the core burning phases and to test the efficiency of the convective transport of energy in the external envelope of Capella by comparing results from stellar evolution modelling with the results from observations.
Methods. We considered evolutionary tracks calculated expressly for the present work, that is, for the primary and secondary stars of Capella. We determined the extent of the extra mixing from the core during the main sequence evolution and the age of the system by requiring that the effective temperatures and surface gravities of the model stars reproduce those derived from the observations at the same epoch. We further checked the consistency between the observed and predicted surface chemistry of the stars.
Results. The consistency between results from stellar evolution modelling and the observations of Capella is found when extra mixing from the core is assumed, the extent of the extra-mixed zone being of the order of 0.25 HP. The age of the system is estimated to be 710 Myr. These results allow the observed surface chemistry to be well reproduced, particularly the recent determination of the 12C/13C ratio based on Large Binocular Telescope and Vatican Advanced Technology Telescope observations.
Key words: binaries: general / stars: abundances / stars: interiors / stars: evolution
© The Authors 2023
 Open Access article, published by EDP Sciences, under the terms of the Creative Commons Attribution License (https://creativecommons.org/licenses/by/4.0), which permits unrestricted use, distribution, and reproduction in any medium, provided the original work is properly cited.
This article is published in open access under the Subscribe to Open model. This email address is being protected from spambots. You need JavaScript enabled to view it. to support open access publication.
1. Introduction
Understanding the physics of stars demands a thorough comprehension of how sources of different mass and metallicity evolve and how the corresponding evolutionary tracks move across the Hertzprung–Russell (HR) diagram. In this regard, spectroscopic binaries are a crucial tool, as they allow for the masses of the individual components of stars to be inferred with great precision, something that eases the comparison between observational evidence and theoretical predictions.
Among the various uncertainties still affecting the reliability of results from stellar evolution modelling, we stress those connected to the convective instability, namely: (a) the extension of the convective core during the main sequence (MS) evolution of M ≥ 1.2 M⊙ stars; (b) the extent of the mixing occurring during the red giant branch (RGB) ascending, which brings the surface regions of the stars in contact with internal zones previously touched by nuclear activity; (c) the efficiency of the convective transport of energy, which reflects onto the overadiabaticity required in the outer layers of the envelope and thus the temperature gradient in those regions.
The size of the convective core determines the duration of the core hydrogen burning phase, the luminosity of the turn-off (the point in the HR diagram where the evolutionary tracks bend to the red after the consumption of the central hydrogen), and the luminosity of the ‘bump’ defined by the evolutionary tracks during the core helium burning phase. The discussions on this argument date back to the pioneering investigations aimed at calibrating the extent of overshooting from the convective core of stars evolving through the MS (Bressan et al. 1981; Renzini 1987; Chiosi et al. 1992). The debate was mainly focussed on the need to assume some overshoot from the convective core to reproduce the turn-off morphology and luminosity of open clusters. Among others, we recall the divergences regarding the cluster NGC 1866. Some research groups claimed that no-overshoot models were consistent with the observations (Brocato et al. 1989; Testa et al. 1999), while other teams stressed the need of assuming a significant extra mixing from the core (Chiosi et al. 1989; Barmina et al. 2002). Further applications of core overshoot regarded the mass discrepancy problems of Cepheid stars (Bertelli et al. 1993). Recently, binary systems have been extensively used to determine the extent of core overshoot as a function of the stellar mass (Claret & Torres 2017, 2019; Morales et al. 2022). Further constraints on core overshoot were obtained by the determination of the initial-final mass relationship, based on the analysis of the turn-off of clusters and white dwarf cooling sequences (Cummings et al. 2019).
The inwards penetration of the bottom of the convective envelope during RGB evolution is a natural consequence of the expansion and cooling of the external regions of stars. This event, commonly known as the first dredge-up (FDU), is easily predicted by stellar evolution modelling and leads to the modification of the surface chemistry of a star, which can be tested spectroscopically. However, other processes might potentially alter the relative abundances of the various chemicals in a modality that is still highly debated (Hedrosa et al. 2013; Pinsonneault 1997; Charbonnel & Lagarde 2010).
Capella (α Aurigae) is one of the most investigated and brightest binaries in the sky. Both components of Capella have an estimated metallicity that is nearly solar (Fuhrmann 2011; Torres et al. 2015) and a mass of the order of 2.5 M⊙ (Weber & Strassmeier 2011; Torres et al. 2015). This mass range is extremely interesting for a number of reasons: (a) This mass is just above the threshold value that separates the sources experiencing helium flash from those undergoing quiescent helium burning; (b) The study of the extension of the core mass during the MS phase of the star with a mass close to those of Capella’s components proves very important since the investigations developed so far have showed that the trend of the extension of the extra-mixed region with mass exhibits a clear knee for masses below ∼2.5 M⊙ (Claret & Torres 2017; c) The studies focussed on dust production by low- and intermediate-mass stars outlined that stars in the 2.5 − 3 M⊙ mass range are the most efficient dust manufacturers among the stellar sources, owing to the large carbon enhancement achieved during the asymptotic giant branch evolution, which triggers the production of large quantities of carbonaceous dust (Ventura et al. 2014; Dell’Agli et al. 2015; Dell’Agli et al. 2021).
The study of Capella is therefore particularly important because of the tight estimate of the mass of both components and of their physical properties, mainly surface gravity and effective temperature (Torres et al. 2015; Takeda et al. 2018). Furthermore, the surface chemical composition of its components was determined through atmosphere models and spectrum synthesis (Fuhrmann 2011; Torres et al. 2015; Takeda et al. 2018). The interpretation of this information allowed the extension of the convective core during the MS evolution to be deduced (which is crucial to reproduce the luminosity of both components) and the extent of the mixing from the base of the convective envelope during the FDU event to be estimated (this is crucial to reproduce the observed chemical composition, particularly of the primary, which has presumably already experienced the FDU). The latter point has received renewed interest in the last few years, owing to the recent study by Sablowski et al. (2019), who used Large Binocular Telescope (LBT) and Vatican Advanced Technology Telescope (VATT) data to derive the surface carbon ratio of the primary star, obtaining a 12C/13C ∼ 18 − 20, which is significantly smaller than what was found in previous investigations (Tomkin et al. 1976). These observations were carried out with the Potsdam Echelle Polarimetric and Spectroscopic Instrument (PEPSI; Strassmeier et al. 2015) installed on the pier of LBT. The ultra high resolution mode provided by PEPSI (R = 250 000) was used to derive the isotope ratio through the use of spectrum synthesis from the CN lines at 8004 Å.
In this present study, we reproduce the surface gravities and effective temperatures of the two components of Capella and the surface chemical composition of the primary star (summarised in Table 1) by comparing the observational evidences with results from detailed stellar evolutionary models, calculated ad hoc for the two components of the system. The present analysis is aimed at determining the physical properties, particularly the extent of the core overshoot during the MS phase, that allow the best agreement with the results from observations. The derivation of the age of the system is the natural outcome of such an analysis. We first consider the possibility that the primary and secondary stars evolved at a constant mass that is equal to those determined currently. We also explore the case that the primary component suffered mass loss while evolving during the RGB and that it formed with a mass higher than the current one.
Physical and chemical parameters of Capella.
The paper is structured as follows: The numerical and physical input used to calculate the evolutionary sequences in the present analysis are described in Sect. 2. A general description of the structural and evolutionary properties of stars with masses similar to those of Capella’s components is given in Sect. 3. In Sect. 4, we reconstruct the evolutionary history of Capella and discuss the extent of the core overshoot that allows the best agreement with the observational evidence. Finally, the conclusions are given in Sect. 5.
2. Stellar evolution modelling
The evolutionary sequences used in the present investigation were calculated by means of the ATON code for stellar evolution in the version documented in Ventura et al. (1998), where the interested reader can find the details of the numerical structure of the code. The latest updates, including the nuclear network adopted and the micro-physics used, are described in Ventura & D’Antona (2009). In this section, we briefly discuss the physical and chemical ingredients of the code most relevant to the present study.
We considered model stars of initial mass in the 2.5 − 2.7 M⊙ range and with solar metallicity. The solar mixture was taken according to Lodders et al. (2009). The initial metallicity and helium mass fraction were set to Z = 0.014 and Y = 0.268, respectively.
2.1. The convective model
The location of the borders separating the regions of the stars characterised by convective motions from the radiatively stable layers were found via the classic Schwarzschild criterion. The temperature gradient with regions unstable to convective motions was calculated by means of the full spectrum of turbulence (FST) model (Canuto & Mazzitelli 1991). The mixing length within the deep interiors of convective zones is assumed to be Λ = z, where z is the distance from the nearest convective border. Close to the boundaries, we used Λ = z + βHp. The free parameter was set to β = 0.2, in agreement with the calibration of the solar model given in Canuto & Mazzitelli (1991). Some further choices of β were considered for the present work.
2.2. Nuclear activity in convective regions
The processes of nuclear burning and the mixing of chemicals are coupled with the diffusive schematisation described in Cloutman & Eoll (1976). The diffusive coefficient entering this treatment is D = 1/3vcΛ, where the convective velocity vc is calculated by means of Eqs. (88), (89), and (90) of Canuto et al. (1996). Regarding the mixing of chemicals beyond the formal borders found via the Schwarzschild criterion, we consider an exponential decay of velocities, with a decay factor  . In the expression, Pb is the pressure at the formal boundary set by the Schwarzschild criterion, fthick is the thickness of the convective region in fractions of the pressure scale height Hp, and ζ is the parameter giving the e-folding distance of the convective velocity decay within radiatively stable regions and is thus related to the extent of the extra mixing occurring beyond the Schwarzschild border. The exponential approach to treat extra mixing was applied also from the base of the convective envelope during the ascending of the RGB.
We note that convective velocities vanish at the formal border of convection. Therefore, as described in detail in Sect. 2.2 of Ventura et al. (1998), the exponential decay is started by a point within the convective zone where the pressure is 5% different with respect to the pressure at the convective boundary. As showed in Ventura et al. (1998), assuming that the decay starts from points where the pressure differences are 2%, 5%, and 10% has no impact on the velocity profile.
The treatment adopted in this present work is physically equivalent to those used in other investigations (Herwig et al. 1998; Torres et al. 2015) based on the exponential decay of velocities within radiative regions, as indicated by the numerical simulations by Freytag et al. (1996). However, the formalism is different, as the decay is given as a function of pressure in this paper, whereas in the others the authors use the distance from the border. Therefore, the values of ζ that are derived in this work cannot be compared directly with the results of the other investigations.
During the core He-burning phases, we also considered diffusive extra mixing, as described above. We did not assume any specific treatment of semi-convection (Castellani et al. 1971) in the present work, as the overshooting assumption pushes the boundary of the mixing zone beyond the critical point where the instabilities associated with semi-convection might arise (Caloi & Mazzitelli 1993).
3. The evolutionary properties of Capella’s components
The primary and secondary components of Capella have masses around 2.5 M⊙. The current masses should not differ substantially from the initial values; this holds in particular for the secondary component, which is currently evolving through the initial part of the RGB phase, where no significant mass loss occurs. Therefore, to understand the evolutionary properties of these stars, we focussed on solar metallicity model stars with an initial mass of 2.5 M⊙.
These stars develop a convective core during the MS lifetime. Thus, the results obtained are sensitive to the assumed extra mixing from the external border of the core during the hydrogen burning phase, which in the present work is described by the parameter ζ, introduced in Sect. 2.2. The choice of ζ affects the extension of the mixed region beyond the formal border of the convective core during the MS. This choice also influences the duration of the H-burning phase and consequently the evolutionary timescale of the model stars.
This can be seen in Fig. 1, where the different lines indicate the time variation of the mass of the region around the centre of the star and where the surface chemistry shows trace of nuclear processing, which can be considered as the mass of the star within which convective mixing was sufficiently efficient to carry the products of the nuclear activity occurring in the deep interior. We found that the border of this region is located at the layer of the star where the diffusion coefficient, defined in Sect. 2.2, drops below 10−10 c.g.s. unit. The masses reported in Fig. 1 refer to this layer. This choice implicitly implies that the definition of the masses shown in Fig. 1 is not physical. However, the quantities shown in the figure can be safely considered in order to deduce the extent of the regions of the stars touched by convective currents. Furthermore, the comparison of the individual tracks with the no-overshoot case (Fig. 1, in black) allowed us to infer the extent of the overshoot zone according to the choice of ζ.
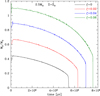 |
Fig. 1. Variation over time of the mass of the central region of the star mixed by convective currents of a model star with an initial mass of 2.5 M⊙ and solar metallicity during the hydrogen burning phase. The various lines correspond to the different values of ζ adopted in the calculations: ζ = 0 (black line), ζ = 0.02 (red), ζ = 0.04 (blue) and ζ = 0.06 (green). |
In all cases, we recognised the typical behaviour of the convective cores during the MS, which shrinks as hydrogen is converted into helium and then vanishes when the central hydrogen is exhausted. The largest extension (in mass) of this region is ∼0.45 M⊙ when no overshoot is assumed and ∼1.1 M⊙ when ζ = 0.06. Larger values of ζ also imply longer timescales, as higher quantities of hydrogen are transported within the innermost, nuclearly active regions. The duration τH of the H-burning phase changes from τH = 540 Myr for the no-overshoot case to τH = 770 Myr for ζ = 0.06. Roughly, we found that δζ = 0.01 corresponds to an age increase δτH ∼ 40 Myr
The left panel of Fig. 2 shows the evolutionary tracks on the HR diagram of the 2.5 M⊙ model stars reported in Fig. 1. The choice of ζ affects the morphology of the tracks in the region of the turn-off for the reasons discussed earlier in this section and the luminosity of the clump described by the tracks during the core helium burning phase. This effect is clearer in the right panel of Fig. 2, which is a zoom in of the clump region. The thickest part of each track corresponds to the slowest part of the evolution, which accounts for 90% of the overall post H-burning time. The luminosity range spanned by the clump is 40 − 50 L⊙ for the no-overshoot case, 45 − 65 L⊙ for ζ = 0.02, 55 − 75 L⊙ for ζ = 0.04, and 75 − 95 L⊙ for ζ = 0.06.
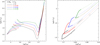 |
Fig. 2. Theoretic HR diagram. Left: evolutionary track of 2.5 M⊙ model star with solar metallicity, calculated with the same values of ζ as Fig. 1. Right: same as left panel but focusing on the clump region. The slowest part of the evolution is highlighted by a thick line. |
The nuclear activity during the MS lifetime alters the chemical composition of the internal regions of the star, which is modified according to the proton capture nucleosynthesis it experiences. The chemical stratification at the end of the MS becomes extremely important for understanding the change taking place in the surface chemistry of the star as a consequence of the FDU. Fig. 3 shows the mass fractions of various chemical species at the end of the core H-burning phase. The figure refers to the 2.5 M⊙ model star calculated with ζ = 0 (black lines in Figs. 1 and 2).
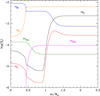 |
Fig. 3. Internal chemical stratification of a model star of 2.5 M⊙ with solar metallicity at the end of the core hydrogen burning phase, calculated by assuming no overshoot (ζ = 0). |
The whole M < 1.5 M⊙ region of the star was touched by the internal nucleosynthesis. We recognised the typical double step in the nitrogen profile, indicating the activation of the full CNO cycle for M < 0.45 M⊙, and the plain CN cycle in the more external part of the core. This was confirmed by the depletion of the oxygen in the centre of the star, which was depleted by a factor of approximately 20 with respect to the initial quantity. Regarding the carbon isotopes, 12C was depleted within the whole internal region of the star, whereas a peak in the 13C profile is present at M ∼ 1.2 M⊙. Both 12C and 13C were heavily depleted by more than a factor 100 in the innermost layers. The chemistry of the region M < 1 M⊙ was also affected by Ne-Na cycling, with the depletion of 22Ne and the synthesis of sodium, whose central abundance exceeded that of the surface by a factor of approximately four.
4. Understanding the evolution of Capella
To reconstruct the history of Capella, we used evolutionary tracks calculated for purposes of the present investigation for the primary and the secondary components using the input described in Sect. 2. The goal of this analysis is to determine the combination of the parameters ζ and β, described in Sects. 2.2 and 2.1, that allow us to reach consistency between the results from modelling and those from observations.
As a first step, we required that the evolutionary tracks of the model stars in the effective temperature-gravity plane reproduce the results obtained from the observations. We considered first the study by Torres et al. (2015), then the more recent work by Takeda et al. (2018). The corresponding observational boxes for the two components of the system are shown in grey and yellow, respectively, in Fig. 4. The fit of the surface gravities led us to select the appropriate range of values of ζ. The choice of β mainly affects the effective temperature. Thus, possible changes with respect to the value required to reproduce the evolution of the Sun were considered only in the case that the effective temperatures of the stars were not reproduced by modelling.
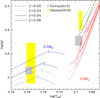 |
Fig. 4. Evolutionary tracks on the log(Teff)−log(g) plane of model stars of mass 2.5 M⊙ (blue lines) and 2.6 M⊙ (red lines), calculated by assuming different values of the overshoot parameter ζ. The green line refers to a 2.6 M⊙ model star obtained by assuming ζ = 0.06 and an FST parameter β = 0.27. The grey and yellow rectangles indicate the error boxes for the two components of Capella given, respectively, in Torres et al. (2015) and Takeda et al. (2018). |
The second step of this analysis was to further restrict the range of parameters to be considered by requiring that the model stars of the primary and secondary components evolve through the observational boxes shown in Fig. 4 at the same time. This would allow us to determine of the age of the system. The final step of this procedure was to check the consistency between the expected change of the surface chemistry, driven by the FDU, and the measured surface abundances of the various chemical species.
4.1. The determination of core extra mixing
Based on the highly precise (∼0.3) masses obtained by Torres et al. (2015) and reported in Table 1, we first started by considering model stars of mass 2.6 M⊙ and 2.5 M⊙ for the primary and secondary stars. This choice implicitly assumes that negligible mass loss occurred during the previous evolutionary phases. We also considered the possibility that the primary star was initially more massive, thus invoking some mass loss during the RGB ascending.
Figure 4 shows the evolutionary tracks of model stars of mass 2.5 M⊙ and 2.6 M⊙ calculated with different values of ζ. The observational boxes for both components of Capella, as found by Torres et al. (2015), are shown as grey rectangles. From the results shown in Fig. 4, we deduced that only values of ζ in the 0.03–0.04 range can be considered. Values of ζ outside of this range do not allow a fitting of the surface gravity (hence the luminosity) of both stars to be performed.
As discussed previously, we also required that the two stars evolve through their respective observational boxes at the same epoch. In Fig. 5, we show the evolution of the surface gravity of different model stars calculated with different values of ζ. The surface gravities derived by Torres et al. (2015) are shown as coloured regions. We observed in Fig. 5 that consistency is found in the ζ = 0.04 case, which leads to an estimated age of 710 Myr. This is more evident in the right panel of Fig. 5, which is focussed on the region inside the black box in the left panel. We note that this choice corresponds to an assumed instantaneous extra mixing from the core of ∼0.25 HP.
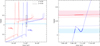 |
Fig. 5. Time variation of the log(g) of model stars of mass 2.5 M⊙ (blue lines) and 2.6 M⊙ (red lines) calculated by assuming ζ = 0.03 and ζ = 0.04. The coloured regions indicate the error associated with the derivation of the surface gravity for the two components of Capella (pink – primary, cyan – secondary) given in Torres et al. (2015). The right panel shows a zoom in of the black box in the left panel, and the thick sections of the red and blue lines highlight the simultaneous fit of both components. |
We note that adopting ζ = 0.03 did not allow us to perform a simultaneous fit of both components. Indeed, the age derived in this case on the basis of the modelling of the secondary star (i.e., 670 Myr) is at odds with the age derived for the primary star, as the latter is expected to reach the observed gravities only during the final part of the clump evolution, that is, at an age of 710 Myr.
For what concerns the choice of the parameter β entering the expression of the mixing length in the FST modelling, the results reported in Fig. 4 suggest that adopting β = 0.2 allows for the reproduction of the effective temperatures derived for both components of Capella, although a slightly higher value cannot be ruled out on the basis of the present analysis. This is the first confirmation, to date, that the same quantity originally derived by Canuto & Mazzitelli (1991) to reproduce the evolution of the Sun can be applied in a different physical situation, such as the convective envelope of a star evolving through the RGB and the core helium burning phase.
According to the present analysis, Capella is ∼80 Myr younger than found by Torres et al. (2015) based on the PARSEC isochrones of Bressan et al. (2012). The reason for this difference is mainly due to the different chemistry adopted: Torres et al. (2015) used a slightly sub-solar metallicity and initial helium Y = 0.272, whereas we use solar metallicity and helium Y = 0.268. Both the higher metallicity and the lower helium adopted here favour older ages, of the order of ∼40 Myr. Further differences with respect to the PARSEC models that explain the residual age difference between us and Torres et al. (2015) are the adopted solar mixture (we use the mixture by Lodders et al. 2009, whereas Bressan et al. 2012 assumed the element distribution by Grevesse & Sauval 1998) and the prescription for core overshoot.
4.2. A test of mass loss during the RGB
We also considered the possibility that the primary star experienced mass loss during the previous evolutionary phases so that it descends from a higher mass progenitor. On the numerical side, when a plain mass loss description such as Reimers’ is adopted, the decrease in the total mass by the time that the star reaches the core He-burning phase is within 0.01 M⊙ for any reasonable choice of the free parameter entering the Reimers recipe. However, we decided to investigate the effects of some mass loss even significantly higher than found via the Reimers description.
We first tested a case where the initial mass is 2.7 M⊙. In this case, we found consistency with the temperature and gravity derived from the observations of the primary by assuming ζ = 0.035. However, this choice would pose severe issues on the side of the evolutionary times, as the secondary star would attain the corresponding observational quantities approximately 50 Myr ahead of the primary star. To maintain simultaneity, we should claim that the overshoot from the core of the secondary star was smaller, of the order of ζ = 0.02. However, as discussed earlier in this section (see also Fig. 4), this choice was ruled out, as it does not allow for the fitting of the surface gravity of the secondary component given in Torres et al. (2015).
4.3. The study by Takeda et al. (2018)
Takeda et al. (2018) recently published a new study on Capella where the elemental abundances were estimated by the disentangled spectrum of the two components. The effective temperatures found by Takeda et al. (2018) are in substantial agreement with those given in Torres et al. (2015), with the only difference being that the error associated with the determination of the temperature of the primary, 23 K, is significantly lower than the errors reported in the study by Torres et al. (2015). A comparison of the surface gravities derived in the two studies showed that the gravities derived in Takeda et al. (2018) are significantly lower than those given by Torres et al. (2015). In the case of the secondary star, consistency was found when the error bars were taken into account, while in the case of the primary, there is a difference of δ(log g) = 0.17 between the two studies, which can be reduced at most to δ(log g) = 0.05 when the corresponding error bars are considered.
To reproduce the surface gravities given by Takeda et al. (2018), we calculated new evolutionary sequences for both components of Capella with values of ζ higher than those previously discussed. This was done because the lower gravities of the primary implied higher luminosities. We note that given the large error associated with the derivation of the surface gravity of the secondary star, this part of the investigation was essentially focussed on the fit of the observed parameters of the primary.
Consistency with the surface gravity of the primary star was found when a 2.6 M⊙ is evolved with ζ = 0.06, which corresponds to an instantaneous overshoot from the outer border of the convective core during the H-burning phase of 0.36 HP. As shown in Fig. 4, in this case the effective temperature during the helium burning phase is slightly cooler with respect to the values given in Takeda et al. (2018), which required the use of a higher FST parameter. Using β = 0.27 allowed for an accurate fit of the results from the observations (green track in Fig. 4).
4.4. The final mass of the primary component of Capella
The main difference between the conclusions drawn when using the gravities given in Torres et al. (2015) and those by Takeda et al. (2018) is the extension of the extra-mixed zone during the MS evolution. In the former case, we found ζ = 0.04, which corresponds to a 0.25 HP size, whereas in the latter case we derived ζ = 0.06, which corresponds to 0.37 HP.
To test the possibility of discriminating on the basis of the initial-final mass relationship derived by Cummings et al. (2019), we extended the computations of our model stars of mass 2.6 M⊙ until the first thermal pulse, thus at the beginning of the asymptotic giant branch (AGB) phase. The purpose of this test was to check whether either of the two values given above would lead to inconsistency with the Cummings et al. (2019) law.
In the ζ = 0.04 case, we found a core mass of 0.53 M⊙, whereas when ζ = 0.06 was adopted, we found 0.57 M⊙. Unfortunately, this difference prevented any possibility of discriminating between the two scenarios. As shown in Ventura et al. (1998), model stars that attain core masses at the beginning of the AGB evolution similar to those mentioned above complete the AGB phase with a final mass of ∼0.7 M⊙, which is nonetheless consistent with the expectations based on the study by Cummings et al. (2019).
4.5. The surface chemical composition
In Fig. 6, we describe the evolution of the primary star during the evolutionary phases close to the occurrence of the FDU. The figure refers to the 2.6 M⊙ model star calculated with ζ = 0.04, discussed earlier in this section. The quantities shown are the mass of the region of the star below the bottom of the convective envelope, the surface sodium, and the 12C/13C and C/N ratios.
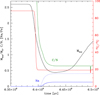 |
Fig. 6. Time variation of the mass at the bottom of the convective envelope (black, scale on the left), of the surface sodium (blue, scale on the left), and of the carbon isotopic ratio (red, scale on the right) of a 2.6 M⊙ model star calculated with an overshoot parameter of ζ = 0.04. The plot is focussed on the epoch during which the FDU takes place. The dashed blue line indicates the variation of the surface sodium abundances of a model star, calculated by assuming that the initial neon is enhanced by a factor of three. |
During the FDU, the convective envelope penetrates inwards and grows in mass up to and including approximately 2 M⊙ of the star. The base of the convective mantle reaches regions of the star whose chemical composition was altered by nuclear activity. The typical stratification of the star at the end of the core hydrogen burning phase, before the occurrence of the FDU, is shown in Fig. 3. The occurrence of the FDU favours an increase in the surface nitrogen and sodium, a decrease in the surface carbon, and an overall increase in 12C/13C. The latter quantity proved to be a severe issue in our attempt of reconstructing the previous history of Capella because the value given by Tomkin et al. (1976), 12C/13C ∼ 27, is significantly higher than what was found from stellar evolution modelling.
Agreement between the theoretical expectations and the observational results is now possible thanks to the recent work by Sablowski et al. (2019). Based on LBT and VATT observations carried out with PEPSI, the authors found that the surface 12C/13C of the primary star is 17.8 ± 1.9, which is significantly lower than what was found by Tomkin et al. (1976). The reason for this difference is likely due to the fact that Tomkin et al. (1976) used an incorrect light ratio between the two components, thus underestimating the equivalent width measurements of the CN lines by 6 − 11% (Torres et al. 2009). In contrast, the analysis by Sablowski et al. (2019) benefited from the remarkable performance of PEPSI, which made it possible to obtain ultra high resolution spectra with a high signal-to-noise ratio (∼2000), thus allowing for an estimation of 12C/13C for the primary star of Capella with unprecedented reliability. As shown in Fig. 6, the new measurement is in agreement with results from our stellar evolution modelling. This result indicates that the surface chemistry of the primary star was altered by the effects of the FDU only, with no additional contribution from some other mechanism often invoked to occur during the RGB phase to explain, for example, the low 12C/13C detected in open cluster stars (Gilroy & Brown 1991). This outcome is consistent with the predictions by Charbonnel & Lagarde (2010), who found that neither thermohaline nor rotational mixing substantially alter the surface chemistry of stars in the mass domain explored here during the RGB phase.
Concerning the C/N ratio, as shown in Fig. 6, we found that the expected value (∼0.65) is slightly in excess of the value reported in Torres et al. (2015), C/N ∼ 0.57. This might be a consequence of the fact that the lines used to estimate the C and N abundances do not fully represent the abundances in the photosphere (see discussion in Torres et al. 2015, on this argument).
Regarding the surface sodium of the primary, the results from Torres et al. (2015) and Takeda et al. (2018) differ significantly. While the star shows no sign of Na enrichment according to Torres et al. (2015), Takeda et al. (2018) found that the primary star was sodium enriched by 0.4 dex. The latter result can be hardly explained within the context of the FDU, as the expected increase in the surface sodium is δ[Na/Fe] ∼ 0.2 (see Fig. 6). The assumption of extra mixing is of little help here, as the consequent increase in the final [Na/Fe] is within 0.05 dex. Among the various possibilities, we took into account that the neon is underestimated such that the initial neon is higher than that proposed by Lodders et al. (2009). We explored various possibilities and found that a sodium enrichment in agreement with the results from Takeda et al. (2018) can be obtained by assuming an initial neon a factor of three higher than that in Lodders et al. (2009). A discussion regarding the initial neon of solar metallicity stars is definitively beyond the scope of the present investigation; however, we point out that the neon enhancement invoked here, of the order of +0.5 dex, is consistent with the conclusions reached by Bahcall et al. (2005), where a higher neon abundance is required to reconcile the predictions from solar modelling with heliosismological measurements. Thus, we leave this problem open.
The results shown in Fig. 6 were obtained by assuming extra mixing from the convective core during the H-burning and from the bottom of the envelope during the RGB phase. The latter assumption has no effect on the evolutionary timescale nor on the excursion of the evolutionary track across the HR diagram, but it might potentially alter the extent of the inwards penetration of the envelope and thus the change in the surface chemical composition following the occurrence of the FDU. To determine whether this occurred, we calculated further evolutionary sequences where we explored different values of the ζ parameter in the 0 − 0.06 range in order to describe the overshoot from the base of the surface convection. For the core, we used ζ = 0.04 in all cases.
In the no-overshoot case, we found differences in the final abundances of 12C, 13C, and 14N of the order of 10%, while the final sodium was found to be 15% lower than for the ζ = 0.04 case. In this case, the 12C/13C and C/N ratio are significantly higher than those resulting from the spectroscopic analysis, and the discrepancy in the surface sodium between the theoretical model and the observations is amplified. When ζ is chosen to be in the 0.02 − 0.06 range, the results turn out to be almost independent of ζ. The reason for this is that for any choice of ζ ≥ 0.02, the base of the mixed regions approaches the H-burning shell, and thus convection is pushed outwards.
This exploration shows that some extra mixing from the base of the convective zone is required to reproduce the observations. However, it is not possible to assess the extension of the extra-mixed zone in detail.
5. Conclusions
We reconstructed the evolutionary history of stars forming the binary system Capella (α Aurigae) by means of comparison between results from stellar evolution modelling and those derived from observations. The conclusions we reach in this work are based on the analysis of the primary star, which is likely evolving through the core helium burning phase and has already experienced a change in its surface chemical composition favoured by the occurrence of the FDU. In contrast, the secondary star is currently evolving through the early phase of the RGB. Thus, its derived luminosity and chemical composition turned out to be of little help in this context.
The results from the present analysis indicate that Capella formed ≃710 Myr ago. The comparison between the derived surface gravity and effective temperature of the primary star confirm that extra mixing from the convective core occurred during the MS phase, with the extension of the extra-mixed zone being of the order of 0.25 HP. This result is in agreement with previous works focussed on the determination of the size of the convective cores of stars with a mass similar to that of Capella’s components. Regarding the FST convection modelling used in this work, we find that the expression for the mixing length required to reproduce the evolution of the Sun is consistent with the effective temperatures found for the primary and secondary stars of Capella.
The estimate of the core overshoot must be reconsidered upwards if considering the more recent lower estimate of the surface gravity (hence a higher luminosity) of the primary component. This estimate leads to a larger size of the overshoot zone, of the order of 0.37 HP.
The currently observed surface chemistry of the primary star can be explained as being the result of the occurrence of the FDU only. We confirm previous results from detailed stellar evolution modelling that during the RGB phase, stars of mass ∼2.5 M⊙ experience none of the additional mixing mechanisms, such as thermohaline and rotational mixing, likely taking place in the lower mass counterparts. This conclusion relies on the observed C/N and 12C/13C ratios, the latter having been recently found using high resolution spectra obtained with PEPSI at LBT and VATT. Recent results from a detailed model atmosphere analysis of the disentangled spectrum outline a significant sodium enhancement, of the order of 0.4 dex, which we tentatively explain as being due to a higher neon content of the star.
Acknowledgments
EM is indebted to Guillermo Torres and Yoichi Takeda for the helpful discussions. EM acknowledges support from the INAF research project LBT – Supporto Arizona Italia. MT acknowledges support from the ERC Consolidator Grant funding scheme (project Asterochronometry, https://www.asterochronometry.eu, G.A. No. 772293).
References
- Bahcall, J. N., Basu, S., & Serenelli, A. M. 2005, ApJ, 631, 1281 [NASA ADS] [CrossRef] [Google Scholar]
- Barmina, R., Girardi, L., & Chiosi, C. 2002, A&A, 385, 847 [NASA ADS] [CrossRef] [EDP Sciences] [Google Scholar]
- Bertelli, G., Bressan, A., Chiosi, C., et al. 1993, ApJ, 412, 160 [CrossRef] [Google Scholar]
- Bressan, A., Bertelli, G., & Chiosi, C. 1981, A&A, 102, 25 [NASA ADS] [Google Scholar]
- Bressan, A., Marigo, P., Girardi, L., et al. 2012, MNRAS, 427, 127 [NASA ADS] [CrossRef] [Google Scholar]
- Brocato, E., Buonanno, R., Castellani, V., et al. 1989, ApJs, 71, 25 [NASA ADS] [CrossRef] [Google Scholar]
- Caloi, V., & Mazzitelli, I. 1993, A&A, 271, 139 [NASA ADS] [Google Scholar]
- Canuto, V. M., & Mazzitelli, I. 1991, ApJ, 370, 295 [NASA ADS] [CrossRef] [Google Scholar]
- Canuto, V. M., Goldman, I., & Mazzitelli, I. 1996, ApJ, 473, 550 [NASA ADS] [CrossRef] [Google Scholar]
- Castellani, V., Giannone, P., & Renzini, A. 1971, Ap&SS, 10, 355 [NASA ADS] [CrossRef] [Google Scholar]
- Charbonnel, C., & Lagarde, N. 2010, A&A, 522, A19 [Google Scholar]
- Chiosi, C., Bertelli, G., Meylan, G., et al. 1989, A&A, 219, 167 [NASA ADS] [Google Scholar]
- Chiosi, C., Bertelli, G., & Bressan, A. 1992, ARA&A, 30, 235 [NASA ADS] [CrossRef] [Google Scholar]
- Claret, A., & Torres, G. 2017, ApJ, 849, 18 [Google Scholar]
- Claret, A., & Torres, G. 2019, ApJ, 876, 134 [Google Scholar]
- Cloutman, L. D., & Eoll, J. G. 1976, ApJ, 206, 548 [NASA ADS] [CrossRef] [Google Scholar]
- Charbonnel, C., & Lagarde, N. 2010, A&A, 522, A10 [CrossRef] [EDP Sciences] [Google Scholar]
- Cummings, J. D., Kalirai, J. S., Choi, J., et al. 2019, ApJ, 871, L18 [NASA ADS] [CrossRef] [Google Scholar]
- Dell’Agli, F., Ventura, P., Schneider, R., et al. 2015, MNRAS, 447, 2992 [Google Scholar]
- Dell’Agli, F., Marini, E., D’Antona, F., et al. 2021, MNRAS, 502, L35 [CrossRef] [Google Scholar]
- Freytag, B., Ludwig, H.-G., & Steffen, M. 1996, A&A, 313, 497 [Google Scholar]
- Fuhrmann, K. 2011, ApJ, 742, 42 [CrossRef] [Google Scholar]
- Gilroy, K. K., & Brown, J. A. 1991, ApJ, 371, 578 [NASA ADS] [CrossRef] [Google Scholar]
- Grevesse, N., & Sauval, A. J. 1998, Space Sci. Rev., 85, 161 [Google Scholar]
- Hedrosa, R. P., Abia, C., Busso, M., et al. 2013, ApJ, 768, L11 [NASA ADS] [CrossRef] [Google Scholar]
- Herwig, F., Schoenberner, D., & Bloecker, T. 1998, A&A, 340, L43 [NASA ADS] [Google Scholar]
- Lodders, K., Palme, H., & Gail, H.-P. 2009, Landolt Börnstein, 4B, 712 [Google Scholar]
- Morales, L. M., Sandquist, E. L., Schaefer, G. H., et al. 2022, AJ, 164, 34 [NASA ADS] [CrossRef] [Google Scholar]
- Pinsonneault, M. 1997, ARA&A, 35, 557 [NASA ADS] [CrossRef] [Google Scholar]
- Renzini, A. 1987, A&A, 188, 49 [NASA ADS] [Google Scholar]
- Sablowski, D. P., Järvinen, S., Ilyin, I., & Strassmeier, K. G. 2019, A&A, 622, L11 [NASA ADS] [CrossRef] [EDP Sciences] [Google Scholar]
- Strassmeier, K. G., Reegen, P., & Granzer, T. 2001, Astron. Nachr., 322, 115 [NASA ADS] [CrossRef] [Google Scholar]
- Strassmeier, K. G., Ilyin, I., Järvinen, A., Weber, M., Woche, M., Barnes, S. I., Bauer, S.-M., et al. 2015, AN, 336, 324 [NASA ADS] [Google Scholar]
- Takeda, Y., Hashimoto, O., & Honda, S. 2018, ApJ, 862, 57 [NASA ADS] [CrossRef] [Google Scholar]
- Testa, V., Ferraro, F. R., Chieffi, A., et al. 1999, AJ, 118, 2839 [NASA ADS] [CrossRef] [Google Scholar]
- Tomkin, J., Luck, R. E., & Lambert, D. L. 1976, ApJ, 210, 694 [NASA ADS] [CrossRef] [Google Scholar]
- Torres, G., Claret, A., & Young, P. A. 2009, ApJ, 700, 1349 [NASA ADS] [CrossRef] [Google Scholar]
- Torres, G., Claret, A., Pavlovski, K., & Dotter, A. 2015, ApJ, 807, 26 [NASA ADS] [CrossRef] [Google Scholar]
- Ventura, P., & D’Antona, F. 2009, A&A, 499, 835 [NASA ADS] [CrossRef] [EDP Sciences] [Google Scholar]
- Ventura, P., Zeppieri, A., Mazzitelli, I., et al. 1998, A&A, 334, 953 [NASA ADS] [Google Scholar]
- Ventura, P., Dell’Agli, F., Schneider, R., et al. 2014, MNRAS, 439, 977 [NASA ADS] [CrossRef] [Google Scholar]
- Ventura, P., Karakas, A., Dell’Agli, F., et al. 2018, MNRAS, 475, 2282 [NASA ADS] [Google Scholar]
- Weber, M., & Strassmeier, K. G. 2011, A&A, 531, A89 [NASA ADS] [CrossRef] [EDP Sciences] [Google Scholar]
All Tables
All Figures
|
Fig. 1. Variation over time of the mass of the central region of the star mixed by convective currents of a model star with an initial mass of 2.5 M⊙ and solar metallicity during the hydrogen burning phase. The various lines correspond to the different values of ζ adopted in the calculations: ζ = 0 (black line), ζ = 0.02 (red), ζ = 0.04 (blue) and ζ = 0.06 (green). |
| In the text | |
|
Fig. 2. Theoretic HR diagram. Left: evolutionary track of 2.5 M⊙ model star with solar metallicity, calculated with the same values of ζ as Fig. 1. Right: same as left panel but focusing on the clump region. The slowest part of the evolution is highlighted by a thick line. |
| In the text | |
|
Fig. 3. Internal chemical stratification of a model star of 2.5 M⊙ with solar metallicity at the end of the core hydrogen burning phase, calculated by assuming no overshoot (ζ = 0). |
| In the text | |
|
Fig. 4. Evolutionary tracks on the log(Teff)−log(g) plane of model stars of mass 2.5 M⊙ (blue lines) and 2.6 M⊙ (red lines), calculated by assuming different values of the overshoot parameter ζ. The green line refers to a 2.6 M⊙ model star obtained by assuming ζ = 0.06 and an FST parameter β = 0.27. The grey and yellow rectangles indicate the error boxes for the two components of Capella given, respectively, in Torres et al. (2015) and Takeda et al. (2018). |
| In the text | |
|
Fig. 5. Time variation of the log(g) of model stars of mass 2.5 M⊙ (blue lines) and 2.6 M⊙ (red lines) calculated by assuming ζ = 0.03 and ζ = 0.04. The coloured regions indicate the error associated with the derivation of the surface gravity for the two components of Capella (pink – primary, cyan – secondary) given in Torres et al. (2015). The right panel shows a zoom in of the black box in the left panel, and the thick sections of the red and blue lines highlight the simultaneous fit of both components. |
| In the text | |
|
Fig. 6. Time variation of the mass at the bottom of the convective envelope (black, scale on the left), of the surface sodium (blue, scale on the left), and of the carbon isotopic ratio (red, scale on the right) of a 2.6 M⊙ model star calculated with an overshoot parameter of ζ = 0.04. The plot is focussed on the epoch during which the FDU takes place. The dashed blue line indicates the variation of the surface sodium abundances of a model star, calculated by assuming that the initial neon is enhanced by a factor of three. |
| In the text | |
Current usage metrics show cumulative count of Article Views (full-text article views including HTML views, PDF and ePub downloads, according to the available data) and Abstracts Views on Vision4Press platform.
Data correspond to usage on the plateform after 2015. The current usage metrics is available 48-96 hours after online publication and is updated daily on week days.
Initial download of the metrics may take a while.