Open Access
Fig. 2.
Download original image
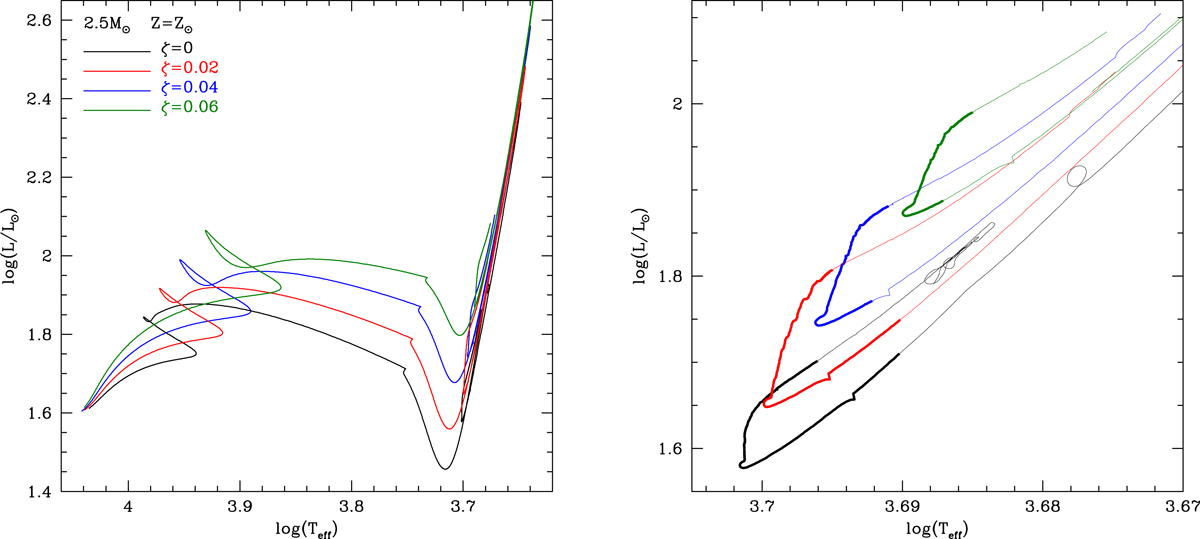
Theoretic HR diagram. Left: evolutionary track of 2.5 M⊙ model star with solar metallicity, calculated with the same values of ζ as Fig. 1. Right: same as left panel but focusing on the clump region. The slowest part of the evolution is highlighted by a thick line.
Current usage metrics show cumulative count of Article Views (full-text article views including HTML views, PDF and ePub downloads, according to the available data) and Abstracts Views on Vision4Press platform.
Data correspond to usage on the plateform after 2015. The current usage metrics is available 48-96 hours after online publication and is updated daily on week days.
Initial download of the metrics may take a while.