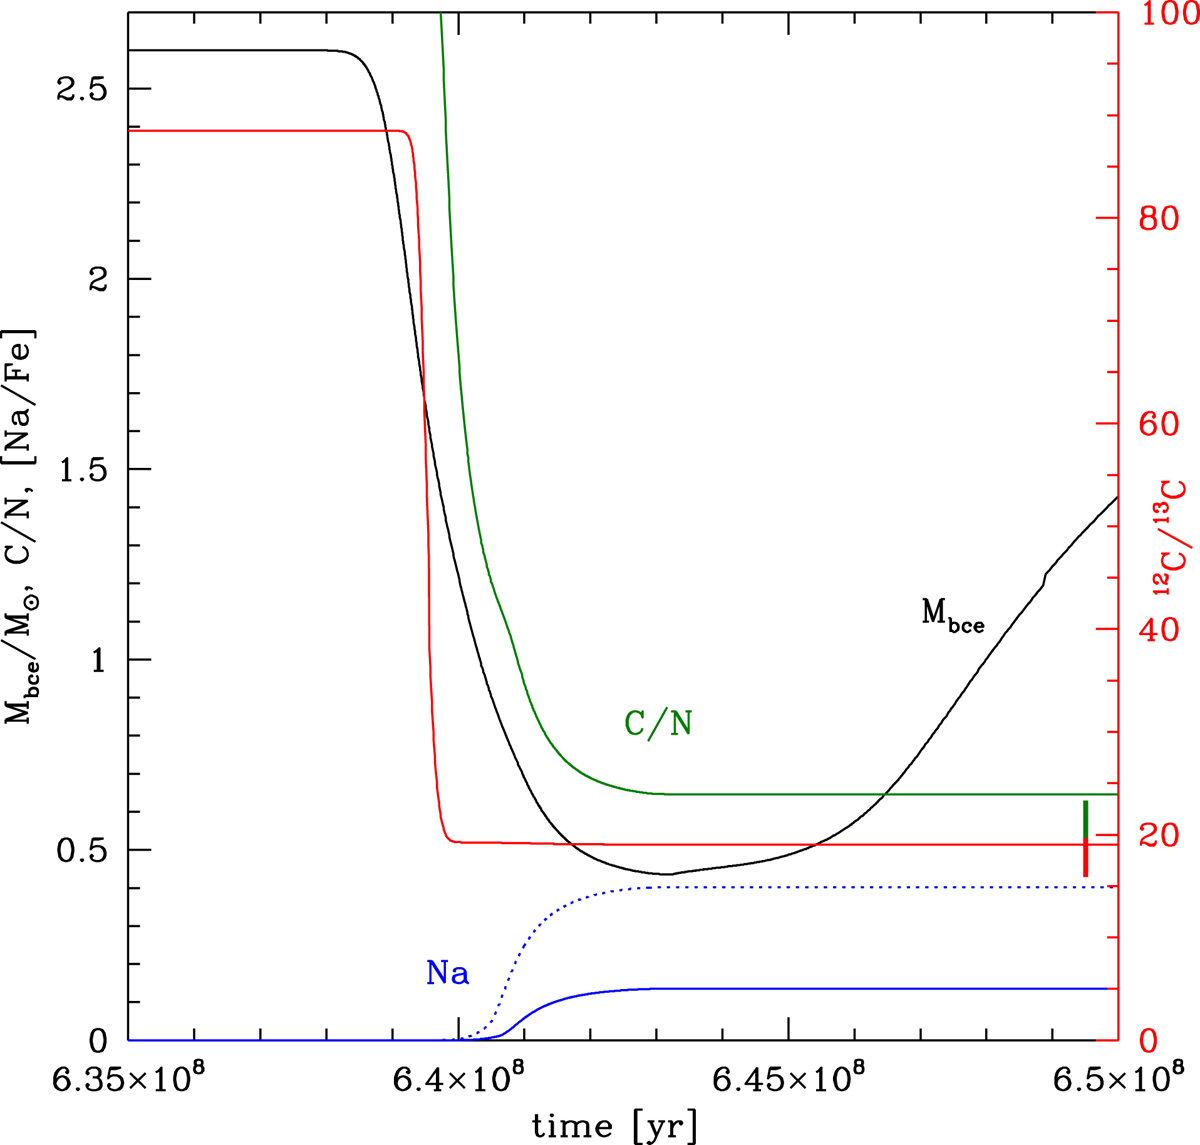
Fig. 6.
Download original image
Time variation of the mass at the bottom of the convective envelope (black, scale on the left), of the surface sodium (blue, scale on the left), and of the carbon isotopic ratio (red, scale on the right) of a 2.6 M⊙ model star calculated with an overshoot parameter of ζ = 0.04. The plot is focussed on the epoch during which the FDU takes place. The dashed blue line indicates the variation of the surface sodium abundances of a model star, calculated by assuming that the initial neon is enhanced by a factor of three.
Current usage metrics show cumulative count of Article Views (full-text article views including HTML views, PDF and ePub downloads, according to the available data) and Abstracts Views on Vision4Press platform.
Data correspond to usage on the plateform after 2015. The current usage metrics is available 48-96 hours after online publication and is updated daily on week days.
Initial download of the metrics may take a while.