Fig. 5.
Download original image
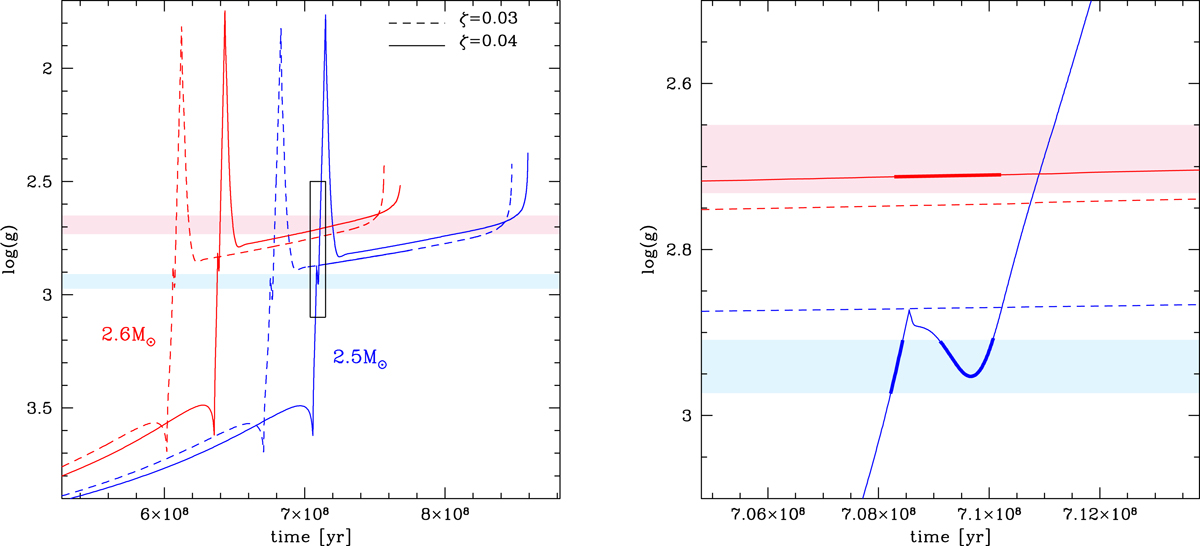
Time variation of the log(g) of model stars of mass 2.5 M⊙ (blue lines) and 2.6 M⊙ (red lines) calculated by assuming ζ = 0.03 and ζ = 0.04. The coloured regions indicate the error associated with the derivation of the surface gravity for the two components of Capella (pink – primary, cyan – secondary) given in Torres et al. (2015). The right panel shows a zoom in of the black box in the left panel, and the thick sections of the red and blue lines highlight the simultaneous fit of both components.
Current usage metrics show cumulative count of Article Views (full-text article views including HTML views, PDF and ePub downloads, according to the available data) and Abstracts Views on Vision4Press platform.
Data correspond to usage on the plateform after 2015. The current usage metrics is available 48-96 hours after online publication and is updated daily on week days.
Initial download of the metrics may take a while.