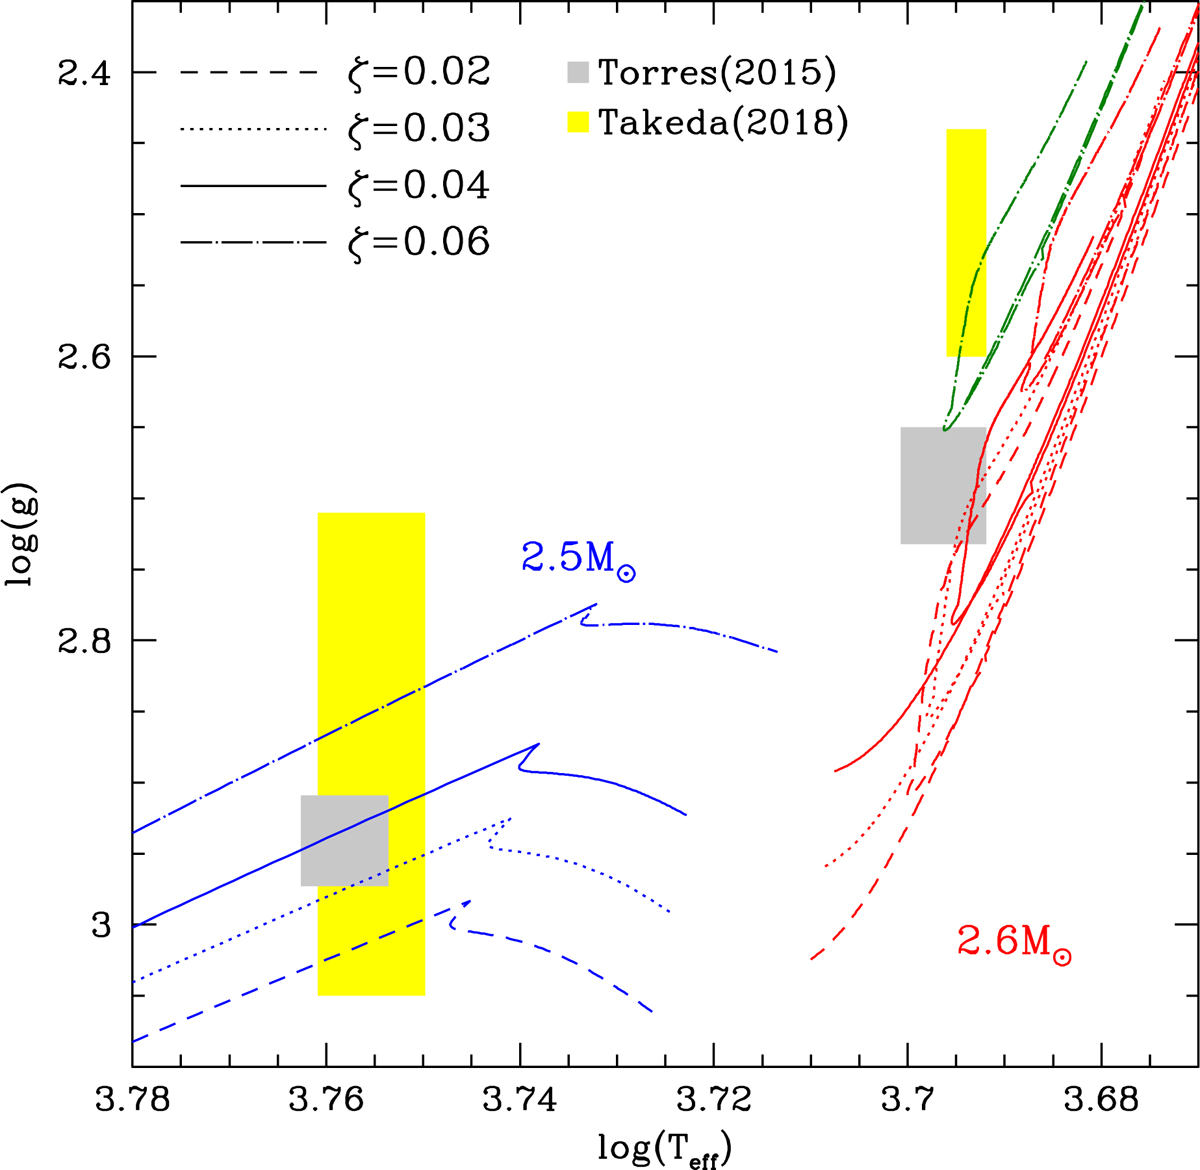
Fig. 4.
Download original image
Evolutionary tracks on the log(Teff)−log(g) plane of model stars of mass 2.5 M⊙ (blue lines) and 2.6 M⊙ (red lines), calculated by assuming different values of the overshoot parameter ζ. The green line refers to a 2.6 M⊙ model star obtained by assuming ζ = 0.06 and an FST parameter β = 0.27. The grey and yellow rectangles indicate the error boxes for the two components of Capella given, respectively, in Torres et al. (2015) and Takeda et al. (2018).
Current usage metrics show cumulative count of Article Views (full-text article views including HTML views, PDF and ePub downloads, according to the available data) and Abstracts Views on Vision4Press platform.
Data correspond to usage on the plateform after 2015. The current usage metrics is available 48-96 hours after online publication and is updated daily on week days.
Initial download of the metrics may take a while.