Fig. 1.
Download original image
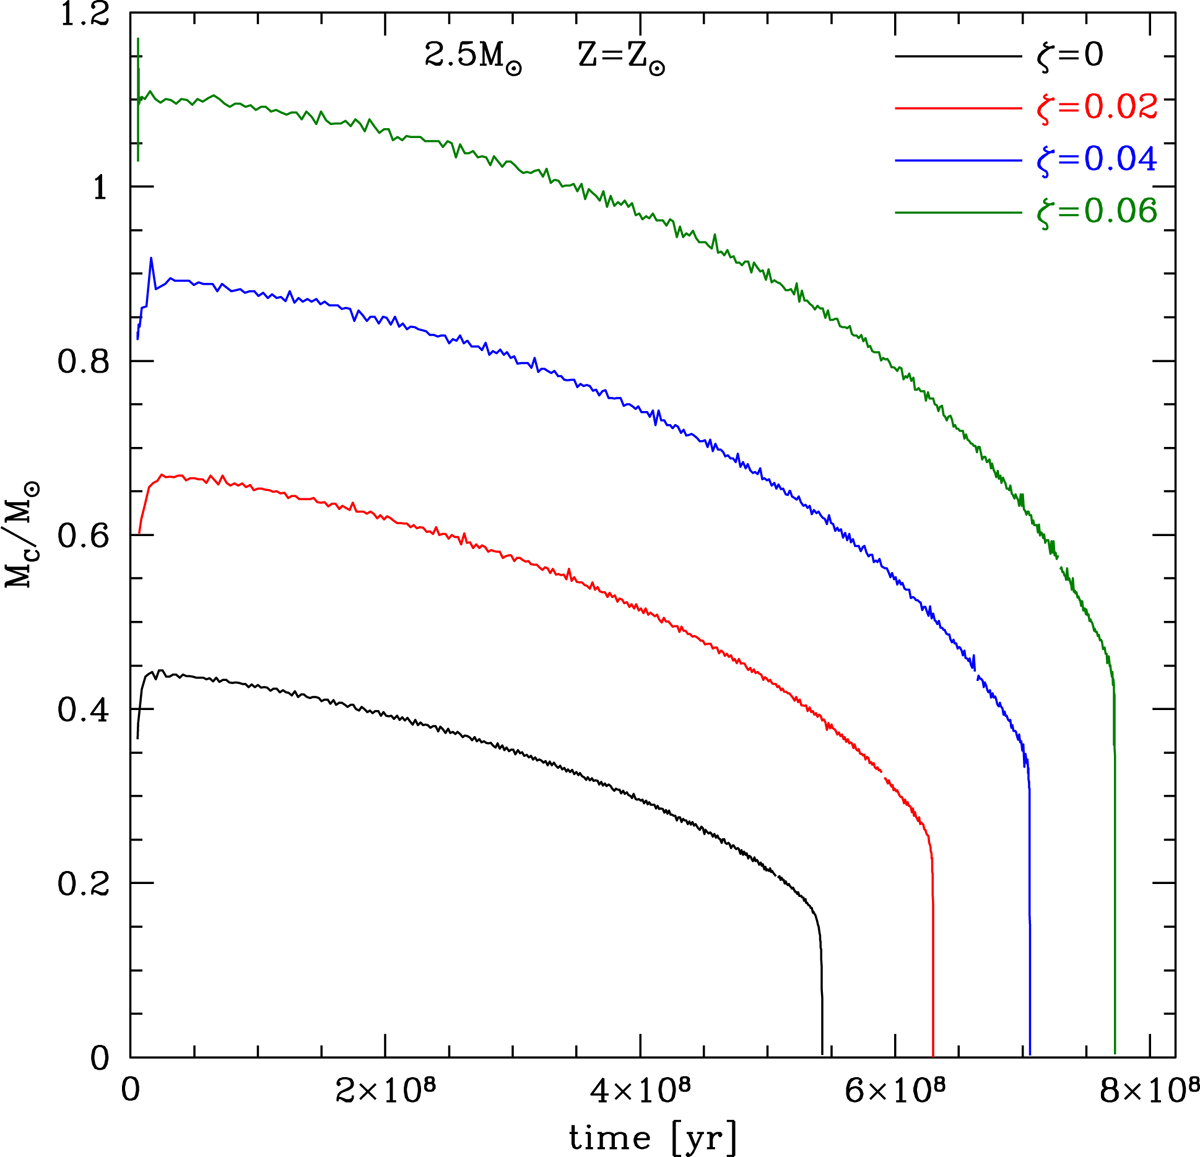
Variation over time of the mass of the central region of the star mixed by convective currents of a model star with an initial mass of 2.5 M⊙ and solar metallicity during the hydrogen burning phase. The various lines correspond to the different values of ζ adopted in the calculations: ζ = 0 (black line), ζ = 0.02 (red), ζ = 0.04 (blue) and ζ = 0.06 (green).
Current usage metrics show cumulative count of Article Views (full-text article views including HTML views, PDF and ePub downloads, according to the available data) and Abstracts Views on Vision4Press platform.
Data correspond to usage on the plateform after 2015. The current usage metrics is available 48-96 hours after online publication and is updated daily on week days.
Initial download of the metrics may take a while.