| Issue |
A&A
Volume 676, August 2023
|
|
|---|---|---|
| Article Number | A47 | |
| Number of page(s) | 8 | |
| Section | Galactic structure, stellar clusters and populations | |
| DOI | https://doi.org/10.1051/0004-6361/202345907 | |
| Published online | 07 August 2023 | |
UOCS
X. Rich collection of post-mass-transfer systems in NGC 6791⋆
1
Helmholtz-Institut für Strahlen- und Kernphysik, Universität Bonn, Nussallee 14-16, 53115 Bonn, Germany
e-mail: This email address is being protected from spambots. You need JavaScript enabled to view it.
2
Inter-University Centre for Astronomy and Astrophysics (IUCAA), Post Bag 4, Ganeshkhind, Pune 411007, India
3
Indian Institute of Astrophysics, Koramangala II Block, Bangalore 560034, India
e-mail: This email address is being protected from spambots. You need JavaScript enabled to view it.
; This email address is being protected from spambots. You need JavaScript enabled to view it.
Received:
13
January
2023
Accepted:
27
June
2023
Abstract
Aims. NGC 6791 is one of the richest old open clusters in the Milky Way. Its position above the Galactic plane and its number density make it an interesting middle ground between Galactic open and globular clusters. We aim to detect the UV-bright population of NGC 6791 using AstroSat/UVIT images in near-UV and far-UV filters and characterise the known post-mass-transfer systems such as blue straggler stars (BSSs).
Methods. We identified 20 members with large UV flux (out of 91 cluster members among 1180 detections) – which is suggestive of binarity, interactions, or stellar activity – using a multi-wavelength spectral energy distribution analysis.
Results. We characterised 62 isolated cluster members, including five hot subdwarfs (sdA/sdB). Additionally, we detected ten sdA/sdB/extremely low-mass (ELM) white dwarf-type candidates hidden alongside other cluster members. Additionally, we report the discovery of four candidate blue lurkers, which are main sequence stars with mass accretion history.
Conclusions. We report that this cluster has a variety of stellar (pre-)remnants, such as sdBs, sdAs, and ELM white dwarfs, which are by-products of binary evolution. These are likely to be post-mass-transfer binaries found throughout the evolutionary phases from the main sequence to the post-horizontal branch. Therefore, this dynamically old open cluster is unique, making it an ideal test bed for dynamical studies.
Key words: binaries: general / open clusters and associations: individual: NGC 6791 / ultraviolet: stars / catalogs
Full Table 2 is only available at the CDS via anonymous ftp to cdsarc.cds.unistra.fr (130.79.128.5) or via https://cdsarc.cds.unistra.fr/viz-bin/cat/J/A+A/676/A47
© The Authors 2023
 Open Access article, published by EDP Sciences, under the terms of the Creative Commons Attribution License (https://creativecommons.org/licenses/by/4.0), which permits unrestricted use, distribution, and reproduction in any medium, provided the original work is properly cited.
This article is published in open access under the Subscribe to Open model. This email address is being protected from spambots. You need JavaScript enabled to view it. to support open access publication.
1. Introduction
Open clusters are integral to studies of stellar populations because of their relative homogeneity (in metallicity and age) and robust cluster membership thanks to precise astrometry. Ultraviolet imaging has proven very useful in identifying optically subluminous stars, such as white dwarfs (WDs) and hot subdwarfs (Sahu et al. 2019; Jadhav et al. 2021; Rao et al. 2022). We are currently conducting an Ultraviolet Imaging Telescope (UVIT) based UVIT Open Cluster Study (UOCS) to understand the UV-bright population, focusing on post-mass-transfer systems. M 67 has been found to be home to multiple extremely low-mass (ELM) WDs, which are products of mass transfer (Sindhu et al. 2019; Jadhav et al. 2019; Subramaniam et al. 2020; Pandey et al. 2021; Vernekar et al. 2023). Similar mass-transfer binaries have been found in NGC 7789 (Vaidya et al. 2022) and NGC 2506 (Panthi et al. 2022). Here, we extend this study to the open cluster NGC 6791 (α2000 = 19h20m53s; δ2000 = +37°46′18″; l = 69 959; b = +10
 904), which is ∼8.5 Gyr old and also one of the metal-rich clusters ([Fe/H] ∼ 0.4) known in the Milky Way (Bossini et al. 2019). It is located at a distance of ∼4.1 Kpc and is a well-studied massive (∼5000 M⊙) open star cluster.
Using ground-based and Kepler photometry and multi-epoch spectroscopy data, Brogaard et al. (2018) identified the binary star V106 as a blue straggler star (BSS) member of NGC 6791. These authors derived the primary mass as 1.67 M⊙, which is more massive than the cluster turn-off mass, and the secondary star as a bloated (proto) ELM helium WD. A detailed study also reveals that V106 is potentially a prototype progenitor of an old field giant masquerading as a young one. Villanova et al. (2018) presented and discussed detailed abundances of 17 evolved stars of NGC 6791 using high-resolution spectra obtained with the Ultraviolet and Visible Echelle Spectrograph at the European Southern Observatory Very Large Telescope and High Resolution Echelle Spectrometer at the Keck telescope. These authors obtained a mean [Fe/H] = +0.313 ± 0.005, in good agreement with recent estimates. Tofflemire et al. (2014) provided the epoch radial velocity (RV) and related results for 280 stars, including main sequence (MS), red giant branch (RGB), and horizontal branch (HB) stars. Jadhav & Subramaniam (2021) identified 47 potential BSSs in NGC 6791 using Gaia DR2 data. Kamann et al. (2019) combined Gaia data with the archival line-of-sight velocities and studied the internal dynamics of the NGC 6791 in three dimensions. Martinez-Medina et al. (2018) performed an orbital analysis within a Galactic model (including spiral arms and a bar) and found that it is plausible that NGC 6791 formed in the inner thin disc or the bulge and was later displaced by radial migration to its current orbit. The birthplace and journey of NGC 6791 are imprinted in its chemical composition, mass-loss, and flat stellar mass function, supporting its origin in the inner thin disc or the bulge.
NGC 6791 has one of the largest populations of BSSs among all known open clusters (Jadhav & Subramaniam 2021). The BSSs result from binary interactions such as collisions (Hills & Day 1976) or mergers (Perets & Fabrycky 2009). However, determining the formation pathway followed by this open cluster is difficult because of the incomplete parameterisation of such systems. The mass of the BSS, stellar rotation, abundance peculiarities, and characteristics of the donor remnant can be used to identify the formation pathway.
In this work, we analysed the UV-bright population of NGC 6791 using multi-wavelength spectral energy distributions (SEDs). In Sect. 2, we provide details of the data and analytical methods, and in Sect. 3 we present our results and their implications. The results are discussed in Sect. 4 and summarised in Sect. 5.
2. Data and analysis
2.1. UVIT data and Gaia membership
We observed NGC 6791 in August 2017 with the Ultraviolet Imaging Telescope (UVIT) onboard AstroSat observatory (proposal ID: A03_008). The UVIT performs observations in far-UV (FUV; 130–180 nm), near-UV (NUV; 200–300 nm), and VIS (350–550 nm) channels. More details of the calibration and instrumentation are presented in Kumar et al. (2012) and Tandon et al. (2017, 2020). The exposure times, source detections, and other observational details are given in Table 1. The UVIT data reduction and astrometry were performed using CCDLAB (Postma & Leahy 2017, 2020). The point spread function photometry of the UVIT images was carried out with IRAF (Tody 1993). Preliminary analysis and cross-matching were performed with TOPCAT (Taylor 2005).
Exposure times in UVIT filters and detected sources.
We used the Gaia DR2 (Gaia Collaboration 2016, 2018)-based membership catalogue by Cantat-Gaudin et al. (2020), which is one of the most recent membership catalogues available, and the inclusion of Gaia DR3 data does not significantly improve the membership for the bright stars targeted in this study. The catalogue contains 1654 members with probability ≥0.6. Figure 1a shows the spatial distribution of the Gaia members. Figure 1b shows the spatial distribution of UVIT-detected sources. The magnitude versus error distribution for UVIT filters is shown in Fig. 1c. Among the Gaia members, 91 are detected in at least one UV filter. The numbers of UV-detected members in individual filters are given in Table 1.
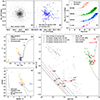 |
Fig. 1. Properties of UVIT photometry and HR diagrams of analysed members. (a) Spatial distribution of Gaia members. (b) Spatial distribution of UV-detected members (blue circles) and UV-detected sources not present in the Gaia EDR3 catalogue (grey dots). (c) Magnitude vs. error plots for UVIT photometry. (d) Gaia CMD showing the Cantat-Gaudin et al. (2020) members (as grey), UV-detected members (as orange), and members with UV excess (as blue). (e) The UV-optical CMD of cluster members. (f) The HR diagram created using SED fitting results. The figure shows 42 sources without UV excess (hollow green circles) and ten sources with UV excess (green filled circles) modelled using single-component SED. The ten sources with double-component fitting are shown as hollow red squares and red-filled squares for A and B components, respectively. Their corresponding IDs are also shown. The isochrone of log(age) = 9.93 (grey curve), the 0.5 M⊙ WD cooling curve (black dashed curve), and the 0.2–0.4 M⊙ WD cooling curves (black dotted curves) are shown wherever needed in (d)–(f). |
2.2. Colour–magnitude diagrams
Figure 1d shows the Gaia colour–magnitude diagrams (CMDs) of NGC 6791. The isochrones shown are generated using PARSEC v3.7 (Bressan et al. 2012) with log(age) = 9.93, [M/H] = 0.4, distance modulus = 13.085 mag and Av = 0.302 mag (Bossini et al. 2019). Also shown are the WD cooling curves (Bédard et al. 2020 and references therein) with a mass of 0.5 M⊙, which is the expected mass of WDs based on the cluster turn-off and WD initial-final mass relation (Cummings et al. 2018). Figure 1d shows that UVIT has detected stars in the MS, RGB, BSS, and hot subdwarf (sdA, sdB) phases. The sources with UV excess (see Sect. 2.3) are present on the MS and RGB. The UV-optical CMD in Fig. 1e shows the UV-detected members in the UVIT/N263M filter.
2.3. Spectral energy distributions
We visually checked the neighbourhoods (∼3″) of all 91 UV-detected sources to remove 29 sources with bright neighbours. We then constructed the SEDs of 62 isolated sources using AstroSat/UVIT, Gaia EDR3 (Gaia Collaboration 2021), Swift/UVOT (Siegel et al. 2019), Pan-STARRS (Chambers et al. 2016), 2MASS (Skrutskie et al. 2006), and WISE (Wright et al. 2010). The virtual observatory cross-matching was done using VOSA (Bayo et al. 2008) and Vizier (Ochsenbein et al. 2000). The sources were extinction corrected using known extinction–wavelength relations (Fitzpatrick 1999; Indebetouw et al. 2005).
We used VOSA1 to fit Kurucz models (Castelli & Kurucz 2003) to the SEDs using a χ2 minimisation technique. The metallicity of the Kurucz model was fixed to +0.5 (closest to the cluster metallicity of +0.4). Also, we fixed the distance to 4139 ± 100 pc and Av to 0.302 ± 0.005. The free parameters were temperature (3500–50 000 K) and log g (2–5). However, note that the SED-derived log g parameter is imprecise. After fitting the SEDs, we calculated the fractional residual as follows:
 (1)
(1)
The fractional residual is shown in the bottom subpanels of the SEDs (Fig. 2).
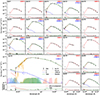 |
Fig. 2. SEDs of stars with fractional UV excess of more than 0.5 in at least one filter. The top panel for each star shows the observed flux (black error bars), data omitted while fitting the SED (grey error bars), the fitted Kurucz+UVBLUE model (red dashed curve), the fitted Koester model (blue dot-dashed curve; wherever applicable), and total model flux (green curve; wherever applicable). The bottom panel shows the residual flux after the single component fit (red dashed curve) and the double component fitting (green curve). The panel for star75 shows extra details such as the high-resolution spectral models (Kurucz: red, UVBLUE: orange, Koester: blue) and the used filter transmission curves (filled curves at the bottom). |
Of the 62 isolated sources, 29 show more than 0.5 fractional residual in at least one UV filter. In the UOCS series of papers, we use Kurucz models to fit the SEDs, as they cover a wide range of wavelengths. In this study, we checked whether the detected UV excess changes are due to underestimation of the Wein tail flux in the Kurucz models. To this end, we created a hybrid Kurucz+UVBLUE model, which uses specialised UVBLUE models (Rodríguez-Merino et al. 2005) in the 850–4700 Å region and Kurucz models for the remaining red part of the spectrum. The UVBLUE models were convolved with the UVIT and UVOT filters (where the complete filter falls within UVBLUE’s range) to get synthetic photometry for a temperature range of 3000–50 000 K, log g range of 0–5, and a metallicity range of −2 to 0.5. The filter transmission profiles were taken from the SVO Filter Profile Service2 (Rodrigo et al. 2012; Rodrigo & Solano 2020).We were able to fit nine stars as single stars with this hybrid model using the Python code BINARY_SED_FITTING3 (Jadhav et al. 2021). This leaves 20 sources with UV excess using the Kurucz+UVBLUE models.
The UV excess has been linked to the presence of hot compact objects such as WDs (Jadhav et al. 2019; Rao et al. 2022; Panthi et al. 2022) or hot subdwarfs (Jadhav et al. 2021). One can use double-component SED fitting to deconvolve the two stars. As VOSA cannot use hybrid models, we used BINARY_SED_FITTING to perform double-component fits using the hybrid model for the primary star (Kurucz+UVBLUE) and the Koester model (Tremblay & Bergeron 2009; Koester 2010) for the possible hotter companion (see Jadhav 2022 for more details). We were able to fit ten sources with satisfactory double components, while the remaining ten could not be fitted with available data.
The results of single- and double-component SED fitting are given in Table 2. An extended table, which includes photometry and fitting parameters, is available as supplementary material and on the CDS. Figure 2 shows the SED fits for single- and double-component fitting for the 20 sources with UV excess. The observed data points and associated error bars are shown in black. The line plots connecting estimated flux from synthetic photometry of the various models are shown in different colours (red: Kurucz+UVBLUE model, blue: Koester model, green: total flux of Kurucz+UVBLUE and Koester models). In the double SEDs, the cooler component (Kurucz or Kurucz+UVBLUE model) is denoted ‘A’, while the hotter component (Koester model) is denoted ‘B’.
List of target stars along with the comments from Tofflemire et al. (2014), Sanjayan et al. (2022a) and this work.
In the double-component fitting, the parameters for the cooler model SED are improved as the effects of any potential hotter companion or unusual activity are reduced. However, we find that the parameter estimates derived from only 1–2 UV data points are only partially reliable. The luminosity values are relatively accurate, but the temperature may be underestimated (≡ overestimated radius; Jadhav et al., in prep.). We therefore recommend not using the temperature or radius estimates of the hotter model SEDs.
3. Results
3.1. General comments on the SED results
Figure 1d shows that most of the BSSs are detected in NUV along with some MS stars and RGBs. We find UV excess in 20 of these sources. Among them, 12 are MS stars, 3 are BSSs, and 5 are giants. Figure 1e demonstrates the excess flux in these sources as the MS stars and RGBs are brighter than the isochrone, and moreover all the sources detected in the UV and located on the MS have some fraction of excess flux in the NUV. The remaining 42 isolated UVIT-detected stars (21 BSSs, 15 MS, 1 RGB, 4 sdBs, and 1 sdA) do not show significant UV excess.
The SED fitting gives the temperatures, luminosities, and radii of the sources. The temperature range for BSSs is 5250–7000 K while for MS stars it is 5250–6000 K. Figure 1f shows the Hertzsprung–Russell (HR) diagram of the SED fitting results. We also include the parameters of the potential hotter companions. If these latter were real, their luminosities would be of the order of 0.1 L⊙. Their SED-based temperatures are 11 000–25 000 K, and their radii are 0.02–0.11 R⊙. They could be (i) subluminous sdAs/sdBs, (ii) ELM WDs, or (iii) bloated proto-WDs (e.g., Brogaard et al. 2018), or (iv) their actual temperature could be significantly larger, which would mean these radii are overestimated, which could make them typical WDs. The grey markers in the background show the HR diagram positions of field ELMs and field sdO/sdBs for comparison. The field ELMs are a subsample of sources in Brown et al. (2016). The field sdO/sdBs are a subsample of hot subdwarfs given in Geier (2020). Both samples were fitted with single-component Kurucz SEDs using VOSA.
In the course of the SED fitting, we also tried making only Kurucz and Koester model binary SEDs. This resulted in 29 sources with UV excess, among which 10 gave satisfactory double fits. Among these latter, six were common with the hybrid and Koester fit, while four are currently classified as single fits with UV excess (star4, star19, star70 and star73). Four current binary systems (star15, star63, star80 and star87) could not be fit satisfactorily with Kurucz and Koester models using VOSA. The total number of satisfactory binary fits is the same regardless of whether or not we include UVBLUE models, and the same is true for the unsatisfactory fits. We explored whether or not there is any specific dependency, and in the case of UVBLUE models, the NUV flux for stars cooler than 6000 K is more than the Kurucz models, whereas the difference is marginal in the case of hotter stars. In general, the estimated temperatures of hotter companions were found to be higher if the UVBLUE models were incorporated. Overall, the number of sources with successful binary fits is the same in either approach; however, the overall number of sources with UV excess is reduced if UVBLUE is included.
3.2. Comments on individual systems
We did not create SEDs of UV-detected stars with neighbours within 5″. Among them, there is a notable contact binary, V5 (P = 0.31265938 d; Sanjayan et al. 2022a; Mochejska et al. 2003). There are also a few variables (long period, non-periodic, rotational variables): KIC 2437079 (Sanjayan et al. 2022a), V65 (P ∼ 11.3 d), V66 (P ∼ 49 or 99 d), and V19 (Mochejska et al. 2003). These stars are not discussed further due to them having close neighbours.
Hot subdwarfs. Star7 (B5, KIC 2437937), star49 (B4, KIC 2438324), and star79 (B3, KIC 2569576) are known pulsators (Sanjayan et al. 2022a). Star48 (B6) and star79 are RV variables and likely binary systems (Sanjayan et al. 2022b). Star49 is also an RV variable with P = 0.398495 d and a low-mass MS companion (Sanjayan et al. 2022b)4. The SED temperatures (using Kurucz models) for the three hot subdwarfs are slightly underestimated compared to Sanjayan et al. (2022b) (using Tlusty models), which is likely due to differences in the models.
Blue straggler stars. Star41 (KIC 2437238) showed rotational variability (Sanjayan et al. 2022a) and significant UV excess hinting at a ⪆0.25 M⊙ WD as its companion. The absence of eclipses and RV variability suggests a low inclination orbit in the potential binary system. The single-lined spectroscopic binary (SB1) and γDor type star47 (V106, KIC 2438249, WOCS 54008) showed no excess UV flux, which is expected as Brogaard et al. (2018) derived the temperatures of binary components as 7110 + 6875 K and their masses as 1.62 + 0.176 M⊙. The low temperatures are not enough to create significant UV flux (we note that the SED estimated radius of the BSS is overestimated as we modelled both components as a single source). The system is an eclipsing W Uma binary system with P = 1.4464 d (Tofflemire et al. 2014). The absence of UV excess and the low temperature of the companion suggests that significant time has passed since the mass-transfer event. The system is a prime candidate for a detailed asteroseismic study to constrain the internal structure and mass-transfer history in BSSs. Star53 (KIC 2437338) also showed rotational variability (Sanjayan et al. 2022a) but no UV excess or RV variability. Star61 showed UV excess, but we could not fit a hotter companion. Star69 (KIC 2437745) is a rapid rotator and photometric variable (P = 1.43) (Tofflemire et al. 2014; Sanjayan et al. 2022a). However, it did not show UV excess. Star76 (WOCS 46008, KIC 2436421) is SB1 and a rapid rotator (Tofflemire et al. 2014). Sanjayan et al. (2022a) detected variability in its Kepler light curves with a period of 1.44 days. However, we did not detect any UV excess and cannot not confirm whether the RV variability is periodic (with 1.44 d) due to poor sampling. Star87 shows UV flux compatible with an ELM WD. Star90 is an RV-constant star with no UV excess. Tofflemire et al. (2014) suggested that it is a 1.9 M⊙ merger product formed 1 Gyr ago in line with the absence of any hotter companion.
Red clump stars. There are 19 red clump stars identified using asteroseismic measurements (Stello et al. 2011) in NGC 6791. UVIT detected four of them, all with significant UV excess (only three are successfully fitted with a double SED). Among them, star27 (KIC 2438051), star73 (KIC 2436732), and star75 (KIC 2569055) are known pulsating red clump stars. These red clump stars did not show detectable RV variability or eclipses.
Main sequence stars. Star33 (Gaia DR3 2051286413614206208) has been classified as an eclipsing binary with a period of 0.3664 d (Gaia Collaboration 2022; Mowlavi et al. 2023). The Gaia light curves and the double-component fitting both suggest a close hotter star as its companion. However, more RV variation analysis is needed to confirm the companion and any mass-transfer history. The HR diagram positions of companions to star15, star63, and star80 indicate that they are likely WDs with mass ⪆0.3 M⊙.
Post-horizontal branch star. Star60 (WOCS 9007) is a proper-motion member of the cluster. However, its RV is different from the cluster by ∼25 km s−1 with a parallax of 0.2901 ± 0.0115 mas yr−1 (cluster parallax is 0.241 mas yr−1). It showed significant UV excess indicative of a young ELM companion. However, if the star is not a cluster member, then the distance measurement and the derived classification may be incorrect.
4. Discussion
The five single hot subdwarfs detected in UV all require mass transfer for their formation (Heber 2009). None of the hot subdwarfs show UV/IR excess flux, which indicates that their subdwarf component is the dominant flux emitter in the UV–IR range. Furthermore, the hotter companion candidates in three red clumps, that is, four MS stars, two BSS, and one post-HB star, are also likely low-luminosity sdAs/sdBs or ELMs according to their HR diagram position. If these are indeed hot subdwarfs or ELMs, then it means that all these are post-mass-transfer systems. Among the double SED-fitted MS stars, star33 is a known binary with a close companion. The MS stars that have accreted mass are known as blue lurkers (Leiner et al. 2019; Jadhav 2022). These are the MS equivalents of the BSSs. As such, they would be similar to BSSs in terms of formation scenarios (mergers or mass transfer) and detection techniques (high rotation, chemical peculiarities, post-mass-transfer companions). Star33 is therefore a prime candidate for being a blue lurker. At the same time, the other three MS stars are also blue lurker candidates subject to confirmation of the nature of the companion. If confirmed, this will make NGC 6791 one of the few clusters known to host blue lurkers. However, further observational evidence of rapid rotation and chemical alteration is necessary to confirm their status as blue lurkers. We note that this cluster has several short-period binaries, suggestive of possible Case-A/Case-B-mode mass transfer, which can lead to binaries with very low-mass stellar remnants (e.g., star47). The UV images are able to detect hotter systems, and there could be many more that are beyond the detection limit of UVIT. We note that such systems are found across the evolutionary stages from MS to post-HB.
The only detected RGB star shows UV excess when fitted with Kurucz models, which could later be explained by the updated Wein tail of UVBLUE models. The other five giants (four red clumps and one post-HB) show significant UV excess flux. NUV excess in RGBs has been known to be caused by rotation (Dixon et al. 2020). However, a hot compact companion can also give rise to UV excess. UV spectroscopy is required to confirm the exact source of the NUV flux from these RGBs.
Given the distance of NGC 6791, only the brightest WDs will be visible even in UV (all single subdwarfs detected presently are brighter than ≈6 L⊙). After cross-matching with the Hubble Space Telescope proper motion catalogue of NGC 6791 (Libralato et al. 2022), we were able to identify one WD candidate (290.20235, 37.76336 at 21.83 mag in F814W) within the small footprint covered by the Hubble. However, there are insufficient data points to parameterise it using its SED. There could be more such member WDs present, which could be discovered after deep multi-epoch wide-field imaging, such as that carried out by the Legacy Survey of Space and Time (Ivezić et al. 2019).
The colour of BSSs in the CMD has been linked with their origin. Ferraro et al. (2009) claimed that bluer BSSs in the globular cluster M 30 are formed via collisional mergers, while redder BSSs are formed via mass transfer. Similar double BSS sequences have been seen in other globular clusters (NGC 362: Dalessandro et al. 2013; Dattatrey et al. 2023, NGC 2173: Li et al. 2018). Similarly, the UV excess of BSSs has been linked to binarity (Gosnell et al. 2015; Sindhu et al. 2019; Pandey et al. 2021). In NGC 6791, the three BSSs with UV excess (indication of binarity) are generally redder than the rest of the BSSs of similar luminosity. This could be similar to the colour-dependent formation scenarios proposed by Ferraro et al. (2009). However, a bigger sample is needed to reach a statistically significant conclusion.
NGC 6791 has single sdBs and one sdA, along with possible low-luminosity sdBs and ELMs as companions to stars in different evolutionary phases. All of these factors suggest that the binaries play a very significant role in this dynamically old system, resulting in the formation of various types of stars due to differences in the masses of the binary members as well as their orbital properties. Therefore, this old open cluster is unique in possessing several features arising out of dynamics and binary systems.
5. Summary and conclusion
UVIT detected 91 members of NGC 6791 in either FUV or NUV filters, including MS, BSSs, hot subdwarfs, RGBs, and red clump stars. We provide SED-based parameters for 62 of the isolated sources. Of these sources, 20 showed UV excess flux, which is an indicator of a hot compact binary companion. We estimated approximate parameters for ten potential compact binary companions using SED analysis.
The total number of satisfactory binary fits is the same if we use a hybrid of UVBLUE+Kurucz models, but the number of sources with UV excess is higher without UVBLUE. In general, we estimated higher temperatures for hotter companions when the UVBLUE models were included.
NGC 6791 contains a significant population of single hot subdwarfs (four sdB and one sdA) and optically subluminous compact objects (ten hot subdwarf/ELMs). This is unique in open clusters and likely due to the dense and rich nature of NGC 6791. There are four blue lurker candidates in the cluster, which need to be confirmed using a combination of abundance studies, UV spectroscopy, rotational velocity, and RV/flux time series analysis. We note the presence of candidate post-mass-transfer systems across the evolutionary phases in this cluster, from MS to RGB, HB, and post-HB, suggestive of a rich population of interacting binaries.
The cluster appears to show properties similar to those of low-density globular clusters, along with some features seen in open clusters. This cluster is therefore a potential test bed, ideal for performing numerical simulations in order to understand the underlying processes regarding dynamics, binarity, and stellar evolution.
Mochejska et al. (2003) stated P = 0.796993 d ∼2 × 0.398495 d.
Acknowledgments
We thank the anonymous referee for constructive comments, which helped improve the methodology and discussion. VJ thanks the Alexander von Humboldt Foundation for their support. AS thanks for the support of the SERB power fellowship. RS thanks the National Academy of Sciences, India (NASI), Prayagraj, for the award of a NASI honorary Scientist position; the Alexander von Humboldt Foundation, Germany, for the award of Group linkage long-term research program between IIA, Bengaluru and European Southern Observatory, Munich, Germany, and the Director, IIA for providing institutional, infrastructural support during this work. UVIT project is a result of the collaboration between IIA, Bengaluru, IUCAA, Pune, TIFR, Mumbai, several centres of ISRO, and CSA. This publication uses VOSA, developed under the Spanish Virtual Observatory project.
References
- Bayo, A., Rodrigo, C., Barrado Y Navascués, D., et al. 2008, A&A, 492, 277 [NASA ADS] [CrossRef] [EDP Sciences] [Google Scholar]
- Bédard, A., Bergeron, P., Brassard, P., & Fontaine, G. 2020, ApJ, 901, 93 [Google Scholar]
- Bossini, D., Vallenari, A., Bragaglia, A., et al. 2019, A&A, 623, A108 [NASA ADS] [CrossRef] [EDP Sciences] [Google Scholar]
- Bressan, A., Marigo, P., Girardi, L., et al. 2012, MNRAS, 427, 127 [NASA ADS] [CrossRef] [Google Scholar]
- Brogaard, K., Christiansen, S. M., Grundahl, F., et al. 2018, MNRAS, 481, 5062 [Google Scholar]
- Brown, W. R., Gianninas, A., Kilic, M., Kenyon, S. J., & Allende Prieto, C. 2016, ApJ, 818, 155 [Google Scholar]
- Cantat-Gaudin, T., Anders, F., Castro-Ginard, A., et al. 2020, A&A, 640, A1 [NASA ADS] [CrossRef] [EDP Sciences] [Google Scholar]
- Castelli, F., & Kurucz, R. L. 2003, New Grids of ATLAS9 Model Atmospheres, eds. N. Piskunov, W. W. Weiss, & D. F. Gray, IAU, ASP, A20 [Google Scholar]
- Chambers, K. C., Magnier, E. A., Metcalfe, N., et al. 2016, arXiv e-prints [arXiv:1612.05560] [Google Scholar]
- Cummings, J. D., Kalirai, J. S., Tremblay, P. E., Ramirez-Ruiz, E., & Choi, J. 2018, ApJ, 866, 21 [NASA ADS] [CrossRef] [Google Scholar]
- Dalessandro, E., Ferraro, F. R., Massari, D., et al. 2013, ApJ, 778, 135 [NASA ADS] [CrossRef] [Google Scholar]
- Dattatrey, A. K., Yadav, R. K. S., Rani, S., et al. 2023, ApJ, 943, 130 [CrossRef] [Google Scholar]
- Dixon, D., Tayar, J., & Stassun, K. G. 2020, AJ, 160, 12 [NASA ADS] [CrossRef] [Google Scholar]
- Ferraro, F. R., Beccari, G., Dalessandro, E., et al. 2009, Nature, 462, 1028 [NASA ADS] [CrossRef] [Google Scholar]
- Fitzpatrick, E. L. 1999, PASP, 111, 63 [Google Scholar]
- Gaia Collaboration (Prusti, T., et al.) 2016, A&A, 595, A1 [NASA ADS] [CrossRef] [EDP Sciences] [Google Scholar]
- Gaia Collaboration (Brown, A. G. A., et al.) 2018, A&A, 616, A1 [NASA ADS] [CrossRef] [EDP Sciences] [Google Scholar]
- Gaia Collaboration (Brown, A. G. A., et al.) 2021, A&A, 649, A1 [NASA ADS] [CrossRef] [EDP Sciences] [Google Scholar]
- Gaia Collaboration (Vallenari, A., et al.) 2022, A&A, 674, A1 [Google Scholar]
- Geier, S. 2020, A&A, 635, A193 [NASA ADS] [CrossRef] [EDP Sciences] [Google Scholar]
- Gosnell, N. M., Mathieu, R. D., Geller, A. M., et al. 2015, ApJ, 814, 163 [Google Scholar]
- Heber, U. 2009, ARA&A, 47, 211 [Google Scholar]
- Hills, J. G., & Day, C. A. 1976, Astrophys. Lett., 17, 87 [NASA ADS] [Google Scholar]
- Indebetouw, R., Mathis, J. S., Babler, B. L., et al. 2005, ApJ, 619, 931 [NASA ADS] [CrossRef] [Google Scholar]
- Ivezić, Ž., Kahn, S. M., Tyson, J. A., et al. 2019, ApJ, 873, 111 [Google Scholar]
- Jadhav, V. V. 2022, PhD thesis, IISc, India [Google Scholar]
- Jadhav, V. V., & Subramaniam, A. 2021, MNRAS, 507, 1699 [NASA ADS] [CrossRef] [Google Scholar]
- Jadhav, V. V., Sindhu, N., & Subramaniam, A. 2019, ApJ, 886, 13 [NASA ADS] [CrossRef] [Google Scholar]
- Jadhav, V. V., Pandey, S., Subramaniam, A., & Sagar, R. 2021, J. Astrophys. Astron., 42, 89 [NASA ADS] [CrossRef] [Google Scholar]
- Kamann, S., Bastian, N. J., Gieles, M., Balbinot, E., & Hénault-Brunet, V. 2019, MNRAS, 483, 2197 [NASA ADS] [CrossRef] [Google Scholar]
- Koester, D. 2010, Mem. Soc. Astron. Ital., 81, 921 [Google Scholar]
- Kumar, A., Ghosh, S. K., Hutchings, J., et al. 2012, Ultra Violet Imaging Telescope (UVIT) on ASTROSAT, Proc. SPIE, 8443, 84431N [NASA ADS] [Google Scholar]
- Leiner, E., Mathieu, R. D., Vanderburg, A., Gosnell, N. M., & Smith, J. C. 2019, ApJ, 881, 47 [Google Scholar]
- Li, C., Deng, L., de Grijs, R., Jiang, D., & Xin, Y. 2018, ApJ, 856, 25 [NASA ADS] [CrossRef] [Google Scholar]
- Libralato, M., Bellini, A., Vesperini, E., et al. 2022, ApJ, 934, 150 [NASA ADS] [CrossRef] [Google Scholar]
- Martinez-Medina, L. A., Gieles, M., Pichardo, B., & Peimbert, A. 2018, MNRAS, 474, 32 [NASA ADS] [CrossRef] [Google Scholar]
- Mochejska, B. J., Stanek, K. Z., & Kaluzny, J. 2003, AJ, 125, 3175 [NASA ADS] [CrossRef] [Google Scholar]
- Mowlavi, N., Holl, B., Lecoeur-Taïbi, I., et al. 2023, A&A, 674, A16 [NASA ADS] [CrossRef] [EDP Sciences] [Google Scholar]
- Ochsenbein, F., Bauer, P., & Marcout, J. 2000, A&AS, 143, 23 [NASA ADS] [CrossRef] [EDP Sciences] [Google Scholar]
- Pandey, S., Subramaniam, A., & Jadhav, V. V. 2021, MNRAS, 507, 2373 [NASA ADS] [CrossRef] [Google Scholar]
- Panthi, A., Vaidya, K., Jadhav, V., et al. 2022, MNRAS, 516, 5318 [NASA ADS] [CrossRef] [Google Scholar]
- Perets, H. B., & Fabrycky, D. C. 2009, ApJ, 697, 1048 [Google Scholar]
- Postma, J. E., & Leahy, D. 2017, PASP, 129, 115002 [Google Scholar]
- Postma, J. E., & Leahy, D. 2020, PASP, 132, 054503 [Google Scholar]
- Rao, K. K., Vaidya, K., Agarwal, M., et al. 2022, MNRAS, 516, 2444 [NASA ADS] [CrossRef] [Google Scholar]
- Rodrigo, C., & Solano, E. 2020, XIV.0 Scientific Meeting(virtual) of the Spanish Astronomical Society, 182 [Google Scholar]
- Rodrigo, C., Solano, E., & Bayo, A. 2012, SVO Filter Profile Service Version 1.0, IVOA Working Draft 15 October 2012 [Google Scholar]
- Rodríguez-Merino, L. H., Chavez, M., Bertone, E., & Buzzoni, A. 2005, ApJ, 626, 411 [Google Scholar]
- Sahu, S., Subramaniam, A., Simunovic, M., et al. 2019, ApJ, 876, 34 [NASA ADS] [CrossRef] [Google Scholar]
- Sanjayan, S., Baran, A. S., Németh, P., et al. 2022a, Acta Astron., 72, 77 [NASA ADS] [Google Scholar]
- Sanjayan, S., Baran, A. S., Ostrowski, J., et al. 2022b, MNRAS, 509, 763 [Google Scholar]
- Siegel, M. H., LaPorte, S. J., Porterfield, B. L., Hagen, L. M. Z., & Gronwall, C. A. 2019, AJ, 158, 35 [Google Scholar]
- Sindhu, N., Subramaniam, A., Jadhav, V. V., et al. 2019, ApJ, 882, 43 [NASA ADS] [CrossRef] [Google Scholar]
- Skrutskie, M. F., Cutri, R. M., Stiening, R., et al. 2006, AJ, 131, 1163 [NASA ADS] [CrossRef] [Google Scholar]
- Stello, D., Meibom, S., Gilliland, R. L., et al. 2011, ApJ, 739, 13 [NASA ADS] [CrossRef] [Google Scholar]
- Subramaniam, A., Pandey, S., Jadhav, V. V., & Sahu, S. 2020, J. Astrophys. Astron., 41, 45 [NASA ADS] [CrossRef] [Google Scholar]
- Tandon, S. N., Subramaniam, A., Girish, V., et al. 2017, AJ, 154, 128 [NASA ADS] [CrossRef] [Google Scholar]
- Tandon, S. N., Postma, J., Joseph, P., et al. 2020, AJ, 159, 158 [Google Scholar]
- Taylor, M. B. 2005, in Astronomical Data Analysis Software and Systems XIV, eds. P. Shopbell, M. Britton, & R. Ebert, ASP Conf. Ser., 347, 29 [Google Scholar]
- Tody, D. 1993, in Astronomical Data Analysis Software and Systems II, eds. R. J. Hanisch, R. J. V. Brissenden, & J. Barnes, ASP Conf. Ser., 52, 173 [Google Scholar]
- Tofflemire, B. M., Gosnell, N. M., Mathieu, R. D., & Platais, I. 2014, AJ, 148, 61 [Google Scholar]
- Tremblay, P. E., & Bergeron, P. 2009, ApJ, 696, 1755 [Google Scholar]
- Vaidya, K., Panthi, A., Agarwal, M., et al. 2022, MNRAS, 511, 2274 [NASA ADS] [CrossRef] [Google Scholar]
- Vernekar, N., Subramaniam, A., Jadhav, V. V., & Bowman, D. M. 2023, MNRAS, 524, 1360 [NASA ADS] [CrossRef] [Google Scholar]
- Villanova, S., Carraro, G., Geisler, D., Monaco, L., & Assmann, P. 2018, ApJ, 867, 34 [NASA ADS] [CrossRef] [Google Scholar]
- Wright, E. L., Eisenhardt, P. R. M., Mainzer, A. K., et al. 2010, AJ, 140, 1868 [Google Scholar]
All Tables
List of target stars along with the comments from Tofflemire et al. (2014), Sanjayan et al. (2022a) and this work.
All Figures
|
Fig. 1. Properties of UVIT photometry and HR diagrams of analysed members. (a) Spatial distribution of Gaia members. (b) Spatial distribution of UV-detected members (blue circles) and UV-detected sources not present in the Gaia EDR3 catalogue (grey dots). (c) Magnitude vs. error plots for UVIT photometry. (d) Gaia CMD showing the Cantat-Gaudin et al. (2020) members (as grey), UV-detected members (as orange), and members with UV excess (as blue). (e) The UV-optical CMD of cluster members. (f) The HR diagram created using SED fitting results. The figure shows 42 sources without UV excess (hollow green circles) and ten sources with UV excess (green filled circles) modelled using single-component SED. The ten sources with double-component fitting are shown as hollow red squares and red-filled squares for A and B components, respectively. Their corresponding IDs are also shown. The isochrone of log(age) = 9.93 (grey curve), the 0.5 M⊙ WD cooling curve (black dashed curve), and the 0.2–0.4 M⊙ WD cooling curves (black dotted curves) are shown wherever needed in (d)–(f). |
| In the text | |
|
Fig. 2. SEDs of stars with fractional UV excess of more than 0.5 in at least one filter. The top panel for each star shows the observed flux (black error bars), data omitted while fitting the SED (grey error bars), the fitted Kurucz+UVBLUE model (red dashed curve), the fitted Koester model (blue dot-dashed curve; wherever applicable), and total model flux (green curve; wherever applicable). The bottom panel shows the residual flux after the single component fit (red dashed curve) and the double component fitting (green curve). The panel for star75 shows extra details such as the high-resolution spectral models (Kurucz: red, UVBLUE: orange, Koester: blue) and the used filter transmission curves (filled curves at the bottom). |
| In the text | |
Current usage metrics show cumulative count of Article Views (full-text article views including HTML views, PDF and ePub downloads, according to the available data) and Abstracts Views on Vision4Press platform.
Data correspond to usage on the plateform after 2015. The current usage metrics is available 48-96 hours after online publication and is updated daily on week days.
Initial download of the metrics may take a while.