Fig. 1.

Download original image
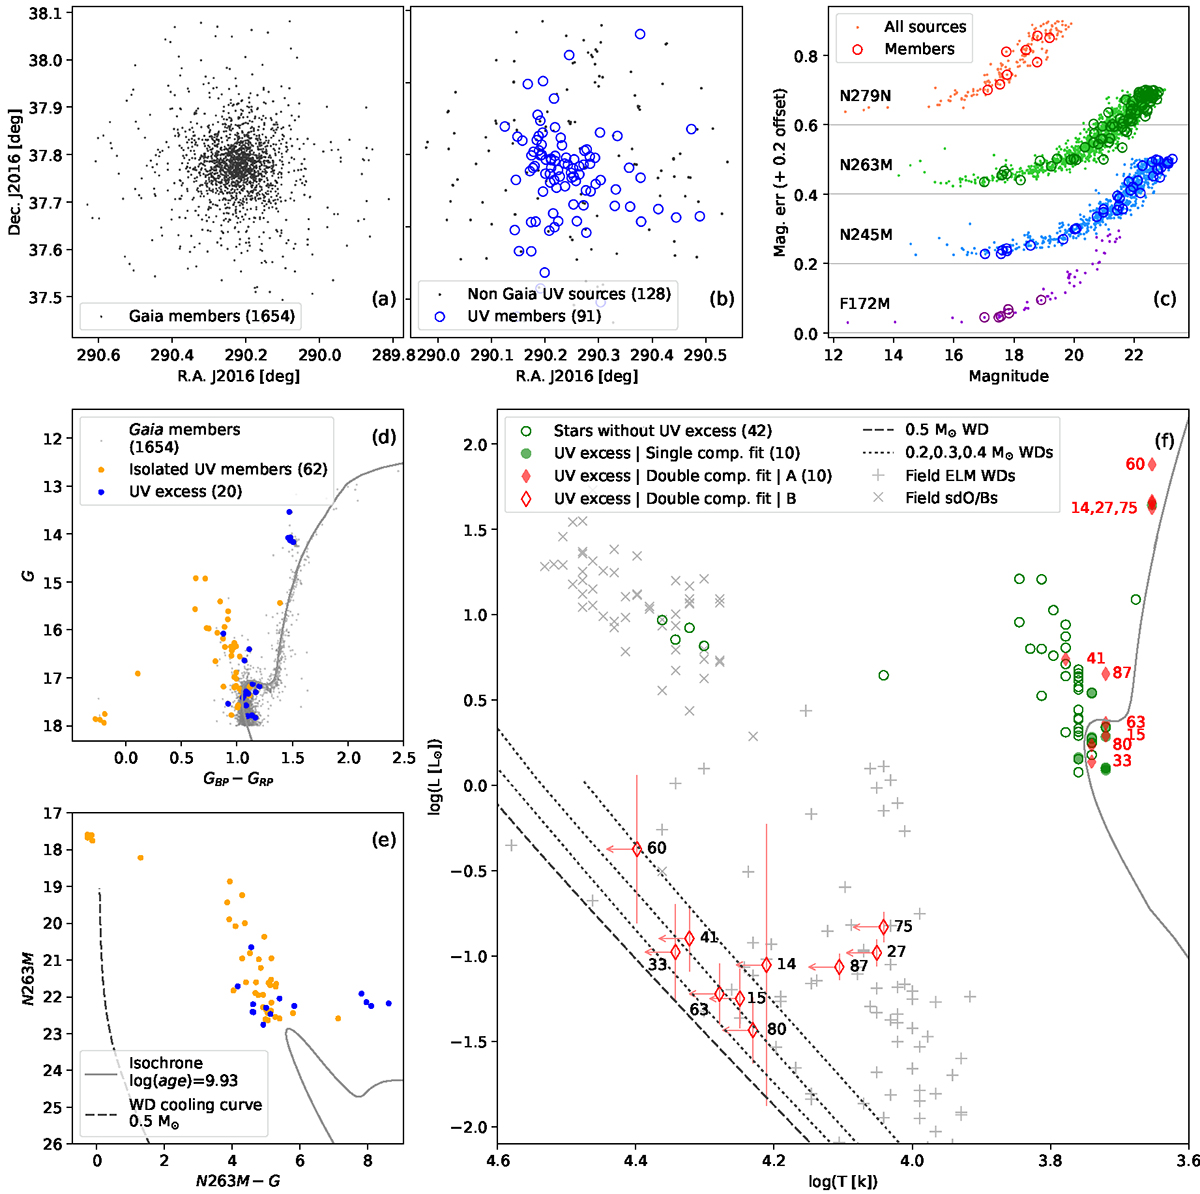
Properties of UVIT photometry and HR diagrams of analysed members. (a) Spatial distribution of Gaia members. (b) Spatial distribution of UV-detected members (blue circles) and UV-detected sources not present in the Gaia EDR3 catalogue (grey dots). (c) Magnitude vs. error plots for UVIT photometry. (d) Gaia CMD showing the Cantat-Gaudin et al. (2020) members (as grey), UV-detected members (as orange), and members with UV excess (as blue). (e) The UV-optical CMD of cluster members. (f) The HR diagram created using SED fitting results. The figure shows 42 sources without UV excess (hollow green circles) and ten sources with UV excess (green filled circles) modelled using single-component SED. The ten sources with double-component fitting are shown as hollow red squares and red-filled squares for A and B components, respectively. Their corresponding IDs are also shown. The isochrone of log(age) = 9.93 (grey curve), the 0.5 M⊙ WD cooling curve (black dashed curve), and the 0.2–0.4 M⊙ WD cooling curves (black dotted curves) are shown wherever needed in (d)–(f).
Current usage metrics show cumulative count of Article Views (full-text article views including HTML views, PDF and ePub downloads, according to the available data) and Abstracts Views on Vision4Press platform.
Data correspond to usage on the plateform after 2015. The current usage metrics is available 48-96 hours after online publication and is updated daily on week days.
Initial download of the metrics may take a while.


