| Issue |
A&A
Volume 688, August 2024
|
|
|---|---|---|
| Article Number | A152 | |
| Number of page(s) | 7 | |
| Section | Galactic structure, stellar clusters and populations | |
| DOI | https://doi.org/10.1051/0004-6361/202450780 | |
| Published online | 14 August 2024 | |
UOCS
XIV. Uncovering extremely low-mass white dwarfs and blue lurkers in NGC 752⋆
1
Helmholtz-Institut für Strahlen- und Kernphysik, Universität Bonn, Nussallee 14-16, 53115 Bonn, Germany
2
Inter-University Centre for Astronomy and Astrophysics (IUCAA), Post Bag 4, Ganeshkhind, Pune 411007, India
3
Indian Institute of Astrophysics, Koramangala II Block, Bangalore 560034, India
Received:
18
May
2024
Accepted:
6
June
2024
Abstract
Context. Evolutionary pathways of binary systems are vastly different from single stellar evolution, and thus there is a need to quantify their frequency and diversity. Thanks to their to their coeval nature, open clusters are the best test beds for unveiling the secrets of binary populations. The availability of multi-wavelength data in recent years has been critical in characterising the binary population.
Aims. NGC 752 is a solar-metallicity, intermediate-age open cluster located at 460 pc. In this work, we aim to identify the optically sub-luminous white dwarfs in NGC 752 and identify the elusive blue lurkers by association.
Methods. We used multi-wavelength photometry from AstroSat/UVIT, Swift/UVOT, Gaia DR3, and other archival surveys to analyse the colour-magnitude diagrams and spectral energy distributions of 37 cluster members.
Results. We detected eight white dwarf companions of cluster members. Four of the systems are main sequence stars with extremely low-mass white dwarfs as their companions. Two of these main sequence stars are also fast rotators.
Conclusions. The presence of low-mass white dwarfs and fast rotation signals a past mass transfer, and we classify the four main sequence stars as blue lurkers. The binary fraction in NGC 752 is estimated to be 50–70%, and it shows that the contribution of optically undetected stars is crucial in quantifying the present-day binary fraction.
Key words: catalogs / binaries: general / Hertzsprung-Russell and C-M diagrams / white dwarfs / open clusters and associations: individual: NGC 752 / ultraviolet: stars
The full version of Table 3 is available at the CDS via anonymous ftp to cdsarc.cds.unistra.fr (130.79.128.5) or via https://cdsarc.cds.unistra.fr/viz-bin/cat/J/A+A/688/A152
Corresponding authors; This email address is being protected from spambots. You need JavaScript enabled to view it. , This email address is being protected from spambots. You need JavaScript enabled to view it. .
© The Authors 2024
 Open Access article, published by EDP Sciences, under the terms of the Creative Commons Attribution License (https://creativecommons.org/licenses/by/4.0), which permits unrestricted use, distribution, and reproduction in any medium, provided the original work is properly cited.
This article is published in open access under the Subscribe to Open model. This email address is being protected from spambots. You need JavaScript enabled to view it. to support open access publication.
1. Introduction
A good fraction of stars in the Galaxy are part of binary or multiple systems. The evolution of stars in such systems can vary due to interactions with a close companion. Due to the diversity of binary orbital parameters, predicting the nature of the interaction and its final product is not always possible. We studied open clusters (OCs) to identify optically sub-luminous hot companions in binary systems and detect the signs of mass transfer in these systems.
More specifically, we studied a nearby intermediate-age OC, NGC 752 (αJ2000 = 01h58m, δJ2000 = +37° 52′). Table 1 gives the basic parameters of the cluster. It has been widely studied using imaging (Ebbighausen 1939; Eggen 1963; Crawford & Barnes 1970; Arribas et al. 1990; Platais 1992; Twarog et al. 2015) and spectroscopy (Hobbs & Pilachowski 1986; Pilachowski et al 1989, Hobbs & Thorburn 1992; Böcek Topcu et al. 2020; Boesgaard et al. 2022), as well as in X-rays (Belloni & Verbunt 1996; Giardino et al. 2008). NGC 752 has a moderate binary fraction of ≈40% (Jadhav et al. 2021b). Maderak et al. (2013) noted a main sequence (MS) turn-off mass of 1.82 M⊙ and reported an O overabundance in the cluster’s cool dwarfs.
Basic parameters of NGC 752.
Recently, Buckner & Sandquist (2018) reported the discovery of a MS–white dwarf (WD) system in NGC 752 using Gaia photometry and panchromatic spectral energy distributions (SEDs). Milone et al. (2019) studied an eclipsing double-lined spectroscopic binary (SB2) system, DS Andromedae, and estimated the dynamical properties of its components. Bhattacharya et al. (2021) find tidal tails around the cluster spanning 35 pc. They also find that the cluster has lost 92.5–98.5% of its mass due to stellar evolution and tidal interactions. Sandquist et al. (2023) analysed two eclipsing binaries in the turn-off of NGC 752 and postulated a non-standard evolution for both binaries. The cluster is well separated in proper motion space and has a well-established list of members. Cantat-Gaudin et al. (2020) list 223 members brighter than 18 Gmag, and Agüeros et al. (2018) list 258 members in the F0–M4 spectral range. For further analysis, we used the members from Cantat-Gaudin et al. (2020) due to the better precision of their Gaia data.
In an OC, the mass of young WDs is predefined based on its MS turn-off mass. For NGC 752, the young WDs should each have masses of ≈0.5 M⊙ (Maderak et al. 2013; Cummings et al. 2018). However, there is evidence of young, ≈0.2 M⊙ WDs in other OCs, such as M67 (Landsman et al. 1997; Jadhav et al. 2019). The evolution of such extremely low-mass WDs (ELMs) through single stellar evolution within the Hubble time is not possible. Hence, they must be the products of a binary interaction with mass donors (Marsh et al. 1995). The ELMs stay bright and hot longer than higher-mass WDs due to their thick atmospheres and lower initial temperature. Hence, it is much more common to detect ELMs when the companion has evolved (into a WD or a neutron star) and become optically sub-luminous (Brown et al. 2010). Detecting such optically dominant ELMs is also quite efficient (Pelisoli & Vos 2019). In contrast, detecting ELMs in the presence of an optically bright companion is much more challenging. As these young WDs are hot but compact, their optical flux is multiple magnitudes lower than the MS-like acceptor present in close proximity. To identify these unresolved binaries with different temperatures, a multi-wavelength SED can be used (Jadhav 2022). If we know a system is made up of an MS star and an ELM, this can provide evidence of mass transfer in the system. Complementarily, OCs are known to host post-mass-transfer systems containing blue stragglers (Sandage 1953) and blue lurkers (Leiner et al. 2019). Blue stragglers are more massive and bluer than MS stars formed via mass transfer or collisions (McCrea 1964; Hills & Day 1976). Blue lurkers are MS stars but have a similar mass transfer history as blue stragglers; they are identified based on their faster rotation (Leiner et al. 2019) or other mass transfer signatures (Jadhav et al. 2019). The identification and frequency of blue stragglers in OCs and globular clusters has been well established (Knigge et al. 2009; Jadhav & Subramaniam 2021). However, identifying blue lurkers is difficult due to their unremarkable position in the colour-magnitude diagram (CMD). Presently, only a handful of clusters have blue lurker candidates (Jadhav et al. 2019; Nine et al. 2023; Dattatrey et al. 2023); this sample is highly incomplete due to the elusive and transient signatures of mass transfer.
In this work we used multi-wavelength photometry of NGC 752 to detect ELM candidates in the cluster and increase the sample of known blue lurkers by association. The paper is organised as follows: Sect. 2 presents the data and analysis, we present and discuss the results in Sect. 3, and we summarise our findings in Sect. 4.
2. Observations and analysis
2.1. Data
NGC 752 was observed with UltraViolet Imaging Telescope (UVIT) on board AstroSat on 2019 December 27 in two far-UV filters. The details of the observations are given in Table 2. The calibration and instrumentation details of UVIT can be found in Tandon et al. (2017, 2020) and Kumar et al. (2012), respectively. The UVIT images were processed using CCDLAB to create science-ready images (Postma & Leahy 2017, 2020, 2021). The point spread function photometry was performed using IRAF (Tody 1993). The UVIT photometric catalogue is given in Table 3, the full version of which is available at the CDS.
Log of UVIT and UVOT observations.
We used the Cantat-Gaudin et al. (2020) catalogue for cluster membership information. The sources with proba > 0.5 were considered members for further analysis. Among the 212 UVIT-detected sources, 25 are cluster members. We also found 19 cluster members in the Swift/Ultra-violet Optical Telescope (UVOT) catalogue (Siegel et al. 2019)1. The total number of cluster members with at least a UVIT or UVOT detection is 31 sources. Table 2 gives information about the source detection in the UV. The optically faintest UV member had a magnitude of ∼15.8 Gmag. We selected all 39 sources brighter than 15.8 Gmag within the same field of view for further SED analysis. This enabled us to study the UV properties of a G-band magnitude-limited sample of cluster members.
Figure 1a shows the spatial distribution of Gaia DR2 members and UV-detected members. Figure 1b shows the error distribution for UV images. Figure 1 (c) shows the Gaia CMD of the cluster, including UV-detected sources. Figures 1d–f show the UV-optical CMDs of NGC 752.
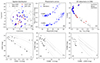 |
Fig. 1. Photometric properties of NGC 752. (a) Spatial distribution of NGC 752 members and UV detections. The Gaia-based cluster members (grey circles), UVOT detections (red triangles), UVIT detections (blue-filled triangles), and the stars brighter than 15.8 Gmag analysed via SED fitting (grey-filled circles) are shown. The large grey circle denotes the UVOT field of view. (b) Photometric errors in UVIT/F148W and UVIT/F169M photometry. Cluster members are shown as blue circles, while all UV detections are shown with dots. The magnitude errors in the F169M filter are offset by 0.2 mag for clarity. (c) Gaia CMD of the cluster members and their UV detections. The symbols are the same as in panel a. (d) UVOT-Gaia CMD. (e) UVIT-Gaia CMD. (f) UVIT-UVOT CMD. The reddened PARSEC isochrone (grey curve) and binary isochrone (dashed grey curve) are shown for reference in panels c–f. |
We checked the source locations in aladin2 and Gaia DR3 to look for crowding within 5″. Two stars out of the 39 (star4 and star27) were excluded from further SED analysis due to the presence of close neighbours. In addition to UVIT and UVOT photometry, we used VOSA (Bayo et al. 2008) to search the UV-detected sources in photometric archives: Two Micron All-Sky Survey (2MASS; Skrutskie et al. 2006), AKARI/IRC (Murakami et al. 2007; Onaka et al. 2007), Wide-field Infrared Survey Explorer (WISE; Wright et al. 2010), Panoramic Survey Telescope and Rapid Response System (Pan-STARRS Chambers et al. 2016), the Uvbyβ photoelectric photometric catalogue (Hauck & Mermilliod 1998), and Gaia DR3 (Gaia Collaboration 2023). The photometry was corrected for reddening using the Fitzpatrick (1999), Indebetouw et al. (2005), and Castelli & Kurucz (2003) extinction laws. In addition to imaging data, 27 stars within the sample have Apache Point Observatory Galactic Evolution Experiment (APOGEE) DR17 spectroscopic data (Majewski et al. 2017; Abdurro’uf et al. 2022).
2.2. Isochrone fitting
We used PARSEC isochrones with [M/H] = 0.0 and a log(age) range of 9.05–9.20 (with steps of 0.03) to get the best-fitting isochrone. The fitting was done visually; the parameters are given in Table 1. The given errors are the grid sizes used in the fitting. The solar-metallicity 1.58 Gyr PARSEC isochrone with the distance of 461 pc and E(B − V) of 0.0435 are plotted in Figs. 1 and 2.
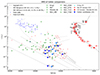 |
Fig. 2. HRD positions of NGC 752 members and their companions. The NGC 752 members with UV excess and a binary fit are shown as red-filled squares, and hot companion candidates as blue-filled squares. Cyan crosses mark the X-ray-detected sources. Previously detected compact companions in the OCs King 2 (green diamonds), M67 (green squares), Melotte 66 (green star), NGC 188 (green circles), NGC 2506 (green downward pointing triangles), NGC 6971 (green upward pointing triangles), NGC 7142 (green leftward pointing triangles), and NGC 7789 (green rightward pointing triangles) are also shown. The cluster isochrone (grey curve), Bergeron et al. (1995) WD cooling curves (dashed grey curves), Althaus et al. (2013) WD cooling curves (dotted grey curves), and HRD positions of field sdBs (blue dots) and ELMs (red dots) are shown for reference. |
2.3. SED fitting
We used a distance of 461 ± 37 pc to cover the mean distance from the isochrone and the literature values in Table 1. Similarly, a E(B − V) extinction of 0.0435 ± 0.0100 (≡AV of 0.135 ± 0.030) was used to de-redden the stellar fluxes.
The 37 isolated sources3 were fitted with a single SED composed of a Kurucz spectrum (suitable for MS and giant components; Castelli & Kurucz 2003). The parameter range of the Kurucz models was as follows: Teff ∈ [3500, 9000], log g ∈ [3, 5], [M/H] ∈ [−0.5, 0], and alpha = 0. The SED fitting was performed using BINARY_SED_FITTING v3.3.04 (Jadhav et al. 2021a). BINARY_SED_FITTING performs a χ2 minimising grid to find the component’s parameters. A few data points were removed from the sources to improve the fit. These non-fitted points are indicated in the respective SEDs in Fig. A.1.
We find that 15 out of the 37 sources show UV excess flux in at least two UV filters. The excess was identified using a fractional residual (FR) Δflux/fluxobs > 0.5. These sources were further fitted with a second component composed of a Koester spectrum suitable for WD components (Koester 2010; Tremblay & Bergeron 2009). The parameter ranges for the Koester models were as follows: Teff ∈ [7000, 80 000] and log g ∈ [6.5, 9.5]. The resultant binary SED fits are shown in Fig. A.1 and Table 3. An extended version of the table is available at the CDS.
SED parameters of NGC 752 members with significant UV excess.
3. Results and discussion
Figure 1 shows the spatial location of the NGC 752 members. There are 37 isolated members within a common field of view and the UV detection limit. The optical CMD (Fig. 1c) and near-UV CMD (Fig. 1d) show that the cluster members follow the theoretical isochrones. However, some of the MS turn-off members in the UV CMDs (Fig. 1d–f) appear brighter than the isochrones. This is an indication of UV excess in these stars. In the combined UVIT and UVOT data, we find significant UV excess in 15 sources (40%).
Figure 2 shows the Hertzsprung–Russell diagram (HRD) of the isolated cluster members brighter than 15.8 Gmag. The optically bright members all lie along the theoretical isochrone. The HRD positions of field ELMs (subsample from Brown et al. 2016) and field hot subdwarfs (the sdOs and sdBs sub-samples from Geier 2020) are shown for comparison; their parameters were derived using VOSA (Bayo et al. 2008; Jadhav et al. 2023). The hotter components from binary SED fitting are also shown as blue squares. Their HRD positions are similar to those of the field ELMs. For reference, we have also plotted the HRD positions of known hotter companions in other OCs: King 2 (Jadhav et al. 2021a), M67 (Sindhu et al. 2019; Jadhav et al. 2019; Subramaniam et al. 2020; Pandey et al. 2021), Melotte 66 (Rao et al. 2022), NGC 188 (Subramaniam et al. 2016), NGC 2506 (Panthi et al. 2022), NGC 6791 (Jadhav et al. 2023), NGC 7142 (Panthi et al. 2024), and NGC 7789 (Vaidya et al. 2022).
We compared the HRD position of the hotter companions to WD cooling curves to estimate the photometric mass. We used the Bergeron et al. (1995) WD cooling curves for WDs more massive than 0.2 M⊙ and those from Althaus et al. (2013) for less massive WDs. Of the 15 WD candidates, 10 have photometric masses of ≤0.2 M⊙. Seven of these WD candidates are also detected in X-rays (Giardino et al. 2008). The source of the X-ray could also contaminate the UV flux. Hence, we cannot be sure that the UV flux solely comes from a UV-bright WD and cannot trust the resultant SED parameters. This still leaves eight WD candidates in NGC 752, five of which are ELM candidates – star14, star17, star35, and star43 are in MS+ELM systems, and star18 is in a giant+ELM system. In addition, the fact that star1 is in a system with a high-mass WD suggests that star1 had a massive progenitor, likely a blue straggler.
The APOGEE survey provides v sin i measurements, which are indicators of the rotation velocity of the dwarf stars. Faster rotation has been linked to recent mass accretion and is an indicator of a blue lurker (Leiner et al. 2019). Among the WD candidates, four stars (star17, star30, star33, and star35) have v sin i measurements (with values of 15–96 km s−1). Star17, star33, and star35 have low-mass WD companions (0.2–0.3 M⊙), and star33 has the highest v sin i of 96 km s−1. Overall, the MS+WD systems have higher v sin i compared to stars without UV excess (v sin imedian = 5.4 km s−1). The enhanced v sin i is in line with the recent mass transfer history required to form the low-mass companions to star17, star33, and star35.
The binary fraction derived using unresolved binaries in the optical CMD of NGC 752 is 28–48% (Jadhav et al. 2021b). From the optical CMD (Fig. 1a), we can see that only a few UV-detected sources lie near the binary isochrone. The rest lie on the MS, which means they will not be included in the binary population based on the optical CMD. Of the 37 analysed systems, eight (i.e. 22%) are binaries, either MS+WD or giant+WD systems (all of which lie on the MS in the optical CMD). The binary fraction of the cluster becomes 50–70 % when including these MS+WD systems. The current work is sensitive to systems where the FR is more than 0.5, equivalent to an excess flux of 0.44 mag in at least two filters. To achieve this, the bluest MS turn-off star (star35) would require a WD companion brighter than 19.2 mag in F148W. The UV magnitude limit also constrains the amount of time such a WD can be detected for a given mass: < 1 Gyr for 0.19 M⊙ (Althaus et al. 2013), < 100 Myr for 0.5 M⊙, and < 270 Myr for 1.2 M⊙ (Bergeron et al. 1995). Thus, a typical CO core hydrogen atmosphere WD (0.5 M⊙) in NGC 752 will be visible for only 100 Myr. A He core WD cools down more slowly than the CO core WDs, thus leading to a higher detection rate. Overall, this demonstrates that the binary fraction estimates limited to optical analyses can lead to an underestimation of the present-day binary fraction.
4. Conclusions and summary
We analysed a magnitude-limited sample of 37 members of NGC 752 (35 MS stars and 2 giants) using UVIT, UVOT, Gaia, and other archival data.
-
The SED analysis shows that the cluster hosts at least eight WDs hidden in binary systems. Five WDs are ELMs; they are companions to four MS stars and one giant star.
-
There are four MS+ELM systems, two of which have faster rotation (v sin i), which is also a signature of recent mass transfer. Based on the ELM companion and fast rotation, we classify these four sources as blue lurkers (> 11% of the MS population). Thus, NGC 752 is the third OC confirmed to contain blue lurkers, after M67 and NGC 6791. Six other MS stars with X-ray detection could also harbour an ELM companion. However, more analysis is needed to confirm their presence.
-
The binary fraction of MS+WD systems is 20% (7/35). The binary fraction of NGC 752, accounting for the WD companions, is 50–70% (22% more than the binary fraction based on unresolved binaries in optical CMDs). A similar increase in the binary fraction of other clusters is also expected.
None of these sources are variable based on Gaia DR3 data.
Acknowledgments
VJ thanks the Alexander von Humboldt Foundation for their support. UVIT project is a result of the collaboration between IIA, Bengaluru, IUCAA, Pune, TIFR, Mumbai, several centres of ISRO, and CSA. This publication makes use of VOSA, developed under the Spanish Virtual Observatory project. This work has made use of data from the European Space Agency (ESA) mission Gaia (https://www.cosmos.esa.int/gaia), processed by the Gaia Data Processing and Analysis Consortium (DPAC, https://www.cosmos.esa.int/web/gaia/dpac/consortium). Funding for the DPAC has been provided by national institutions, in particular the institutions participating in the Gaia Multilateral Agreement.
References
- Abdurro’uf, A., Accetta, K., Aerts, C., et al. 2022, ApJS, 259, 35 [NASA ADS] [CrossRef] [Google Scholar]
- Agarwal, M., Rao, K. K., Vaidya, K., & Bhattacharya, S. 2021, MNRAS, 502, 2582 [CrossRef] [Google Scholar]
- Agüeros, M. A., Bowsher, E. C., Bochanski, J. J., et al. 2018, ApJ, 862, 33 [Google Scholar]
- Althaus, L. G., Miller Bertolami, M. M., & Córsico, A. H. 2013, A&A, 557, A19 [NASA ADS] [CrossRef] [EDP Sciences] [Google Scholar]
- Arribas, S., Manteiga, M., Martinez Roger, C., et al. 1990, Ap&SS, 169, 49 [NASA ADS] [CrossRef] [Google Scholar]
- Bartašiūtė, S., Janusz, R., Boyle, R. P., & Philip, A. G. D. 2011, Balt. Astron., 20, 27 [Google Scholar]
- Bayo, A., Rodrigo, C., Barrado Y Navascués, D., et al. 2008, A&A, 492, 277 [NASA ADS] [CrossRef] [EDP Sciences] [Google Scholar]
- Belloni, T., & Verbunt, F. 1996, A&A, 305, 806 [NASA ADS] [Google Scholar]
- Bergeron, P., Wesemael, F., & Beauchamp, A. 1995, PASP, 107, 1047 [Google Scholar]
- Bhattacharya, S., Agarwal, M., Rao, K. K., & Vaidya, K. 2021, MNRAS, 505, 1607 [NASA ADS] [CrossRef] [Google Scholar]
- Böcek Topcu, G., Afşar, M., Sneden, C., et al. 2020, MNRAS, 491, 544 [CrossRef] [Google Scholar]
- Boesgaard, A. M., Lum, M. G., Chontos, A., & Deliyannis, C. P. 2022, ApJ, 927, 118 [NASA ADS] [CrossRef] [Google Scholar]
- Brown, W. R., Kilic, M., Allende Prieto, C., & Kenyon, S. J. 2010, ApJ, 723, 1072 [Google Scholar]
- Brown, W. R., Gianninas, A., Kilic, M., Kenyon, S. J., & Allende Prieto, C. 2016, ApJ, 818, 155 [Google Scholar]
- Buckner, A. J., & Sandquist, E. L. 2018, Res. Notes Am. Astron. Soc., 2, 151 [NASA ADS] [Google Scholar]
- Cantat-Gaudin, T., Anders, F., Castro-Ginard, A., et al. 2020, A&A, 640, A1 [NASA ADS] [CrossRef] [EDP Sciences] [Google Scholar]
- Castelli, F., & Kurucz, R. L. 2003, in Modelling of Stellar Atmospheres, eds. N. Piskunov, W. W. Weiss, & D. F. Gray, 210, A20 [Google Scholar]
- Chambers, K. C., Magnier, E. A., Metcalfe, N., et al. 2016, arXiv e-prints [arXiv:1612.05560] [Google Scholar]
- Crawford, D. L., & Barnes, J. V. 1970, AJ, 75, 946 [NASA ADS] [CrossRef] [Google Scholar]
- Cummings, J. D., Kalirai, J. S., Tremblay, P. E., Ramirez-Ruiz, E., & Choi, J. 2018, ApJ, 866, 21 [NASA ADS] [CrossRef] [Google Scholar]
- Dattatrey, A. K., Yadav, R. K. S., Kumawat, G., et al. 2023, MNRAS, 523, L58 [CrossRef] [Google Scholar]
- Ebbighausen, E. G. 1939, ApJ, 89, 431 [NASA ADS] [CrossRef] [Google Scholar]
- Eggen, O. J. 1963, ApJ, 138, 356 [NASA ADS] [CrossRef] [Google Scholar]
- Fitzpatrick, E. L. 1999, PASP, 111, 63 [Google Scholar]
- Gaia Collaboration (Vallenari, A., et al.) 2023, A&A, 674, A1 [NASA ADS] [CrossRef] [EDP Sciences] [Google Scholar]
- Geier, S. 2020, A&A, 635, A193 [NASA ADS] [CrossRef] [EDP Sciences] [Google Scholar]
- Giardino, G., Pillitteri, I., Favata, F., & Micela, G. 2008, A&A, 490, 113 [NASA ADS] [CrossRef] [EDP Sciences] [Google Scholar]
- Hauck, B., & Mermilliod, M. 1998, A&AS, 129, 431 [NASA ADS] [CrossRef] [EDP Sciences] [Google Scholar]
- Hills, J. G., & Day, C. A. 1976, Astrophys. Lett., 17, 87 [NASA ADS] [Google Scholar]
- Hobbs, L. M., & Pilachowski, C. 1986, ApJ, 309, L17 [Google Scholar]
- Hobbs, L. M., & Thorburn, J. A. 1992, AJ, 104, 669 [NASA ADS] [CrossRef] [Google Scholar]
- Indebetouw, R., Mathis, J. S., Babler, B. L., et al. 2005, ApJ, 619, 931 [NASA ADS] [CrossRef] [Google Scholar]
- Jadhav, V. V. 2022, arXiv e-prints [arXiv:2207.03780] [Google Scholar]
- Jadhav, V. V., & Subramaniam, A. 2021, MNRAS, 507, 1699 [NASA ADS] [CrossRef] [Google Scholar]
- Jadhav, V. V., Sindhu, N., & Subramaniam, A. 2019, ApJ, 886, 13 [NASA ADS] [CrossRef] [Google Scholar]
- Jadhav, V. V., Pandey, S., Subramaniam, A., & Sagar, R. 2021a, J. Astrophys. Astron., 42, 89 [NASA ADS] [CrossRef] [Google Scholar]
- Jadhav, V. V., Roy, K., Joshi, N., & Subramaniam, A. 2021b, AJ, 162, 264 [NASA ADS] [CrossRef] [Google Scholar]
- Jadhav, V. V., Subramaniam, A., & Sagar, R. 2023, A&A, 676, A47 [NASA ADS] [CrossRef] [EDP Sciences] [Google Scholar]
- Knigge, C., Leigh, N., & Sills, A. 2009, Nature, 457, 288 [NASA ADS] [CrossRef] [Google Scholar]
- Koester, D. 2010, Mem. Soc. Astron. It., 81, 921 [NASA ADS] [Google Scholar]
- Kumar, A., Ghosh, S. K., Hutchings, J., et al. 2012, SPIE Conf. Ser., 8443, 84431N [NASA ADS] [Google Scholar]
- Landsman, W., Aparicio, J., Bergeron, P., Di Stefano, R., & Stecher, T. P. 1997, ApJ, 481, L93 [NASA ADS] [CrossRef] [Google Scholar]
- Leiner, E., Mathieu, R. D., Vanderburg, A., Gosnell, N. M., & Smith, J. C. 2019, ApJ, 881, 47 [Google Scholar]
- Lum, M. G., & Boesgaard, A. M. 2019, ApJ, 878, 99 [NASA ADS] [CrossRef] [Google Scholar]
- Maderak, R. M., Deliyannis, C. P., King, J. R., & Cummings, J. D. 2013, AJ, 146, 143 [NASA ADS] [CrossRef] [Google Scholar]
- Majewski, S. R., Schiavon, R. P., Frinchaboy, P. M., et al. 2017, AJ, 154, 94 [NASA ADS] [CrossRef] [Google Scholar]
- Marsh, T. R., Dhillon, V. S., & Duck, S. R. 1995, MNRAS, 275, 828 [Google Scholar]
- McCrea, W. H. 1964, MNRAS, 128, 147 [Google Scholar]
- Milone, E. F., Schiller, S. J., Mellergaard Amby, T., & Frandsen, S. 2019, AJ, 158, 82 [NASA ADS] [CrossRef] [Google Scholar]
- Murakami, H., Baba, H., Barthel, P., et al. 2007, PASJ, 59, 369 [Google Scholar]
- Nine, A. C., Mathieu, R. D., Gosnell, N. M., & Leiner, E. M. 2023, ApJ, 944, 145 [NASA ADS] [CrossRef] [Google Scholar]
- Onaka, T., Matsuhara, H., Wada, T., et al. 2007, PASJ, 59, 401 [NASA ADS] [Google Scholar]
- Pandey, S., Subramaniam, A., & Jadhav, V. V. 2021, MNRAS, 507, 2373 [NASA ADS] [CrossRef] [Google Scholar]
- Panthi, A., Vaidya, K., Jadhav, V., et al. 2022, MNRAS, 516, 5318 [NASA ADS] [CrossRef] [Google Scholar]
- Panthi, A., Vaidya, K., Vernekar, N., et al. 2024, MNRAS, 527, 8325 [Google Scholar]
- Pelisoli, I., & Vos, J. 2019, MNRAS, 488, 2892 [Google Scholar]
- Pilachowski, C. A., Willmarth, D. W., Mathieu, R. D., et al. 1989, PASP, 101, 991 [NASA ADS] [CrossRef] [Google Scholar]
- Platais, I. 1992, Bulletin d’Information du Centre de Donnees Stellaires, 40, 5 [Google Scholar]
- Postma, J. E., & Leahy, D. 2017, PASP, 129, 115002 [Google Scholar]
- Postma, J. E., & Leahy, D. 2020, PASP, 132, 054503 [Google Scholar]
- Postma, J. E., & Leahy, D. 2021, J. Astrophys. Astron., 42, 30 [NASA ADS] [CrossRef] [Google Scholar]
- Rao, K. K., Vaidya, K., Agarwal, M., et al. 2022, MNRAS, 516, 2444 [NASA ADS] [CrossRef] [Google Scholar]
- Sandage, A. R. 1953, AJ, 58, 61 [Google Scholar]
- Sandquist, E. L., Buckner, A. J., Shetrone, M. D., et al. 2023, AJ, 165, 6 [NASA ADS] [CrossRef] [Google Scholar]
- Siegel, M. H., LaPorte, S. J., Porterfield, B. L., Hagen, L. M. Z., & Gronwall, C. A. 2019, AJ, 158, 35 [Google Scholar]
- Sindhu, N., Subramaniam, A., Jadhav, V. V., et al. 2019, ApJ, 882, 43 [NASA ADS] [CrossRef] [Google Scholar]
- Skrutskie, M. F., Cutri, R. M., Stiening, R., et al. 2006, AJ, 131, 1163 [NASA ADS] [CrossRef] [Google Scholar]
- Subramaniam, A., Sindhu, N., Tandon, S. N., et al. 2016, ApJ, 833, L27 [CrossRef] [Google Scholar]
- Subramaniam, A., Pandey, S., Jadhav, V. V., & Sahu, S. 2020, J. Astrophys. Astron., 41, 45 [NASA ADS] [CrossRef] [Google Scholar]
- Tandon, S. N., Subramaniam, A., Girish, V., et al. 2017, AJ, 154, 128 [NASA ADS] [CrossRef] [Google Scholar]
- Tandon, S. N., Postma, J., Joseph, P., et al. 2020, AJ, 159, 158 [Google Scholar]
- Tody, D. 1993, ASP Conf. Ser., 52, 173 [NASA ADS] [Google Scholar]
- Tremblay, P. E., & Bergeron, P. 2009, ApJ, 696, 1755 [Google Scholar]
- Twarog, B. A., Anthony-Twarog, B. J., Deliyannis, C. P., & Thomas, D. T. 2015, AJ, 150, 134 [CrossRef] [Google Scholar]
- Vaidya, K., Panthi, A., Agarwal, M., et al. 2022, MNRAS, 511, 2274 [NASA ADS] [CrossRef] [Google Scholar]
- Wright, E. L., Eisenhardt, P. R. M., Mainzer, A. K., et al. 2010, AJ, 140, 1868 [Google Scholar]
Appendix A: Supplementary figures
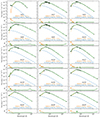 |
Fig. A.1. Binary SED fittings of the NGC 752 members. The red, blue, and green curves represent model SEDs of the cooler component, the hotter component, and the binary system, respectively. The black error bars and hollow circles show the fitted and non-fitted observed flux, respectively. The bottom panels in each SED show the FR in each fit with colours similar to the SEDs. |
All Tables
All Figures
|
Fig. 1. Photometric properties of NGC 752. (a) Spatial distribution of NGC 752 members and UV detections. The Gaia-based cluster members (grey circles), UVOT detections (red triangles), UVIT detections (blue-filled triangles), and the stars brighter than 15.8 Gmag analysed via SED fitting (grey-filled circles) are shown. The large grey circle denotes the UVOT field of view. (b) Photometric errors in UVIT/F148W and UVIT/F169M photometry. Cluster members are shown as blue circles, while all UV detections are shown with dots. The magnitude errors in the F169M filter are offset by 0.2 mag for clarity. (c) Gaia CMD of the cluster members and their UV detections. The symbols are the same as in panel a. (d) UVOT-Gaia CMD. (e) UVIT-Gaia CMD. (f) UVIT-UVOT CMD. The reddened PARSEC isochrone (grey curve) and binary isochrone (dashed grey curve) are shown for reference in panels c–f. |
| In the text | |
|
Fig. 2. HRD positions of NGC 752 members and their companions. The NGC 752 members with UV excess and a binary fit are shown as red-filled squares, and hot companion candidates as blue-filled squares. Cyan crosses mark the X-ray-detected sources. Previously detected compact companions in the OCs King 2 (green diamonds), M67 (green squares), Melotte 66 (green star), NGC 188 (green circles), NGC 2506 (green downward pointing triangles), NGC 6971 (green upward pointing triangles), NGC 7142 (green leftward pointing triangles), and NGC 7789 (green rightward pointing triangles) are also shown. The cluster isochrone (grey curve), Bergeron et al. (1995) WD cooling curves (dashed grey curves), Althaus et al. (2013) WD cooling curves (dotted grey curves), and HRD positions of field sdBs (blue dots) and ELMs (red dots) are shown for reference. |
| In the text | |
|
Fig. A.1. Binary SED fittings of the NGC 752 members. The red, blue, and green curves represent model SEDs of the cooler component, the hotter component, and the binary system, respectively. The black error bars and hollow circles show the fitted and non-fitted observed flux, respectively. The bottom panels in each SED show the FR in each fit with colours similar to the SEDs. |
| In the text | |
Current usage metrics show cumulative count of Article Views (full-text article views including HTML views, PDF and ePub downloads, according to the available data) and Abstracts Views on Vision4Press platform.
Data correspond to usage on the plateform after 2015. The current usage metrics is available 48-96 hours after online publication and is updated daily on week days.
Initial download of the metrics may take a while.