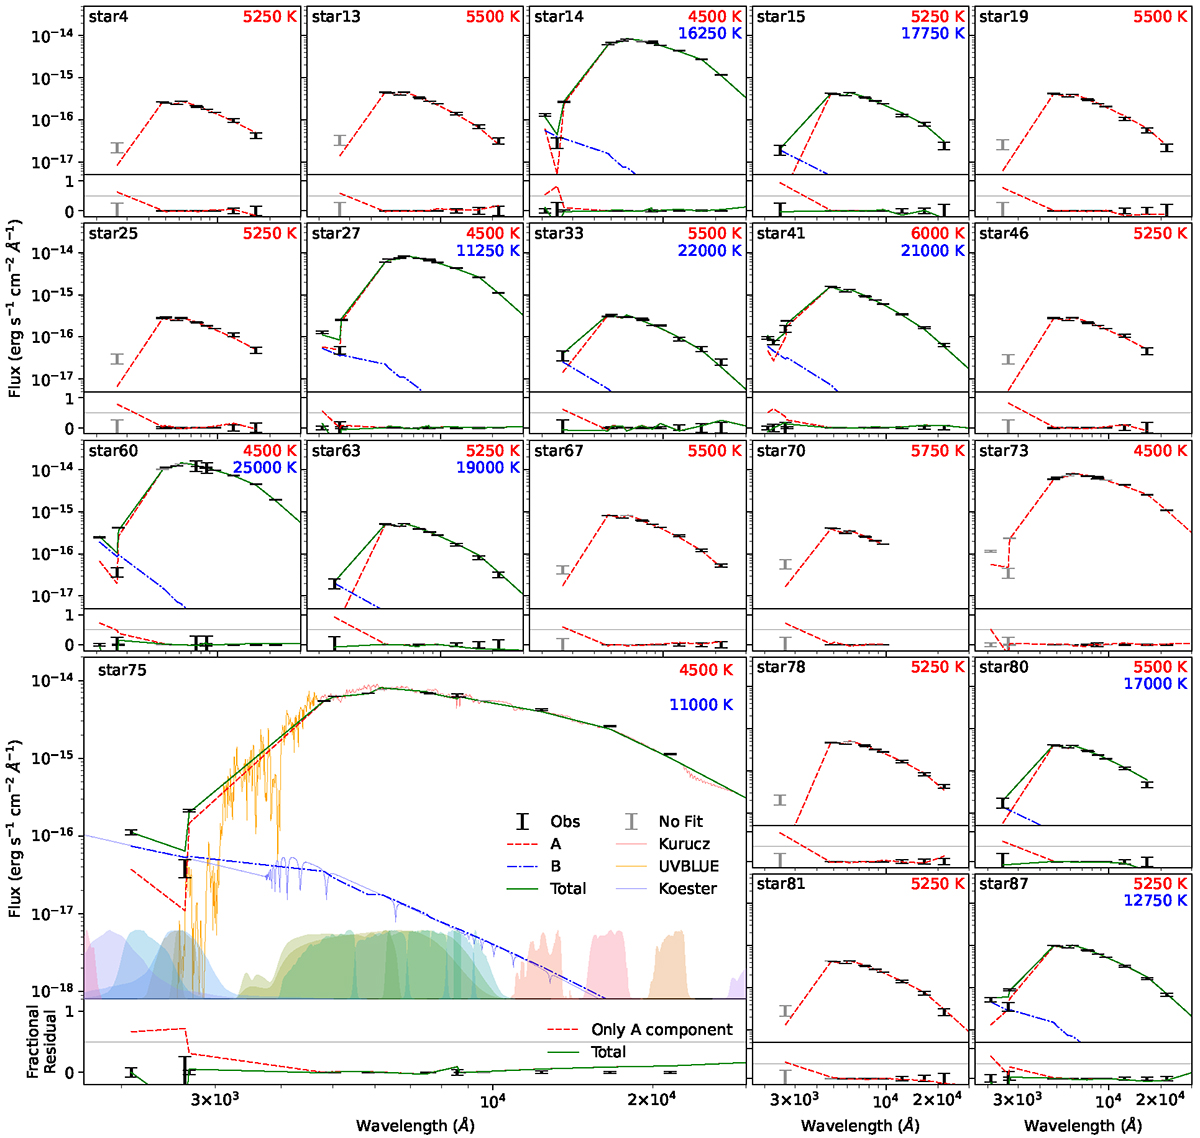
Fig. 2.
Download original image
SEDs of stars with fractional UV excess of more than 0.5 in at least one filter. The top panel for each star shows the observed flux (black error bars), data omitted while fitting the SED (grey error bars), the fitted Kurucz+UVBLUE model (red dashed curve), the fitted Koester model (blue dot-dashed curve; wherever applicable), and total model flux (green curve; wherever applicable). The bottom panel shows the residual flux after the single component fit (red dashed curve) and the double component fitting (green curve). The panel for star75 shows extra details such as the high-resolution spectral models (Kurucz: red, UVBLUE: orange, Koester: blue) and the used filter transmission curves (filled curves at the bottom).
Current usage metrics show cumulative count of Article Views (full-text article views including HTML views, PDF and ePub downloads, according to the available data) and Abstracts Views on Vision4Press platform.
Data correspond to usage on the plateform after 2015. The current usage metrics is available 48-96 hours after online publication and is updated daily on week days.
Initial download of the metrics may take a while.