| Issue |
A&A
Volume 675, July 2023
|
|
|---|---|---|
| Article Number | L4 | |
| Number of page(s) | 6 | |
| Section | Letters to the Editor | |
| DOI | https://doi.org/10.1051/0004-6361/202346964 | |
| Published online | 06 July 2023 | |
Letter to the Editor
Spectroscopy of the supernova H0pe host galaxy at redshift 1.78
1
INAF – Istituto di Astrofisica Spaziale e Fisica Cosmica Milano, Via A. Corti 12, 20133 Milano, Italy
e-mail: This email address is being protected from spambots. You need JavaScript enabled to view it.
2
INAF-Osservatorio Astronomico di Trieste, Via Bazzoni 2, 34124 Trieste, Italy
3
Steward Observatory, University of Arizona, 933 N Cherry Ave, Tucson, AZ 85721-0009, USA
4
Large Binocular Telescope Observatory, 933 North Cherry Ave, Tucson, AZ 85721, USA
5
Univ. Lyon, Univ. Lyon1, ENS de Lyon, CNRS, Centre de Recherche Astrophysique de Lyon UMR5574, 69230 Saint-Genis-Laval, France
6
Department of Astronomy, University of California, 501 Campbell Hall #3411, Berkeley, CA 94720, USA
7
Center for Astrophysics | Harvard & Smithsonian, 60 Garden Street, Cambridge, MA 02138, USA
8
School of Earth and Space Exploration, Arizona State University, Tempe, AZ 85287-1404, USA
9
Chinese Academy of Sciences South America Center for Astronomy, National Astronomical Observatories, CAS, Beijing 100101, PR China
10
CAS Key Laboratory of Optical Astronomy, National Astronomical Observatories, Chinese Academy of Sciences, Beijing 100101, PR China
11
Space Telescope Science Institute, 3700 San Martin Drive, Baltimore, MD 21218, USA
12
Association of Universities for Research in Astronomy (AURA) for the European Space Agency (ESA), STScI, Baltimore, MD 21218, USA
13
Center for Astrophysical Sciences, Department of Physics and Astronomy, The Johns Hopkins University, 3400 N Charles, St. Baltimore, MD 21218, USA
14
Jodrell Bank Centre for Astrophysics, Alan Turing Building, University of Manchester, Oxford Road, Manchester M13 9PL, UK
15
Department of Physics, University of California, 366 Physics North MC 7300, Berkeley, CA 94720, USA
16
FCA, Instituto de Fisica de Cantabria (UC-CSIC), Av. de Los Castros s/n, 39005 Santander, Spain
17
Université Paris-Saclay, CNRS, Institut d’Astrophysique Spatiale, 91405 Orsay, France
18
International Centre for Radio Astronomy Research (ICRAR) and the International Space Centre (ISC), The University of Western Australia, M468 35 Stirling Highway, Crawley
19
ARC Centre of Excellence for All Sky Astrophysics in 3 Dimensions (ASTRO 3D), Australia
20
INAF Osservatorio Astronomico di Roma, Via Frascati 33, 00078 Monteporzio Catone, Rome, Italy
21
Physics Department, Ben-Gurion University of the Negev, PO Box 653 Be’er-Sheva 8410501, Israel
22
European Southern Observatory, Alonso de Córdova 3107, Vitacura, Casilla, 19001 Santiago de Chile, Chile
23
School of Physics and Astronomy, University of Minnesota, 116 Church Street SE, Minneapolis, MN 55455, USA
24
National Research Council of Canada, Herzberg Astronomy & Astrophysics Research Centre, 5071 West Saanich Road, Victoria, BC V9E 2E7, Canada
25
Minnesota State University-Mankato, Telescope Science Institute, TN141, Mankato, MN 56001, USA
26
Max-Planck-Institut für extraterrestrische Physi, Garching 85741, Germany
27
Department of Physics and Astronomy, University of Missouri, Columbia, MO 65211, USA
28
Department of Astronomy, University of Massachusetts at Amherst, Amherst, MA 01003, USA
Received:
22
May
2023
Accepted:
20
June
2023
Abstract
Supernova (SN) H0pe was discovered as a new transient in James Webb Space Telescope (JWST) NIRCam images of the galaxy cluster PLCK G165.7+67.0 taken as part of the Prime Extragalactic Areas for Reionization and Lensing Science (PEARLS) JWST GTO program (ID 1176) on 2023 March 30. The transient is a compact source associated with a background galaxy that is stretched and triply imaged by the strong gravitational lensing of the cluster. This paper reports spectra in the 950–1370 nm observer frame of two of the galaxy images obtained with Large Binocular Telescope (LBT) Utility Camera in the Infrared (LUCI) in long-slit mode two weeks after the JWST observations. The individual and average spectra show the [O II] λλ3727,3730 doublet and the Balmer and 4000 Å breaks at redshift z = 1.783 ± 0.002. The code investigating galaxy emission (CIGALE) best-fit model of the spectral energy distribution indicates that the host galaxy of SN H0pe is massive (Mstar ≃ 6 × 10¹⁰ M⊙ after correcting for a magnification factor μ ∼ 7) with a predominantly intermediate-age (∼2 Gyr) stellar population, moderate extinction, and a magnification-corrected star formation rate ≃13 M⊙ yr−1, consistent with being below the main sequence of star formation. These properties suggest that H0pe might be a type Ia SN. Additional observations of SN H0pe and its host recently carried out with JWST (JWST-DD-4446; PI: B. Frye) will be able to both determine the SN classification and confirm its association with the galaxy analyzed in this work.
Key words: galaxies: high-redshift / galaxies: star formation / supernovae: individual: SN H0pe
© The Authors 2023
 Open Access article, published by EDP Sciences, under the terms of the Creative Commons Attribution License (https://creativecommons.org/licenses/by/4.0), which permits unrestricted use, distribution, and reproduction in any medium, provided the original work is properly cited.
This article is published in open access under the Subscribe to Open model. This email address is being protected from spambots. You need JavaScript enabled to view it. to support open access publication.
1. Introduction
The James Webb Space Telescope (JWST; Gardner et al. 2006; Rieke et al. 2005; Beichman et al. 2012; Windhorst et al. 2008), with its unprecedented sensitivity and spatial resolution at infrared wavelengths, can be used as a time machine to capture the light even from single stars early in the history of the Universe from their birth in a dusty cradle to their spectacular death in the form of supernovae (SNe; Welch et al. 2022; Diego et al. 2023; Vanzella et al. 2023; Meena et al. 2023; Kelly et al. 2023).
Recently, Frye et al. (2023) announced the discovery of an SN in a galaxy at a photometric redshift of ∼1.8 in JWST/NIRCam multiband observations obtained as part of the Prime Extragalactic Areas for Reionization and Lensing Science (PEARLS) GTO Program (ID 1176, PI: Windhorst; Windhorst et al. 2023) in the PLCK G165.7+67.0 field (G165 hereinafter). G165 is a massive (M600 kpc = 2.4 × 10¹⁴ M⊙) galaxy cluster at z = 0.35 (Cañameras et al. 2018; Frye et al. 2019; Pascale et al. 2022). The cluster strongly lenses numerous background galaxies, including bright submillimeter (submm) galaxies at z ≳ 2 (Harrington et al. 2016), and indeed, G165 was discovered by the Planck telescope because of its bright submm emission (Planck Collaboration Int. XXVII 2015; Planck Collaboration Int. XXXIX 2016). Comparison of the new JWST/NIRCam images with point spread function (psf) matched archival images from Wide Field Camera 3 (WFC3) on the Hubble Space Telescope (HST; Miley et al. 2004; Zirm et al. 2005) revealed a new, point-like source associated with a triply imaged galaxy. The magnification factor of the lensed galaxy is estimated to be μ ∼ 3 − 16 across the three images, designated 2a, 2b, and 2c (Fig. 1; Frye et al. 2019; Pascale et al. 2022; Kamieneski, priv. comm.). The new source is visible next to all three of the lensed galaxy images (see Fig. 2) and was named “SN H0pe” because it offers the potential of a new, independent measurement of the Hubble–Lemaître constant H0.
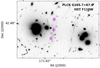 |
Fig. 1. Archival HST/WFC3 F110W negative image of the PLCK G165.7+67.0 field (1′×0.7′). The triply imaged arcs 2a, 2b, and 2c of the SN H0pe host galaxy are highlighted with magenta circles with a radius of 1″ (credits: Frye et al. 2019). The highlighted regions are part of an arc produced by strong lensing from the foreground galaxy cluster. |
The apparent SN discovery prompted follow-up spectroscopic observations with the goal of measuring the spectroscopic redshift of the host galaxy. The redshift was needed to plan effective observations to determine the redshift and type of the SN. Because the SN light fades with time, these observations had to be carried out as soon as possible after the SN discovery. Through a concerted effort of the Large Binocular Telescope (LBT; Hill et al. 2012) consortium, long-slit spectroscopic observations with the LBT Utility Camera in the Infrared (LUCI; Seifert et al. 2003, 2010; Ageorges et al. 2010; Buschkamp et al. 2012) were quickly planned, carried out, reduced, and analyzed.
This Letter presents the results of the LUCI observations: the first spectroscopic measurement and characterization of the SN H0pe host galaxy. The study of even a single SN host galaxy is important because we can learn about SN progenitors and SN host demographics, and quantify the effects of the host age, metallicity, and dust extinction on SN measurements. This is especially relevant at high redshift as some evolutionary trends could mimic cosmological effects.
Additional spectroscopic and multi-epoch imaging observations were carried out with the JWST after the LBT observations (program JWST-DD-4446; PI: B. Frye). These observations, which will be presented in a future work, will help us to establish the SN type, verify its association with the triply imaged galaxy, and measure H0. Throughout this study, we adopt a Chabrier (2003) initial mass function (IMF) and a flat Λ cold dark matter (CDM) model with cosmological parameters from the Planck 2018 release (i.e., ΩΛ = 0.685; Ωm = 0.315; H0 = 67.4 km s−1 Mpc−1; Planck Collaboration VI 2020). All colors and magnitudes quoted in this paper are expressed in the AB system (Oke & Gunn 1983).
2. Spectroscopic observations with the Large Binocular Telescope
Long-slit spectroscopic observations of the SN host were obtained with LUCI on the LBT (Program INAF-2023A-777; PI: M. Nonino). Observations were carried out on UT 2023 April 16 by the LBTB team with the support of the LBT staff of the University of Arizona. Observations used the N1.8 camera (0 249 pixel−1) and the second order of the G200 grating with the zJspec filter, resulting in a wavelength coverage from 950 to 1370 nm in the observer frame. The slit width was 1″, which results in a spectral resolution R ∼ 1200. This is sufficient to identify the 400 nm break, strong emission lines, and absorption features at the expected source redshift. The main goal of these observations was to obtain a spectroscopic redshift and the optical rest-frame spectrum of two images of the galaxy associated with SN H0pe, sources 2a (α2000 = 11:27:15.33; δ2000 = 42:28:41.07) and 2b (α2000 = 11:27:15.60; δ2000 = 42:28:34.13) (Frye et al. 2019). To center the 1″×200″ long-slit on source 2b, which is the brighter of the two target images, the telescope was blindly offset by ∼5″ from a bright source. The slit had a position angle (PA) of 157° in order to include image 2a of the SN host as well. Figure 2 shows a multiband JWST image from the PEARLS program of the two host images with the long-slit position superimposed. The respective SN images were also in the slit, but probably contributed < 8% of the observed light (m(F160W)2b ≃ 21.12 vs. m(F150W)SNb ≃ 23.91; Pascale et al. 2022; Frye et al. 2023.) Eight additional objects, six of which are within the JWST/NIRCam field of view, were serendipitously detected in the slit. These other objects will be discussed in a future work.
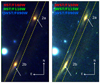 |
Fig. 2. Multiband 7″×12″ images of SN H0PE and its host galaxy. Left panel: HST images taken in 2015–2016 (red: HST/F160W, green: HST/F110W; Cy23, GO-14223, PI: Frye) and JWST image (blue: F090W) taken on 2023 March 30, about two weeks before the LBT spectroscopic observation reported here. Right panel: JWST images taken on 2023 March 30 (red: JWST/F150W, green: JWST/F115W, and blue: JWST/F090W). The JWST images are from the PEARLS GTO program and are adapted from https://www.as.arizona.edu/bright-and-shiny-result-pearls. The two SN H0pe host-galaxy images 2a and 2b are labeled, and the SN positions are marked with white arrows. The dashed yellow lines mark the slit edges at PA = 157°. |
The observations were carried out in binocular mode and were divided into 36 300 s exposures per arm, resulting in a total exposure time of 6 h. The telescope was nodded along the direction of the slit with 4″ offsets to obtain good sky subtraction during the data reduction. A star was observed at the end of the observations for flux calibration and to correct for atmospheric absorption. Flat-field exposures were taken on the same day as the observations. The observing conditions were good, with a clear sky, an average airmass of 1.03, and a seeing of 1″.
Data reduction was carried out by the Italian LBT support team using the spectroscopic interactive pipeline and graphical interface (SIPGI) pipeline developed at INAF IASF-Milan (Gargiulo et al. 2022). This included flat-fielding, dark subtraction, sky subtraction, correction for bad pixels, cosmic rays, and distortions, and wavelength and flux calibration. From each scientific exposure, the background level was first removed by subtracting the subsequent dithered frame in the observing sequence. Possible background residuals were then estimated and removed by fitting all the pixels on the sky along the spatial direction of each column with a polynomial. Wavelength calibration was carried out using OH sky lines and reaches an accuracy of 0.25 Å. For each source detected in the final flux-calibrated 2D spectrum, the flux calibrated 1D spectrum was extracted, and the associated sky and noise spectra were produced.
3. Spectroscopic redshift measurement
The LBT spectra of 2a and 2b are shown in Fig. 3 along with their average and the sky spectrum. We measured the redshift of each spectrum and of the averaged one using the EZ code (Garilli et al. 2010). EZ derives the redshift through a weighted cross-correlation between the observed spectrum over a specific wavelength range (980–1350 nm in this case) and a library of galaxy spectral templates. EZ takes strong emission features as well as the continuum shape in the redshift determination into account. EZ selected a red elliptical at ⟨zspec⟩ = 1.783 (z = 1.782, 1.784, and 1.783 for 2a, 2b, and the averaged spectrum, respectively) as best-fit template. Because EZ uses a library of templates rather than actual fits, we derived the best spectral model using the BAGPIPES code (Carnall et al. 2021). The redshifts were fixed at the measured values, and other parameters included a double-exponential star formation history (SFH), the stellar population models of Bruzual & Charlot (2003), and the Calzetti et al. (2000) attenuation law. The BAGPIPES best-fit models at the EZ spectroscopic redshifts, shown in Fig. 3, are consistent with the spectra having Ca II HK K and H absorption lines (at rest 3934.8 Å and 3969.6 Å), the [O II] λλ3727,3730 doublet, and the Balmer (3646 Å) and 4000 Å breaks. The signal-to-noise ratios of the [O II], K, and H lines, computed as the difference between the line peak and the interpolated continuum at the line wavelength, divided by the rms of the spectrum in a 200 Å region centered on each line, are 3.5, 0.6, and 0.7, respectively. The measured Balmer and 4000 Å breaks1 are 1.48±0.25 and 1.57±0.25, respectively. While the only spectral features that are significantly detected individually are the [O II] doublet and the breaks in the continuum, all features contribute to the correlation signal. The width of the [O II] doublet constrains the spectroscopic redshift to between 1.781 and 1.785, which is consistent with the EZ measurement. We therefore report z = 1.783 ± 0.002 as a best estimate and conservative uncertainty. This spectroscopic redshift is an important factor for obtaining a robust lens model of the triply imaged system and enabling precision cosmology with SN H0pe (Johnson & Sharon 2016).
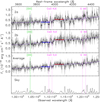 |
Fig. 3. Smoothed (Δλ = 17.2 Å) and cropped LBT/LUCI spectra (solid black line) of the SN H0pe host from image 2a (top panel), 2b (second panel), the averaged spectrum (third panel), and the sky (bottom panel). The shaded gray area shows the 1σ noise. The main spectral features are labeled with vertical dotted green (for emission) and magenta (for absorption) lines. The purple line represents the BAGPIPES best-fit model. The average flux densities in the rest-frame wavelength intervals 385–394 nm and 400–410 nm that were used to compute the D4000n index are shown with horizontal blue and red lines, respectively. |
4. Properties of the SN host galaxy
To characterize the SN host, we analyzed its spectral energy distribution (SED). For this study, we considered only source 2b, for which multiband photometric measurements are available (see ID 3 in Table 2 of Pascale et al. 2022). The data include LBT/LBC (g and i), HST/WFC3 (F110W, F160W), LBT/LUCI (K), and Spitzer/IRAC (3.6, 4.5 μm). Based on a preliminary analysis of the JWST/NIRCam imaging, these measurements are affected by a magnification factor  (Kamieneski, priv. comm.). We modeled the SED of source 2b with the code investigating galaxy emission (CIGALE; Boquien et al. 2019). The code provides constraints on the age of the stellar components and estimates of dust extinction, stellar mass, and SFR. We fixed the redshift at the EZ value obtained from the spectrum and adopted a model with a delayed SFH, a Chabrier (2003) initial mass function (IMF), the stellar population models of Bruzual & Charlot (2003), solar metallicity (Z = 0.02), and the Calzetti et al. (2000) attenuation law. The best fit was determined as the template with the lowest χ2, and the best-fit parameters and associated uncertainties are the likelihood-weighted means and standard deviations, respectively. The results are consistent with the spectral fit from BAGPIPES. The derived stellar age is 2.5±0.5 Gyr, and the magnified stellar mass and SFR (i.e., as calculated without correcting for magnification) are, respectively, log(μMstar/M⊙) = 11.6 ± 0.1 and μSFR < 130 M⊙ yr−1, the latter only an upper limit. The fit requires a significant amount of dust extinction, AV = 1.2 ± 0.4. Figure 4 shows the model, the photometry, and the LBT flux-calibrated 1D spectra. The 1D spectrum and the SED agree well, which demonstrates the goodness of the spectral flux calibration. In summary, the CIGALE model indicates that the SN host is a dust-obscured massive galaxy with an intermediate age.
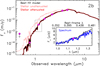 |
Fig. 4. Spectral energy distributions of the SN H0pe host image 2b. The filled magenta circles show the observed photometry, not corrected for magnification, and the arrows represent the 5σ upper limits. The CIGALE best-fit model is shown with a solid black line, the dotted light red line shows the stellar light before dust attenuation, and the solid red line (coincident with the black line) shows the attenuated stellar light. The inset shows the smoothed LBT 1D spectra (solid blue line), the best-fit SED (black line), and the F110W photometric data point (filled magenta circle) in the ranges shown by the dotted rectangles in the main panel. |
An independent measurement of the galaxy SFR can be obtained from the luminosity of the [O II] doublet, which is produced by ionized gas in star-forming regions. Neither the spectrum nor the photometry show evidence of an active galactic nucleus, and no point-like nucleus is seen in the HST images. The [O II] flux obtained by fitting the doublet with a Gaussian profile in the average spectrum is (1.4±0.2)×10−17 ergs cm−2 s−1. The SFR–L([O II]) relation depends on the oxygen abundance (Eq. (5) of Zhuang & Ho 2019). For the SN host galaxy, we adopted log(O/H)+12 = 9.02, the typical value of massive galaxies, as the CIGALE fit shows the SN host to be2. This gives a magnified μSFR = (2.5 ± 0.4) M⊙ yr−1 for the average spectrum. If the [O II] lines are extincted by 3.95 mag3 and the magnification factor is μ ≈ 7 (Kamieneski, priv. comm.), the magnification- and dust-corrected SFR ≃(13±2) M⊙ yr−1. The true SFR might be lower if diffuse stellar sources such as hot post-asymptotic giant branch stars contribute to [O II] (e.g., Belfiore et al. 2016).
The main-sequence SFR for a galaxy of the same mass (corrected for μ ≈ 7) and redshift is 82 M⊙ yr−1, where the uncertainty is derived from the 0.2 dex scatter (Speagle et al. 2014). The [O II] SFR is therefore below the main-sequence value, implying that this system might be transitioning to or already in a passive phase. The galaxy spectrum (Fig. 3) exhibits a 4000 Å break, which is developed by a passively evolving stellar population at 500 Myr (Bica et al. 1994) and increases with age (Kauffmann et al. 2003). The D4000n value in the average spectrum is 1.6±0.3, consistent with the value D4000n ≃ 1.55 that is usually adopted to separate star-forming and passive galaxies (e.g., Gargiulo et al. 2017; Haines et al. 2017). Thus, D4000n agrees with the CIGALE age and with this system being on its way to becoming a passive galaxy.
5. Discussion and perspectives
The discovery of distant SNe and the study of their hosts are important for precision cosmology because the SN properties (i.e., the luminosity at maximum and the rate of decline) depend on the host properties (Hamuy et al. 1995; Sullivan et al. 2006; Williams et al. 2020), and any systematic trends of the latter with redshift could mimic a cosmological effect (Williams et al. 2003; Sullivan et al. 2003; Combes 2004). Examples include redshift-dependent reddening laws (Totani & Kobayashi 1999) or element abundance ratios of the progenitor stars (Höflich et al. 2000; Drell et al. 2000). If the association of SN H0pe with the triply imaged galaxies 2a, 2b, and 2c is confirmed, this SN would be one of the most distant known SNe. To our knowledge and without considering the super luminous SNe (Khetan et al. 2023), only four SNe are currently known at z ≥ 1.8 (i.e., 1.80 < z < 2.26; Jones et al. 2013; Rodney et al. 2015; Rubin et al. 2018), and SN H0pe is the only one with JWST data. This system thus offers an excellent opportunity to study a high-z SN host and the SN itself in detail.
The SN H0pe host-galaxy SED indicates that this system, after correcting for a magnification factor μ = 7, is a massive (Mstar ∼ (6.0 ± 0.8)×1010 M⊙) galaxy with an intermediate age (2.5±0.5 Gyr), significant extinction, and a low star formation rate (SFR ≃ (13 ± 2) M⊙ yr−1), implying that it might be on its way to becoming quiescent or has attained that state already (Speagle et al. 2014). This finding suggests that H0pe might be a type Ia SN, as these occur in all types of galaxies, whereas core-collapse SNe are only found in star-forming galaxies (Kelly & Kirshner 2012). Because only one-third of SNe Ia is found in early-type systems locally and up to intermediate redshifts (Farrah et al. 2002), it is quite exceptional to have caught this SN in such a galaxy. Furthermore, SNe are more difficult to observe in galaxies that are dust obscured. Again, SN Hope beats the odds because the extinction derived for its host is significant. The red color and extinction of the host are unusual for both main-sequence star-forming galaxies (Pacifici et al. 2023) and quiescent galaxies (D’Eugenio et al. 2021). A possible explanation is that the obscuring dust might be in the foreground, perhaps associated with the G165 cluster, as previously suggested by Pascale et al. (2022), but this hypothesis seems unlikely as there is no sign of an intervening galaxy. Intergalactic dust is also implausible because it would not cause reddening (Aguirre & Haiman 2000). The amount of dust extinction, the level of star formation activity, and the lensing magnification factor in this galaxy are quite uncertain. More study is needed to determine the values better. However, the overall characterization of the galaxy as massive and nearing or at quiescence is thought to be secure. The galaxy is intrinsically interesting, and characterizing the dust properties of the SN H0pe host is additionally necessary to correctly analyze the SN measurements.
The analysis of the JWST data from the PEARLS program and the more recent DD observations will yield an improved SED measurement of the triply imaged host and a refined lens model. These will provide better constraints on the star formation activity level and stellar age of the system. In addition, it will be possible to investigate whether the SN is dust extincted and how this might affect the SN measurements. The JWST data will also determine the SN classification, test its association with the triply imaged galaxy, measure time delays of the three lensed images, and provide a precise measurement of H0 (see, e.g., Kelly et al. 2023).
The 4000 Å break is quantified through the D4000n index (Balogh et al. 1999). This was computed as the ratio of the average flux density in the wavelength intervals 400–410 nm and 385–395 nm. The Balmer break was computed as the ratio of the average flux density in the wavelength intervals 380–395 nm and 350–365 nm.
For this abundance, SFR/(M⊙ yr−1) = 7.74× 10−42L[O II]/(erg s−1) (Zhuang & Ho 2019).
The Calzetti et al. (2000) reddening curve gives A3728 Å = 1.45 × AV, but in addition, star-forming gas clouds have a higher extinction than the stellar population (Calzetti 1997), Egas(B − V) = Estar(B − V)/(0.44 ± 0.03).
Acknowledgments
We kindly thank the referee for promptly reviewing the manuscript. M.P. kindly thanks M. Fumana, and P. Franzetti for their assistance in installing and using EZ, F. Cusano for his prompt help with the LBT data retrieval, and D. Burgarella for his support with CIGALE. B.L.F. obtained student support through a Faculty Challenge Grant for Increasing Access to Undergraduate Research, and the Arthur L. and Lee G. Herbst Endowment for Innovation and the Science Dean’s Innovation and Education Fund, both obtained at the University of Arizona. AZ and LJF acknowledge support by Grant No. 2020750 from the United States-Israel Binational Science Foundation (BSF) and Grant No. 2109066 from the United States National Science Foundation (NSF), and by the Ministry of Science & Technology, Israel. The LBT is an international collaboration among institutions in the United States, Italy and Germany. LBT Corporation partners are: The University of Arizona on behalf of the Arizona university system; Istituto Nazionale di Astrofisica, Italy; LBT Beteiligungsgesellschaft, Germany, representing the Max-Planck Society, the Astrophysical Institute Potsdam, and Heidelberg University; The Ohio State University, and The Research Corporation, on behalf of The University of Notre Dame, University of Minnesota, and University of Virginia. We acknowledge the support from the LBT-Italian Coordination Facility for the execution of observations, data distribution and reduction. This research is based on observations made with the NASA/ESA Hubble Space Telescope obtained from the Space Telescope Science Institute, which is operated by the Association of Universities for Research in Astronomy, Inc., under NASA contract NAS 5-26555. These observations are associated with program 14223. This work is based on observations made with the NASA/ESA/CSA James Webb Space Telescope. The data were obtained from the Mikulski Archive for Space Telescopes at the Space Telescope Science Institute, which is operated by the Association of Universities for Research in Astronomy, Inc., under NASA contract NAS 5-03127 for JWST. These observations are associated with JWST program ID 1176. Software: This research made use of astropy, a community developed core Python package for astronomy (Astropy Collaboration 2018), APLpy, an open-source plotting package for Python (Robitaille & Bressert 2012), the IDL Astronomy Library (Landsman 1993); SIPGI (Gargiulo et al. 2022); BAGPIPES (Carnall et al. 2021); EZ (Garilli et al. 2010); and CIGALE (Boquien et al. 2019).
References
- Ageorges, N., Seifert, W., Jütte, M., et al. 2010, Ground-based and Airborne Instrumentation for Astronomy III, Proc. SPIE, 7735, 77351L [NASA ADS] [Google Scholar]
- Aguirre, A., & Haiman, Z. 2000, ApJ, 532, 28 [NASA ADS] [CrossRef] [Google Scholar]
- Astropy Collaboration (Price-Whelan, A. M., et al.) 2018, AJ, 156, 123 [Google Scholar]
- Balogh, M. L., Morris, S. L., Yee, H. K. C., Carlberg, R. G., & Ellingson, E. 1999, ApJ, 527, 54 [Google Scholar]
- Beichman, C. A., Rieke, M., Eisenstein, D., et al. 2012, in Space Telescopes and Instrumentation 2012: Optical, Infrared, and Millimeter Wave, eds. M. C. Clampin, G. G. Fazio, H. A. MacEwen, J. Oschmann, & M. Jacobus, SPIE Conf. Ser., 8442, 84422N [NASA ADS] [CrossRef] [Google Scholar]
- Belfiore, F., Maiolino, R., Maraston, C., et al. 2016, MNRAS, 461, 3111 [Google Scholar]
- Bica, E., Alloin, D., & Schmitt, H. R. 1994, A&A, 283, 805 [NASA ADS] [Google Scholar]
- Boquien, M., Burgarella, D., Roehlly, Y., et al. 2019, A&A, 622, A103 [NASA ADS] [CrossRef] [EDP Sciences] [Google Scholar]
- Bruzual, A. G., & Charlot, S. 2003, MNRAS, 344, 1000 [NASA ADS] [CrossRef] [Google Scholar]
- Buschkamp, P., Seifert, W., Polsterer, K., et al. 2012, Proc. SPIE, 8446, 84465L [NASA ADS] [CrossRef] [Google Scholar]
- Calzetti, D. 1997, AJ, 113, 162 [NASA ADS] [CrossRef] [Google Scholar]
- Calzetti, D., Armus, L., Bohlin, R. C., et al. 2000, ApJ, 533, 682 [NASA ADS] [CrossRef] [Google Scholar]
- Cañameras, R., Nesvadba, N. P. H., Limousin, M., et al. 2018, A&A, 620, A60 [Google Scholar]
- Carnall, A. C., McLure, R. J., Dunlop, J. S., & Davé, R. 2021, Astrophysics Source Code Library [record ascl:2104.017] [Google Scholar]
- Chabrier, G. 2003, PASP, 115, 763 [Google Scholar]
- Combes, F. 2004, New Astron. Rev., 48, 583 [CrossRef] [Google Scholar]
- D’Eugenio, C., Daddi, E., Gobat, R., et al. 2021, A&A, 653, A32 [NASA ADS] [CrossRef] [EDP Sciences] [Google Scholar]
- Diego, J. M., Meena, A. K., Adams, N. J., et al. 2023, A&A, 672, A3 [NASA ADS] [CrossRef] [EDP Sciences] [Google Scholar]
- Drell, P. S., Loredo, T. J., & Wasserman, I. 2000, ApJ, 530, 593 [NASA ADS] [CrossRef] [Google Scholar]
- Farrah, D., Meikle, W. P. S., Clements, D., Rowan-Robinson, M., & Mattila, S. 2002, MNRAS, 336, L17 [NASA ADS] [CrossRef] [Google Scholar]
- Frye, B., Pascale, M., Cohen, S., et al. 2023, Transient Name Server AstroNote, 96, 1 [NASA ADS] [Google Scholar]
- Frye, B. L., Pascale, M., Qin, Y., et al. 2019, ApJ, 871, 51 [NASA ADS] [CrossRef] [Google Scholar]
- Gardner, J. P., Mather, J. C., Clampin, M., et al. 2006, Space Sci. Rev., 123, 485 [Google Scholar]
- Gargiulo, A., Bolzonella, M., Scodeggio, M., et al. 2017, A&A, 606, A113 [NASA ADS] [CrossRef] [EDP Sciences] [Google Scholar]
- Gargiulo, A., Fumana, M., Bisogni, S., et al. 2022, MNRAS, 514, 2902 [NASA ADS] [CrossRef] [Google Scholar]
- Garilli, B., Fumana, M., Franzetti, P., et al. 2010, PASP, 122, 827 [Google Scholar]
- Haines, C. P., Iovino, A., Krywult, J., et al. 2017, A&A, 605, A4 [NASA ADS] [CrossRef] [EDP Sciences] [Google Scholar]
- Hamuy, M., Phillips, M. M., Maza, J., et al. 1995, AJ, 109, 1 [NASA ADS] [CrossRef] [Google Scholar]
- Harrington, K. C., Yun, M. S., Cybulski, R., et al. 2016, MNRAS, 458, 4383 [NASA ADS] [CrossRef] [Google Scholar]
- Hill, J. M., Green, R. F., Ashby, D. S., et al. 2012, Ground-based and Airborne Telescopes IV, Proc. SPIE, 8444, 84441A [NASA ADS] [CrossRef] [Google Scholar]
- Höflich, P., Nomoto, K., Umeda, H., & Wheeler, J. C. 2000, ApJ, 528, 590 [CrossRef] [Google Scholar]
- Johnson, T. L., & Sharon, K. 2016, ApJ, 832, 82 [Google Scholar]
- Jones, D. O., Rodney, S. A., Riess, A. G., et al. 2013, ApJ, 768, 166 [NASA ADS] [CrossRef] [Google Scholar]
- Kauffmann, G., Heckman, T. M., White, S. D. M., et al. 2003, MNRAS, 341, 33 [Google Scholar]
- Kelly, P. L., & Kirshner, R. P. 2012, ApJ, 759, 107 [NASA ADS] [CrossRef] [Google Scholar]
- Kelly, P. L., Rodney, S., Treu, T., et al. 2023, ApJ, 948, 93 [NASA ADS] [CrossRef] [Google Scholar]
- Khetan, N., Cooke, J., & Branchesi, M. 2023, MNRAS, 521, 2814 [NASA ADS] [CrossRef] [Google Scholar]
- Landsman, W. B. 1993, in Astronomical Data Analysis Software and Systems II, eds. R. J. Hanisch, R. J. V. Brissenden, & J. Barnes, ASP Conf. Ser., 52, 246 [Google Scholar]
- Meena, A. K., Zitrin, A., Jiménez-Teja, Y., et al. 2023, ApJ, 944, L6 [NASA ADS] [CrossRef] [Google Scholar]
- Miley, G. K., Overzier, R. A., Tsvetanov, Z. I., et al. 2004, Nature, 427, 47 [NASA ADS] [CrossRef] [Google Scholar]
- Oke, J. B., & Gunn, J. E. 1983, ApJ, 266, 713 [NASA ADS] [CrossRef] [Google Scholar]
- Pacifici, C., Iyer, K. G., Mobasher, B., et al. 2023, ApJ, 944, 141 [NASA ADS] [CrossRef] [Google Scholar]
- Pascale, M., Frye, B. L., Dai, L., et al. 2022, ApJ, 932, 85 [NASA ADS] [CrossRef] [Google Scholar]
- Planck Collaboration Int. XXVII. 2015, A&A, 582, A30 [NASA ADS] [CrossRef] [EDP Sciences] [Google Scholar]
- Planck Collaboration Int. XXXIX. 2016, A&A, 596, A100 [NASA ADS] [CrossRef] [EDP Sciences] [Google Scholar]
- Planck Collaboration VI. 2020, A&A, 641, A6 [NASA ADS] [CrossRef] [EDP Sciences] [Google Scholar]
- Rieke, M. J., Kelly, D., & Horner, S. 2005, in Cryogenic Optical Systems and Instruments XI, eds. J. B. Heaney, & L. G. Burriesci, SPIE Conf. Ser., 5904, 1 [NASA ADS] [Google Scholar]
- Robitaille, T., & Bressert, E. 2012, Astrophysics Source Code Library [record ascl:1208.017] [Google Scholar]
- Rodney, S. A., Riess, A. G., Scolnic, D. M., et al. 2015, AJ, 150, 156 [NASA ADS] [CrossRef] [Google Scholar]
- Rubin, D., Hayden, B., Huang, X., et al. 2018, ApJ, 866, 65 [Google Scholar]
- Seifert, W., Appenzeller, I., Baumeister, H., et al. 2003, in Instrument Design and Performance for Optical/Infrared Ground-based Telescopes, eds. M. Iye, & A. F. M. Moorwood, Proc. SPIE, 4841, 962 [NASA ADS] [CrossRef] [Google Scholar]
- Seifert, W., Ageorges, N., Lehmitz, M., et al. 2010, in Ground-based and Airborne Instrumentation for Astronomy III, Proc. SPIE, 7735, 77357W [NASA ADS] [Google Scholar]
- Speagle, J. S., Steinhardt, C. L., Capak, P. L., & Silverman, J. D. 2014, ApJS, 214, 15 [Google Scholar]
- Sullivan, M., Ellis, R. S., Aldering, G., et al. 2003, MNRAS, 340, 1057 [NASA ADS] [CrossRef] [Google Scholar]
- Sullivan, M., Le Borgne, D., Pritchet, C. J., et al. 2006, ApJ, 648, 868 [NASA ADS] [CrossRef] [Google Scholar]
- Totani, T., & Kobayashi, C. 1999, ApJ, 526, L65 [NASA ADS] [CrossRef] [Google Scholar]
- Vanzella, E., Claeyssens, A., Welch, B., et al. 2023, ApJ, 945, 53 [NASA ADS] [CrossRef] [Google Scholar]
- Welch, B., Coe, D., Zackrisson, E., et al. 2022, ApJ, 940, L1 [NASA ADS] [CrossRef] [Google Scholar]
- Williams, B. F., Hogan, C. J., Barris, B., et al. 2003, AJ, 126, 2608 [NASA ADS] [CrossRef] [Google Scholar]
- Williams, S. C., Hook, I. M., Hayden, B., et al. 2020, MNRAS, 495, 3859 [NASA ADS] [CrossRef] [Google Scholar]
- Windhorst, R. A., Hathi, N. P., Cohen, S. H., et al. 2008, AdSpR, 41, 1965 [NASA ADS] [Google Scholar]
- Windhorst, R. A., Cohen, S. H., Jansen, R. A., et al. 2023, AJ, 165, 13 [NASA ADS] [CrossRef] [Google Scholar]
- Zhuang, M.-Y., & Ho, L. C. 2019, ApJ, 882, 89 [CrossRef] [Google Scholar]
- Zirm, A. W., Overzier, R. A., Miley, G. K., et al. 2005, ApJ, 630, 68 [NASA ADS] [CrossRef] [Google Scholar]
All Figures
|
Fig. 1. Archival HST/WFC3 F110W negative image of the PLCK G165.7+67.0 field (1′×0.7′). The triply imaged arcs 2a, 2b, and 2c of the SN H0pe host galaxy are highlighted with magenta circles with a radius of 1″ (credits: Frye et al. 2019). The highlighted regions are part of an arc produced by strong lensing from the foreground galaxy cluster. |
| In the text | |
|
Fig. 2. Multiband 7″×12″ images of SN H0PE and its host galaxy. Left panel: HST images taken in 2015–2016 (red: HST/F160W, green: HST/F110W; Cy23, GO-14223, PI: Frye) and JWST image (blue: F090W) taken on 2023 March 30, about two weeks before the LBT spectroscopic observation reported here. Right panel: JWST images taken on 2023 March 30 (red: JWST/F150W, green: JWST/F115W, and blue: JWST/F090W). The JWST images are from the PEARLS GTO program and are adapted from https://www.as.arizona.edu/bright-and-shiny-result-pearls. The two SN H0pe host-galaxy images 2a and 2b are labeled, and the SN positions are marked with white arrows. The dashed yellow lines mark the slit edges at PA = 157°. |
| In the text | |
|
Fig. 3. Smoothed (Δλ = 17.2 Å) and cropped LBT/LUCI spectra (solid black line) of the SN H0pe host from image 2a (top panel), 2b (second panel), the averaged spectrum (third panel), and the sky (bottom panel). The shaded gray area shows the 1σ noise. The main spectral features are labeled with vertical dotted green (for emission) and magenta (for absorption) lines. The purple line represents the BAGPIPES best-fit model. The average flux densities in the rest-frame wavelength intervals 385–394 nm and 400–410 nm that were used to compute the D4000n index are shown with horizontal blue and red lines, respectively. |
| In the text | |
|
Fig. 4. Spectral energy distributions of the SN H0pe host image 2b. The filled magenta circles show the observed photometry, not corrected for magnification, and the arrows represent the 5σ upper limits. The CIGALE best-fit model is shown with a solid black line, the dotted light red line shows the stellar light before dust attenuation, and the solid red line (coincident with the black line) shows the attenuated stellar light. The inset shows the smoothed LBT 1D spectra (solid blue line), the best-fit SED (black line), and the F110W photometric data point (filled magenta circle) in the ranges shown by the dotted rectangles in the main panel. |
| In the text | |
Current usage metrics show cumulative count of Article Views (full-text article views including HTML views, PDF and ePub downloads, according to the available data) and Abstracts Views on Vision4Press platform.
Data correspond to usage on the plateform after 2015. The current usage metrics is available 48-96 hours after online publication and is updated daily on week days.
Initial download of the metrics may take a while.