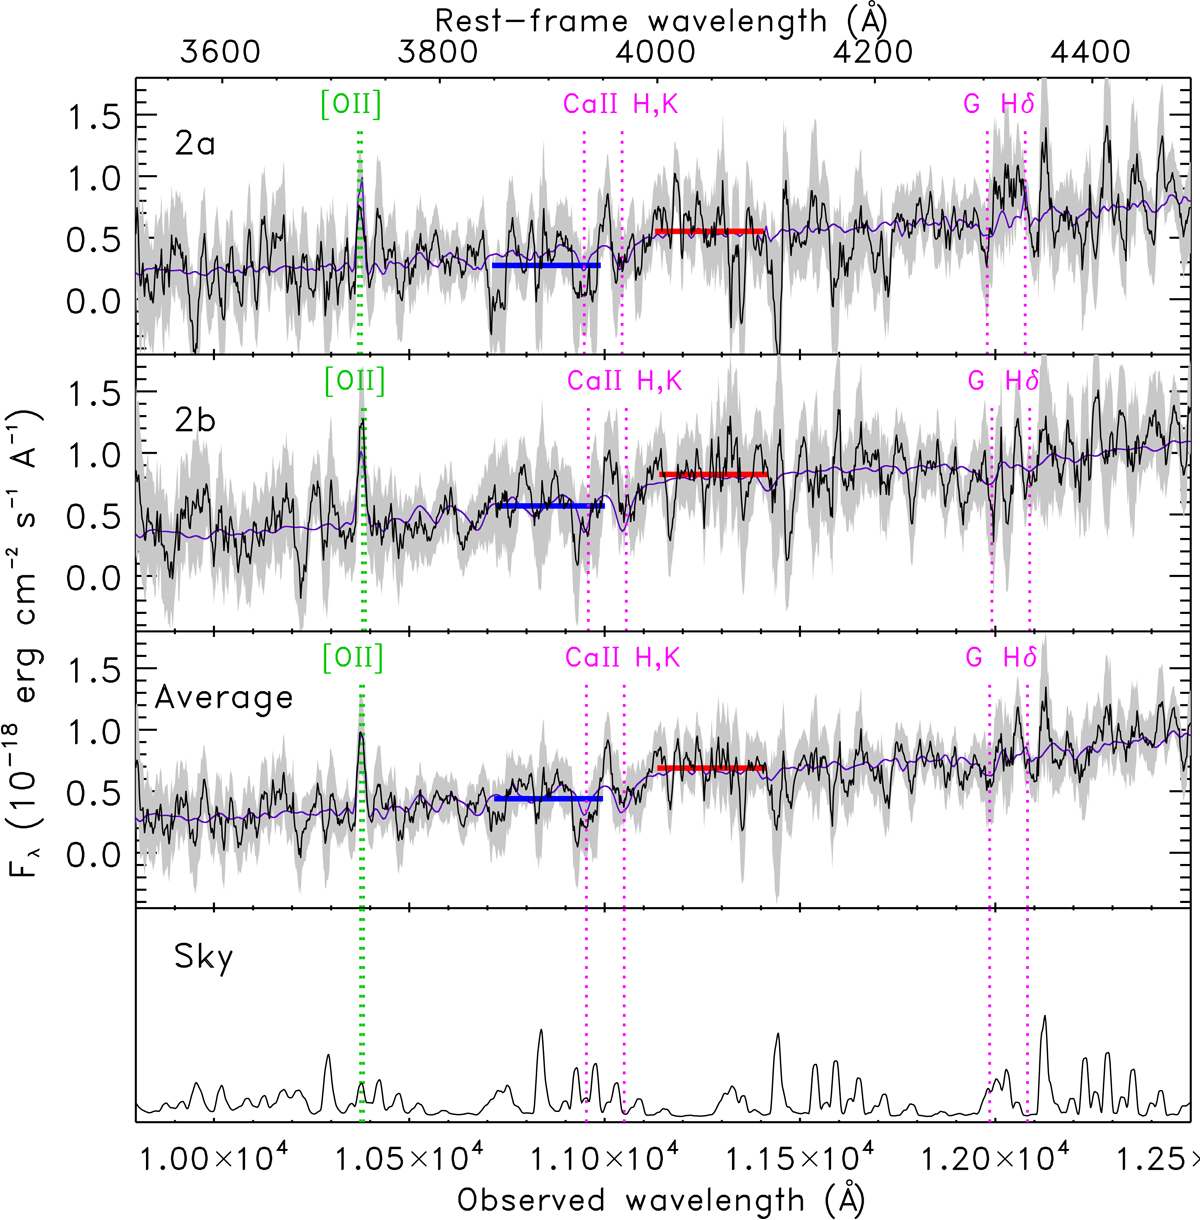
Fig. 3.

Download original image
Smoothed (Δλ = 17.2 Å) and cropped LBT/LUCI spectra (solid black line) of the SN H0pe host from image 2a (top panel), 2b (second panel), the averaged spectrum (third panel), and the sky (bottom panel). The shaded gray area shows the 1σ noise. The main spectral features are labeled with vertical dotted green (for emission) and magenta (for absorption) lines. The purple line represents the BAGPIPES best-fit model. The average flux densities in the rest-frame wavelength intervals 385–394 nm and 400–410 nm that were used to compute the D4000n index are shown with horizontal blue and red lines, respectively.
Current usage metrics show cumulative count of Article Views (full-text article views including HTML views, PDF and ePub downloads, according to the available data) and Abstracts Views on Vision4Press platform.
Data correspond to usage on the plateform after 2015. The current usage metrics is available 48-96 hours after online publication and is updated daily on week days.
Initial download of the metrics may take a while.


