Fig. 4.
Download original image
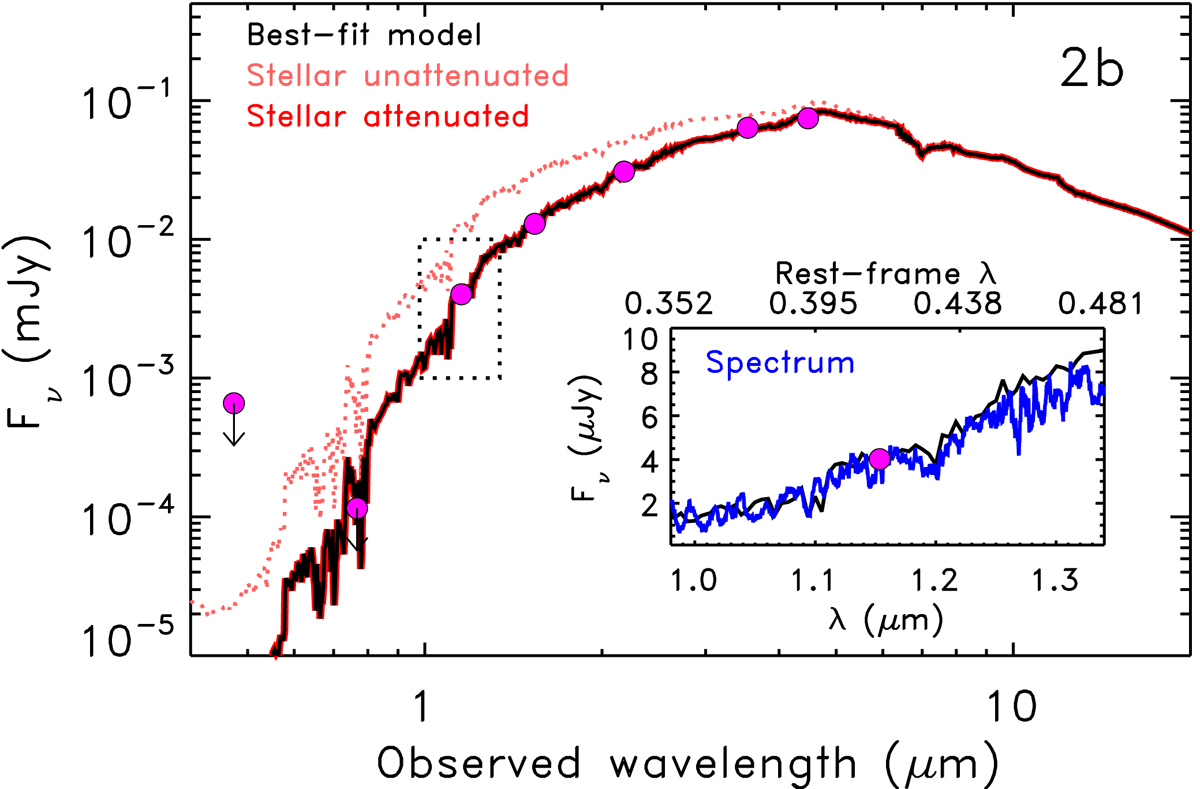
Spectral energy distributions of the SN H0pe host image 2b. The filled magenta circles show the observed photometry, not corrected for magnification, and the arrows represent the 5σ upper limits. The CIGALE best-fit model is shown with a solid black line, the dotted light red line shows the stellar light before dust attenuation, and the solid red line (coincident with the black line) shows the attenuated stellar light. The inset shows the smoothed LBT 1D spectra (solid blue line), the best-fit SED (black line), and the F110W photometric data point (filled magenta circle) in the ranges shown by the dotted rectangles in the main panel.
Current usage metrics show cumulative count of Article Views (full-text article views including HTML views, PDF and ePub downloads, according to the available data) and Abstracts Views on Vision4Press platform.
Data correspond to usage on the plateform after 2015. The current usage metrics is available 48-96 hours after online publication and is updated daily on week days.
Initial download of the metrics may take a while.