| Issue |
A&A
Volume 675, July 2023
|
|
|---|---|---|
| Article Number | A59 | |
| Number of page(s) | 10 | |
| Section | Extragalactic astronomy | |
| DOI | https://doi.org/10.1051/0004-6361/202346521 | |
| Published online | 30 June 2023 | |
The AGN fuelling/feedback cycle in nearby radio galaxies
V. The cold atomic gas of NGC 3100 and its group⋆
1
ASTRON – Netherlands Institute for Radio Astronomy, Oude Hoogeveensedijk 4, 7991 PD Dwingeloo, The Netherlands
e-mail: maccagni@astron.nl
2
INAF – Osservatorio Astronomico di Cagliari, Via della Scienza 5, 09047 Selargius (CA), Italy
3
Cardiff Hub for Astrophysics Research & Technology, School of Physics & Astronomy, Cardiff University, Queens Buildings, The Parade, Cardiff, CF24 3AA
UK
4
INAF – Istituto di Radioastronomia, Via P. Gobetti 101, 40129 Bologna, Italy
5
Armagh Observatory and Planetarium, College Hill, Armagh, BT61 9DG
UK
6
INAF – Osservatorio Astronomico di Capodimonte, Via Moiariello 16, Napoli, 80131
Italy
7
Università di Napoli “Federico II”, Via Cinthia 21, Napoli, 80126
Italy
Received:
28
March
2023
Accepted:
2
May
2023
We present Australia Compact Telescope Array (ATCA) 21 cm observations of the nearby low-excitation radio galaxy (LERG) NGC 3100. This is the brightest galaxy of a loose group and it hosts a young (∼2 Myr) radio source. The ATCA observations reveal for the first time the presence of neutral hydrogen (H I) gas in absorption in the centre of this radio galaxy, and in emission in two low-mass galaxies of the group and in a diffuse dark cloud in the proximity of NGC 3100. The sensitivity to low-column density gas (NHI ∼ 1019 cm−2) allows us to reveal asymmetries in the periphery of most of the H I-detected galaxies, suggesting that tidal interactions may be ongoing. The diffuse cloud does not show a stellar counterpart down to 27 mag arcsec−2 and could be the remnant of these interactions. The analysis of the H I absorption complex in NGC 3100 indicates that the atomic phase of the hydrogen is distributed in the same way as its molecular phase (observed at arcsecond resolution through several carbon monoxide emission lines). We suggest that the interactions occurring within the group are causing turbulent cold gas clouds in the intra-group medium to be slowly accreted towards the centre of NGC 3100. This caused the recent formation of the cold circum-nuclear disc, which is likely sustaining the young nuclear activity.
Key words: galaxies: individual: NGC 3100 / galaxies: active / galaxies: ISM / galaxies: kinematics and dynamics / galaxies: groups: general
The reduced H I datacube is only available at the CDS via anonymous ftp to cdsarc.cds.unistra.fr (130.79.128.5) or via https://cdsarc.cds.unistra.fr/viz-bin/cat/J/A+A/675/A59
© The Authors 2023
 Open Access article, published by EDP Sciences, under the terms of the Creative Commons Attribution License (https://creativecommons.org/licenses/by/4.0), which permits unrestricted use, distribution, and reproduction in any medium, provided the original work is properly cited.
This article is published in open access under the Subscribe to Open model. Subscribe to A&A to support open access publication.
1. Introduction
One of the most demanding requirements of modern galaxy formation theories is to reproduce the observed properties of early-type galaxies (ETGs) in the local Universe. How to prevent over-cooling of gas, why star formation (SF) quenches at late times, and which processes are responsible for the observed scaling relations between central super-massive black holes (SMBHs) and stellar bulges are only some of the subjects of long-standing debate (e.g. D’Onofrio et al. 2021).
Active galactic nuclei (AGNs) and their associated energetic output (i.e. feedback) are widely believed to play a crucial role in shaping galaxies over cosmic time (e.g. Harrison et al. 2018). One of the two main forms of AGN feedback is the so-called kinetic- (or jet-) mode feedback, where the bulk of the energy generated from the SMBH accretion process is channelled into collimated outflows of non-thermal plasma (i.e. the radio jets). The jets play an important role in heating the surrounding interstellar medium (ISM), possibly suppressing SF and maintaining the ETGs as passive, ‘red and dead’ spheroids (e.g. Choi et al. 2015). However, the many details of how radio jets are powered and interact with their surroundings are still not fully understood (e.g. Harrison et al. 2018; Hardcastle 2018).
Important insights into this subject can come from systematic investigations of a particular class of AGN known as low-excitation radio galaxies (LERGs). LERGs are by number the dominant radio galaxy population in the local Universe (e.g. Hardcastle et al. 2007), predominantly hosted by red, massive (M* ≥ 1010 M⊙) ETGs (e.g. Best & Heckman 2012; Miraghaei & Best 2017). These AGN eject most of the energy through collimated radio jets, inducing kinetic feedback into the ISM. Detailed, spatially resolved studies of nearby LERGs are key to probing the formation and evolution of massive ETGs in relation to the fuelling/feedback cycles associated with their nuclear activity.
ETGs are typically devoid of cold (T ≲ 102 K) gas in their centres. However, over the past decade, significant amounts of cold molecular gas and dust sufficient to sustain the low accretion rates of LERGS have been found in the central regions of ETGs (e.g. MH2 ∼ 107 − 1010 M⊙; e.g. Ocaña Flaquer et al. 2010; Prandoni et al. 2010; Ruffa et al. 2019a; Tamhane et al. 2022). The origin of the observed cold material is still hotly debated: it may be either internally generated (for example, through stellar mass loss or hot halo cooling) or externally accreted (e.g. through environmental effects such as mergers and tidal interactions).
In clusters and groups, galaxy encounters, tidal interactions, and hydrodynamical effects such as ram pressure stripping can be responsible for directly driving the gas from the intergalactic medium (IGM) into the centre of galaxies, triggering the nuclear activity (e.g. Ramos Almeida et al. 2012; Poggianti et al. 2017). Moreover, these same phenomena inject turbulence in the environment, which may also generate cooling of gas in the hot halo of galaxies and consequent infall onto the central SMBH, either directly and smoothly (e.g. Negri et al. 2014) or – more realistically – after chaotic cooling (as predicted in chaotic cold accretion (CCA) models; e.g. Gaspari et al. 2015, 2017). Filamentary or blob-like cold gas structures, likely reminiscent of condensing multi-phase gaseous clouds, have been frequently observed extending from the hot halo onto the centre of nearby LERGs in high-density environments, supporting the scenario described above (e.g. Tremblay et al. 2018; Nagai et al. 2019; Maccagni et al. 2021; Tamhane et al. 2022). In high-luminosity radio sources (L1.4 GHz ≳ 1024 W Hz−1), a connection between the evolution and activity of the SMBH, the fuelling cold gas, and the surrounding dense environments is suggested by the tight correlations observed between their hot X-ray-emitting halos, radio jet powers, and molecular gas masses (e.g. Ineson et al. 2015; Pulido et al. 2018; Babyk et al. 2019).
The incidence of environmental phenomena in less powerful radio galaxies (L1.4 GHz ≳ 1022 − 23 W Hz−1) is still highly debated (e.g. Ching et al. 2017). Simulations suggest that these sources are hosted by less massive dark matter haloes (∼1012 M⊙Thomas et al. 2021), where the environment of galaxies is typically less extreme than in clusters. In these galaxies, rotation is often not negligible, and the role of turbulence in funnelling the gas onto the SMBH compared to secular processes occurring within the galaxy and minor interactions in the halos is indeed still unclear (e.g. Sabater et al. 2015; Gaspari et al. 2015; Davis et al. 2019; Temi et al. 2022). Key answers in this regard can come from studies of the distribution and kinematics of the cold gas in LERGs on all scales, from the circum-nuclear to the circum-galactic environments.
Radio interferometers can carry out these studies in nearby AGN by observing the neutral atomic hydrogen (H I) gas at 21 cm wavelengths. H I is often found in the centre of active galaxies (e.g. Morganti et al. 2001; Maccagni et al. 2017; Curran & Duchesne 2018); it traces the emission of cold gas in ETGs beyond the central regions in galaxies and is the most abundant gas phase in the intergalactic medium, allowing us to directly probe the presence of interactions between nearby ETGs (e.g. as shown by the SAURON and ATLAS3D surveys Oosterloo et al. 2010; Serra et al. 2012).
Diffuse (NHI ∼ 1019 cm−2) H I clouds have been associated with outflowing gas in several nearby radio AGN through the detection of high-velocity absorption components against the radio jets (see Morganti & Oosterloo 2018, for a census). However, the sensitivity of past radio interferometers limited these studies to absorption features, which depend strongly on the distribution of the underlying radio continuum, and are therefore very limited in determining the full extent of the detected gas distribution.
The Australia Telescope Compact Array (ATCA) has a wide field of view (∼1 deg2) – which is crucial for studying the H I gas from the circum-nuclear to the circum-galactic regions of nearby AGN – and a combination of short baselines, which make it sensitive to the low-column density neutral hydrogen (albeit at low resolutions, ∼30″ − 90″). Several ATCA H I observations made it possible to obtain promising results in the study of the cold-gas supply mechanism in nearby AGN. For example, in the LERG NGC 612, Emonts et al. (2008) discovered an enormous (140-kpc wide) H I disk connected by a prominent low-column density (≲8 × 1019 cm−2) bridge with its H I-rich companion galaxy NGC 619, indicating that a past interaction between the two galaxies may have channelled large (109 M⊙) amounts of cold gas into this LERG. Deep ATCA H I observations have also showed that the large-scale H I disk of the radio galaxy PKS 1718-649 was likely formed through a gas-rich merger, but that this event is disconnected to the more recent funnelling of cold gas into the centre and consequent triggering of the AGN, as suggested by the H I detected in absorption (Maccagni et al. 2014).
The complex nature of SMBH feeding mechanisms and the wealth of observational evidence that can be derived from a single object clearly indicate the need to expand these studies to larger samples of LERGs. Atacama Large Millimeter/submillimeter Array (ALMA) CO(2–1) observations (e.g. Ruffa et al. 2019b) have shown that (sub-)kpc molecular gas disks are very common in LERGs. We are carrying out the first systematic, spatially resolved, multi-component (stars, hot/warm/cold gas, dust, and radio jet) study of a small but complete sample of 11 LERGs in the southern sky. A full description of the sample can be found in Ruffa et al. (2019a). Although the bulk of this gas is found to be in ordered rotation, low-amplitude perturbations and/or non-circular motions are ubiquitous (Ruffa et al. 2019b), which likely drive the gas towards the SMBH. The origin of the circum-nuclear disks in these sources is still very unclear. Most of them are located in poor environments (i.e. poor groups, pairs, or even isolated). For this reason, we exploit the wide field of view of the ATCA and its high sensitivity to diffuse H I to measure the total mass and distribution of the cold gas that may live in these galaxies and their environment, and conclusively determine which mechanisms (i.e. external, such as interactions, or internal, such as CCA) bring the gas from the circum-galactic to the circum-nuclear regions, thus sustaining their nuclear activity.
We obtained deep ATCA H I observations of all sources in 2020. In this paper, we present the wide-field and high-sensitivity H I observations of the nearby (38 Mpc) source, NGC 31001. Coupling H I data with the deep optical image of NGC 3100 taken in the context of the VST Early-type GAlaxy Survey (VEGAS; e.g. Capaccioli et al. 2015; Iodice et al. 2021) and the previous ALMA CO observations (Ruffa et al. 2019a, 2022), we identify and characterise the processes that brought the cold gas from the circum-galactic environment into the circum-nuclear regions of this LERG and likely fuel its nuclear activity.
The paper is structured as follows. In the following section, we provide a brief description of the main properties of NGC 3100. In Sect. 3, we describe the ATCA observations and data reduction. The data analysis is presented in Sects. 4 and 5. We discuss the results in Sect. 6, before summarising and concluding in Sect. 7.
2. The target: NGC 3100
NGC 3100 is a late S0 galaxy characterised by a patchy dust distribution and a bright nuclear component (Laurikainen et al. 2006). It is the brightest galaxy of a loose group and forms a pair with the barred spiral galaxy NGC 3095 located at a projected linear distance of ≈95 kpc (Fig. 1). Multi-frequency radio continuum data show that NGC 3100 hosts the core-double lobe radio source PKS 0958-314 (P1.4 GHz = 1023 W Hz−1, e.g. Ekers et al. 1989; Ruffa et al. 2019a), with a jet power in the range of 1043 − 1044 erg s−1 (Ruffa et al. 2022). The radio source has a total linear extent of ≈1.8 kpc and there are no indications of radio emission on larger scales (Ruffa et al. 2020). According to the jet-size–age correlations (e.g. O’Dea & Saikia 2021), the AGN can be considered to be in an early phase of its evolution (less than 2 Myr). NGC 3100 was observed with ALMA during Cycles 3 and 6 and resolved with arcsecond resolution in three different CO rotational transitions (up to J = 3). The carbon monoxide is distributed in an edge-on (i = 60°, PA = 220°) rotating (vrot = 345 km s−1) disk extending for ≈2 kpc in the centre of the galaxy. The radio jets expand in a direction close to the plane of the disc. A detailed view of the CO and radio emission in NGC 3100 is given in the zoom-in panel of Fig. 1. The 3D kinematic modelling of the molecular gas disk shows that, overall, the disk is regularly rotating, but several clouds have non-circular motions (Ruffa et al. 2022). These clouds likely form both inflow streaming motions and a jet-induced outflow in the plane of the CO disc, with vmax ≈ 200 km s−1 and Ṁ ≲ 0.12 M⊙ yr−1 (Ruffa et al. 2022). In this paper, we show for the first time that H I gas is present in the central regions of NGC 3100 and its surrounding large-scale environment, and how the study of its distribution and kinematics allows us to determine how the cold gas is supplied to the AGN.
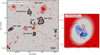 |
Fig. 1. Multi-wavelength view of the group of NGC 3100 and of its circum-nuclear regions. Left panel: Primary beam-corrected H I contours overlaid on a r-band image from VEGAS of the NGC 3100 group. The contour levels are 5σ × 2n Jy km s−1. The lowest contour corresponds to 1.1 × 1019 cm−2. Right panel: VEGAS r-band map zoomed onto the inner 15″ × 15″ (≈2.5 × 2.5 kpc2). The colour scale is inverted compared to the left panel. ALMA CO(2–1) integrated intensity contours from Ruffa et al. (2019b), and radio continuum contours from JVLA data at 10 GHz (Ruffa et al. 2020) are overlaid in blue and red contours, respectively. Contours are drawn at 1, 3, 9, etc. times the 3σ rms noise level. The H I (left panel), CO, and radio continuum (right panel) Gaussian restoring beams are shown in the bottom-left corners. A scale bar is shown in the bottom-right corner of each panel. |
3. Observations and data reduction
3.1. 1.4 GHz ATCA observations
The ATCA observations of NGC 3100 were taken in three separate runs of 12 h each, with different array configurations (see Table 1 for details). The observations were centred at the H I frequency of the systemic velocity of the galaxy, 1409.13 MHz. The Compact Array Broadband Backend (CABB) of the telescope provides a total bandwidth of 64 MHz over 2048 channels (dual polarisation). At the H I frequency, in the Local Universe, the channel width is ≈6.6 km s−1.
ATCA observations and data products.
The data were calibrated and cleaned using MIRIAD (Sault et al. 1995, 2011). A continuum image was produced using the line-free channels. At the resolution of our observations (≈8″), the continuum is unresolved with a flux density of S1.4 GHz = 491.5 mJy. The continuum was subtracted by fitting the visibilities in the line free channels with a first-order polynomial. We detected H I in emission in the field of view (∼1 deg2) of the observations and in absorption in the centre, against NGC 3100. We produced two different datacubes to best retrieve the information from both the H I detected in emission and in absorption. Table 1 reports a complete list of parameters of the two datacubes. For the emission, to increase the signal-to-noise ratio, the final datacube considers visibilities from only five antennas, thus excluding the longest baselines. The restoring beam has a size of 66″ × 41″. To increase the column density sensitivity, we smoothed the cube to a final PSF of 99″ × 86″ and binned three spectral channels together. The noise of the datacube is 0.89 mJy beam−1 at 19.9 km s−1 channel width. Following the equations given by Meyer et al. (2017), at the achieved sensitivity, the minimum detectable column density (3σ) is 6.9 × 1018 cm−2 and the minimum detectable mass is 6 × 10⁶ M⊙. We used SoFiA (Serra et al. 2015) to determine the reliable H I emission of each source. By smoothing and clipping, we convolved the input cube with a set of kernels and detected emission above 3.5 times the local rms noise level of each kernel. We created the H I density map and velocity field using the same software suite. We confirmed the characterisation of the detections also by visually inspecting the datacube.
The optical depth and, consequently, the column density sensitivity of the H I detected in absorption depends on the noise of the observations, but also on the flux of the background continuum source. Hence, in absorption it is possible to reach similar column density sensitivities at higher spatial resolutions than in emission. Keeping all six antennas of the ATCA, we generated a datacube with a restoring beam of 21″ × 19″ and binned three channels together. The rms noise level in the absorption datacube is 0.55 mJy beam−1. Against the 1.4 GHz continuum emission of NGC 3100, this corresponds to a 3σ column density detection limit of 1.2 × 1019 cm−2, assuming a spin temperature of the gas Tspin = 100 K and that the H I fully covers the background continuum spanning over three velocity channels (19.7 km s−1). Taking the background radio-continuum function as the maximum extent of the H I detected in absorption, the minimum detectable mass is 3.4 × 10⁵ M⊙.
3.2. Deep optical images of the NGC 3100 group
New and deep images in the optical g and r bands for the NGC 3100 group were obtained with OmegaCam at VLT Survey Telescope (VST) as part of the VST Early-type GAlaxy Survey (VEGAS; see Iodice et al. 2021) between December 2019 and January 2020. Observations cover a large area (∼1 square degree) around the group, with a pixel scale of 0.21 arcsec pixel−1 (Kuijken 2011). The images were reduced using the dedicated AstroWISE pipeline (see McFarland et al. 2013; Venhola et al. 2017, 2018, for details.). Data were acquired in dark time during the ESO run P104 (run ID: 0104.A-0072[B]). These data were analysed to perform the surface photometry of all group members and constrain the total amount of intra-cluster light in this environment, as published by Ragusa et al. (2023).
Thanks to the long integration time (∼3.5 h and ∼2.75 h on source for the g and r filters, respectively), with these new imaging data we are able to map the light distribution down to the faint surface brightness levels of μg ∼ 28.9 mag arcsec−2, μr ∼ 27.3 mag arcsec−2, in the g and r bands, respectively. Moreover, the large field of view of OmegaCam allows us to cover the whole area observed with ATCA (∼1.5 deg2). The VEGAS image of the NGC 3100 group in the r band is shown in Fig. 1, with the contours of the H I detected in emission and in absorption against the radio emission of NGC 3100 overlaid. As discussed in Sect. 6.1, combining deep optical images with the H I density is fundamental in order to detect any faint star-light counterpart of the gas and, therefore to address the possible origin of this component.
4. Distribution and kinematics of the cold gas
The ATCA H I observations of NGC 3100 provide an unprecedented view of its gas content and environment. For the first time, H I is revealed in different galaxies of the group of NGC 3100. The main panel of Fig. 1 shows the distribution of the H I overlaid on the deep optical image of the NGC 3100 group made by VEGAS. The group of NGC 3100 has 1.18 × 10¹⁰ M⊙ of H I distributed among six satellites within 1.5 deg2 from the bright radio galaxy. In particular, we detect H I gas associated to the disk of NGC 3095, NGC 3108, ESO 435-28, EQ J100-3124, and – for the very first time – in two dwarf galaxies (DwN, DwW), and in a cloud located in the sky area between NGC 3100 and its companion, NGC 3095 (Cl). Most of the detected H I disks show morphological asymmetries. Moreover, we discover H I absorption against the radio source in NGC 3100. The main properties of the H I detections are summarised in Table 2.
H I properties of the sources detected in the NGC 3100 group.
Previous H I observations detected gas in some of the sources of the NGC 3100 group, but never associated to the AGN. In particular, NGC 3095 is detected in the H I Parkes All Sky Survey (HIPASS; Meyer et al. 2004; Zwaan et al. 2004). DwN and the cloud Cl are both within the HIPASS PSF (15.5′) and therefore formally indistinguishable from NGC 3095. ESO 435-28 was already known to have some H I detected by single-dish observations (Theureau et al. 1998). ATCA observations a factor 1.4 less sensitive than the one presented in this paper and at comparable resolutions previously observed the H I in NGC 3108 (e.g. Oosterloo et al. 2002; Hau et al. 2008; Serra et al. 2008). The same observations also discovered H I in EQ J100-3124, referring to this source as ‘anonymous galaxy’ A1000–31. Our results confirm the H I mass and systemic velocity of the latter, while we only partially recover the H I mass of NGC 3108 reported by Oosterloo et al. (2002; 4.6 × 10⁹ M⊙, at the distance of 53 Mpc). This is likely due to the fact that this galaxy is ∼30′ away from NGC 3100 at the edge of the field of view of our ATCA observations, where the sensitivity of the primary beam drops below 10%. The H I detection in DwW is likely also affected by this issue.
The H I in DwN and DwW has low column densities (∼5 × 1019 cm−2) and DwN is the galaxy with the lowest H I mass detected in emission, of namely MHI = 8 × 10⁷ M⊙. The most interesting novel discovery is the extended (4′) H I cloud (Cl) 38 kpc away from NGC 3100, between DwN and NGC 3095. Its H I is very diffuse spanning column densities between 6 × 1018 cm−2 and 3 × 1019 cm−2. The cloud is detected over three spatial beams and seven spectral channels, with an average S/N ≳ 3.5 in each channel. The VEGAS observations suggest that no stellar counterpart is associated with this cloud (further details are given in Sect. 6.1).
The H I systemic velocities of the gas-rich galaxies (shown in Table 2) are all within 300 km s−1 from NGC 3100, confirming that they all likely belong to the same group. The velocity field in Fig. 2 shows that NGC 3095 and DwN have velocities very similar to NGC 3100 (within 60 km s−1), while the diffuse cloud is blueshifted by 200 km s−1. In Sect. 6.1, we combine this information with the deep photometry to understand the formation history of this group and relate it to the gas content of its members.
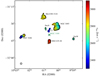 |
Fig. 2. Velocity field of the H I detected in the group of NGC 3100 (whose location is marked by a green cross, vsys = 2641 km s−1). Contour levels are as in Fig. 1. |
5. The H I in NGC 3100 detected in absorption
Figure 3 shows the H I absorption profile of NGC 3100. The complex has a main broad line peaking close to the systemic velocity (τ = 0.0119) and a second, narrower (full width at zero intensity FWZI = 73 km s−1) redshifted component (vpeak − vsys ∼ +200 km s−1). The peak of the line is close to the systemic velocity (vpeak − vsys ∼ −31 km s−1), which is indicative of an absorption line tracing a circum-nuclear disc (e.g. Geréb et al. 2015; Maccagni et al. 2017). The full-width at half maximum (w50 = 397 km s−1) is within the range of rotational velocities of NGC 3100, as traced by its circum-nuclear disk of molecular gas (Ruffa et al. 2019a). Nevertheless, the FWZI of the overall absorption complex is 570 km s−1, which is greater than the FWZI of the molecular gas detected in the centre of this AGN (≈430 km s−1; see e.g. Fig. 5 of Ruffa et al. 2022). The FWZI of the CO is similar to the full width of the broad component of the H I absorption. This suggests that only part but not all of the H I absorption is tracing the same neutral atomic phase of the circum-nuclear disk seen in the CO. Further information on the distribution of the H I traced in absorption and its relation with the molecular gas is given in Sect. 6.2.
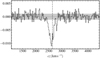 |
Fig. 3. H I absorption detected in the centre of NGC 3100 (with a PSF of 21″×19″) against the unresolved radio continuum emission of the AGN (S1.4 GHz ∼ 490 mJy). The dashed-dotted vertical line marks the systemic velocity of the source (vsys = 2641 km s−1), and the grey shaded area shows the average noise across in the datacube. |
In our 1.4 GHz observations, the radio jets and core of NGC 3100 are unresolved, assuming that the H I completely covers the background continuum emission (covering factor cf = 1), and that their spin temperature is 100 K; the integrated column density of the absorption complex is NHI = 4.43 × 1020 cm−2. The total mass of the H I traced by the absorption may be estimated as MHIπr2 · NHI, making some assumption as to the radius of the absorbing clouds (r). An upper limit on the mass is obtained assuming that the H I is covering the entire PSF of the observations (21″×19″, ≈3.8 × 3.8 kpc) and is MHI = 5.13 × 10⁷ M⊙. A lower limit on the mass is derived assuming that the absorption cannot occur beyond the extent of the radio jets as given by their emission at 10 GHz (10″, ∼1.8 kpc, Ruffa et al. 2020). This implies a total mass of the absorption complex of MHI = 1.1 × 10⁶ M⊙.
6. Discussion
6.1. The H I in the NGC 3100 group
The novel H I detections in combination with the deep VEGAS optical observations allow us to identify two new H I-rich dwarf galaxies in the group of NGC 3100, namely DwN and DwW, and to detect several asymmetries in the outskirts of the H I disks of all other sources close to NGC 3100 (i.e. NGC 3095, ESO 425-28, EQ J00-3124). Here, we investigate the H I and stellar properties of these sources in relation to the assembly history of the group. The overlay between the combined g, r colour image from the VEGAS observations and the H I distribution (Fig. 1) shows that while the detected H I disks have asymmetries in their outskirts, their stellar bodies are not significantly disturbed. This suggests that the group galaxies did not encounter a recent major merger, but that weak tidal interactions are likely ongoing.
We also detect diffuse H I emission in the outskirts of NGC 3100 for the first time (38 kpc away from the centre). The deep optical imaging shows that no stellar counterpart is present at the coordinates of the H I cloud, or in its proximity, down to the surface-brightness magnitude limit of 27.3 mag arcsec−2; see Fig. 4. Therefore, a dark H I cloud of ∼1 × 10⁸ M⊙ seems to be located approximately half-way between NGC 3100 and its companion NGC 3095. The cloud has an asymmetrical shape and could be the remnant of a past interaction between these two galaxies. Nevertheless, even though Cl seems to point towards the northern tail of NGC 3095, it is blueshifted with respect to this object and also with respect to NGC 3100, by 150 and 300 km s−1, respectively, and no further H I emission is found between the galaxies (see also Fig. 2, and Table 2).
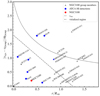 |
Fig. 4. VEGAS image of the north of NGC 3100. The deep photometric observations show the absence of a galaxy at the location of the H I cloud detected by the ATCA observations. H I contours are as in Fig. 1. |
Further information on the origin of this H I cloud and on the possible assembly history of the NGC 3100 group can be obtained from their location in the phase-space diagram (e.g. Jaffé et al. 2015; Rhee et al. 2017). This diagram relates the projected distance from the centre of the group (normalised by the virial radius of the group) with the systemic velocity of each galaxy with respect to the group centre (normalised by its velocity dispersion). Figure 5 shows the projected phase-space diagram of the NGC 3100 group. In addition to the H I detections, we show the group members identified in the ‘galaxy groups within 3500 km s−1 catalogue by Kourkchi & Tully (2017), together with the virialised area of the group and the caustic curves defined by its escape velocity (which depends on its virial mass, radius, and velocity dispersion, i.e. Mvir = 6.6 × 10¹³ M⊙, Rvir = 0.53 Mpc, σgroup = 211 km s−1, respectively). We highlight that in the Kourkchi & Tully (2017) catalogue, the centre of the group is not on NGC 3100 but is shifted towards the north (RA = 10:00:40.800, Dec = −31:39:52.30, vrad = 2600 km s−1). Moreover, the ATCA observations detect H I in all group members visible in the field of view (marked by circles in the figure) except for in IC 2533 towards the north.
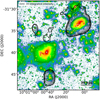 |
Fig. 5. Phase-space diagram of the NGC 3100 group. NGC 3100 is shown in red, while H I detections are shown in blue, and non-detections in grey. Triangles indicate group members from the Kourkchi & Tully (2017) catalogue that are located outside the field of view of ATCA. The dotted line shows the caustic curve defined by the escape velocity of the group. Interestingly, most H I detections are located within the virialised region of the group (dashed-dotted line). The proximity of NGC 3095 and DwN suggests a recent interaction with NGC 3100. |
Different simulations (Jaffé et al. 2015; Smith et al. 2015; Rhee et al. 2017) show that, in the virialised region, we are more likely to find old members of the group – between which interactions have already occurred – than recent infallers, which are typically located between this region and the caustic lines. This has been observed in denser environments than the NGC 3100 group, such as the Fornax cluster (Loni et al. 2021) and Virgo (Jaffé et al. 2016). Interestingly, in the loose group of NGC 3100, most H I detections are found in the virialised region, while in clusters and dense groups the H I is typically located in the region of the recent infallers (Jaffé et al. 2015; Loni et al. 2021). The diagram also suggests that it is not only NGC 3095 that may have interacted with NGC 3100, but also DwN, because it lies very close to NGC 3100 in the projected phase-space diagram and has an H I tail pointing towards it (see Fig. 1). In summary, the analysis of the locations and motions of the H I detections within the NGC 3100 group supports a scenario in which different galaxies recently interacted with NGC 3100, and the dark H I cloud is possibly the remnant of one of these interactions, and survived in the intergalactic medium.
As recent minor interactions likely influenced the assembly history of the centre of the NGC 3100 group, we may ask ourselves whether these interactions have already removed an important amount of H I from its members. One way to answer this question is to compare their H I content with those of galaxies that live in poorer environments where sources likely do not experience any significant event of gas removal, such as mergers and ram pressure stripping; and those of galaxies that live in denser environments (e.g. clusters, where instead members likely experience several gas-removal events). Following Loni et al. (2021) and Molnár et al. (2022), for the comparison with galaxies in poorer environments, we selected all the field sources in the Local Universe with H I and stellar contents measured in the Herschel Reference Survey (excluding the Virgo cluster members) and Void Galaxy Survey (Boselli et al. 2014; Kreckel et al. 2012, respectively). For galaxies in denser environments, we use the sources detected in the Virgo cluster (Cortese et al. 2016). The left panel of Fig. 6 shows a comparison between the H I mass fraction (defined as the ratio between the H I mass and the stellar mass) versus stellar mass for the H I detections in the NGC 3100 group (see Table 3) and the galaxies of the comparison sample. The dotted line shows the GALEX Arecibo SDSS Survey (xGASS; Catinella et al. 2018) scaling relation, that is, the median value of the H I content for galaxies in the Local Group. We extrapolated the xGASS trend down to 107 M⊙ (black dashed line), which is consistent with the H I mass fraction of HRS+VGS galaxies. Given that for the dark cloud Cl there is no corresponding stellar counterpart (and therefore we cannot estimate a stellar mass), we do not plot this source in Fig. 6.
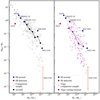 |
Fig. 6. H I vs. stellar mass content of the sources in the NGC 3100 group and of galaxies in different comparison samples. Left panel: H I fraction vs. the stellar mass of the galaxies in the NGC 3100 group (red + blue markers) compared with non-cluster galaxies from VSG+HRS (grey circles, Kreckel et al. 2012; Boselli et al. 2014). Red and blue colours show H I-deficient and normal galaxies, respectively. We show the xGASS scaling relation with a black solid line (Catinella et al. 2018). The black dashed line is the linear extrapolation of this trend for M⋆ < 1.4 × 10⁹ M⊙. Right panel: Similar to the left panel. Here we show the comparison between the H I mass fraction of the galaxies in the NGC 3100 group with that of Virgo cluster galaxies from HRS (light purple circles). Dark purple circles show the average scaling relation obtained from Virgo cluster galaxies (Cortese et al. 2016). |
Optical properties of the H I detections in the NGC 3100 group.
The galaxies of the NGC 3100 group do not show any significant offset with respect to those of the comparison samples in the plane of the H I mass fraction versus stellar mass. Overall, it appears that members of this group host an amount of H I consistent with that of galaxies that do not live in dense environments. To quantify any possible case of H I deficiency, we also evaluated the deviation from the xGASS scaling relations for both our H I sources and the galaxies in the comparison sample. We consider as H I deficient all sources of the NGC 3100 group whose offset from the scaling relations is larger than 1σ with respect to the standard deviation of the VGS+HRS sample. These galaxies are shown in red in Fig. 6. One of the two sources is NGC 3100, which is 2–3 orders of magnitude offset from the scaling relation. However, as illustrated in Sect. 5, H I is detected in absorption in this galaxy, which limits an accurate estimate of the total gas mass (which may range between 106 and 107 M⊙). Nevertheless, if more H I is present within the stellar body of NGC 3100, it must have very low column densities given that it is not detected in emission (NHI ≲ 1019 cm−2), and would therefore likely not contribute significantly to the total H I mass. Moreover, NGC 3100 is the most massive ETG of its group, and its H I content (even if a lower limit) is consistent with what is expected in massive elliptical galaxies in groups, where often little H I (if any) is detected (Odekon et al. 2016).
The other group member found to be H I deficient is DwN. This further supports (along with the disturbed H I morphology and the indications of the phase-space diagram; see Sect. 4) a scenario in which this source may have undergone a minor interaction with NGC 3100. The other H I-detected dwarf galaxy, DwW, is not deficient in H I and has a regular H I morphology, further indicating that this source has not yet entered the virialised region of the group.
The right panel of Fig. 6 shows the H I content in the NGC 3100 group and the galaxies of the Virgo cluster. The purple dotted line shows the H I mass fraction scaling relation obtained for Virgo galaxies (Cortese et al. 2016). Besides our H I deficient galaxies, all group members are above the Virgo scaling relation. Although a direct comparison with DwN is hard due to the lack of Virgo galaxies below ∼109 M⊙, DwN might have reached a level of H I deficiency similar to that of Virgo galaxies. The interaction history of this dwarf satellite may therefore be similar to that of galaxies found in much denser environments.
In summary, the analysis of the location and H I morphologies of the sources we detect in the NGC 3100 group suggests that minor interactions affect the H I disks of most of them. In particular, it is likely that NGC 3095 and DwN recently interacted with the NGC 3100, such that part of their gas has been stripped out, leaving clear H I tails in the outskirts of their disks. The origin of the dark cloud remains puzzling. On the one hand, the cloud is located in the field between NGC 3100 and NGC 3095, but its velocities are blueshifted with respect to both. On the other hand, DwN is likely H I depleted and the cloud is also closer to it in projection than to NGC 3095. Despite the controversial origin of the dark cloud, the H I content and distribution of the NGC 3100 group indicate that several sources close to NGC 3100 are rich in cold gas and that minor interactions with it may have contributed to replenishing this ETG of cold atomic (and molecular) gas. During the interactions, the dark cloud may have acquired a sufficient velocity offset (∼200 km s−1) to survive into the IGM and not be re-accreted (recently) onto the sources.
6.2. The H I disk of NGC 3100
From the H I absorption complex of NGC 3100 and the morphology of its radio source, it is possible to infer the overall distribution of the H I in this AGN. As mentioned in Sect. 5, an absorption line peaking close to the systemic velocity such as that detected in NGC 3100 likely traces a rotating disc. The H I detected in absorption may therefore be the part against the radio continuum of a diffuse disk extending throughout the entire stellar body of the galaxy, as seen in several nearby ETGs (Serra et al. 2012; Maccagni et al. 2017). Alternatively, the H I gas could be concentrated in the innermost regions of NGC 3100 and form a circum-nuclear disc. This is often observed in radio AGN embedded in an S0 galaxy (see e.g. PKS 1718-649, Fornax A, Centaurus A, Maccagni et al. 2014, 2021; Struve et al. 2010; Morganti 2010). Such circum-nuclear disks are typically multi-phase, with the neutral gas showing kinematics similar to that of the molecular phase (e.g. Maccagni et al. 2016, 2018; McCoy et al. 2017; Espada et al. 2017). As anticipated in Sect. 2, a circum-nuclear molecular gas disk has already been detected in NGC 3100 (Ruffa et al. 2019b,a, 2022; see also the right panel of Fig. 1). It is therefore plausible that the neutral and molecular gas phases also co-exist in the circum-nuclear regions of NGC 3100. As a proof of concept, we investigated whether or not part of the H I absorption complex traces the circum-nuclear molecular disc, and if so, which part. To this aim, we built a toy model of an H I disk with the same extent, thickness, and velocity curve as the CO disc (PA = 220°, i = 60°, vrot = 345 km s−1; see the bottom right panel of Fig. 4 in Ruffa et al. 2022). With a procedure illustrated in detail in Maccagni (2017)2, we overlaid the mock H I disk on the high-resolution continuum image of NGC 3100 to determine the appearance of an absorption line complex produced by such a disc. As the radio continuum is unresolved by the ATCA observations, we assume that at 1.4 GHz it has the same morphology and flux distribution as at 5 GHz, where we resolve the radio jets (see right panel of Fig. 1). This enables us to understand whether or not the kinematics of a disk with the same properties as the CO disk would reproduce the kinematics of the H I detected in absorption, that is, the shape and width of the line. For this reason, we also normalised the peak of the modelled absorption line to the observed one and avoid making assumptions as to the surface brightness distribution of the H I disc. The results are shown in Fig. 7. The bulk of the H I absorption feature is clearly well reproduced by the modelled disc, where part of it intercepts along the line of sight the core and the radio jet. Given that the radio core is approximately five times brighter than the jets, the part of the disk in front likely contributes most of the absorption. This indicates that the H I absorption likely traces the same circum-nuclear disk seen in emission in the molecular phase rather than a component at outer distances or a disk with different orientation. In this configuration, about one-sixth of the disk is traced by the absorption line. Assuming a uniform distribution, the total H I mass of the circum-nuclear disk is therefore 1.1 × 10⁷ M⊙. This value is compatible with the upper limit estimated in Sect. 5.
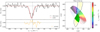 |
Fig. 7. Kinematical model of a circum-nuclear disk reproducing the observed H I absorption line. Left panel: Best-fit H I absorption generated by a disk in front of the radio continuum, overlaid with the observed line. Residuals are shown in the bottom panel. Right panel: Orientation of the H I disk generating the line in the left panel in the plane of the sky. The absorbed part of the disk is against the core and the southern jet is shown in green. The radio continuum is shown in the background. The colour scale shows the rotation velocity of the disk relative to systemic. The inclination and position angle of the disk best reproducing the observed H I are the same as those of the CO disk resolved by ALMA (see e.g. the zoomed-in image panel of Fig. 1 or Fig. 7 of Ruffa et al. 2019b). |
Given that the total molecular gas mass is likely in the range 0.5 − 3.5 × 10⁸ M⊙ (Ruffa et al. 2022), the H 2/H I ratio in NGC 3100 is ∼1 − 10. This value is similar to what was found in other nearby LERGs with a dust lane in the centre, such as NGC 1316 (also known as Fornax A, see e.g. Morokuma-Matsui et al. 2019; Maccagni et al. 2021), and suggests that the bulk of the mass of the circum-nuclear disk is cold and is likely being converted from atomic to molecular. Moreover, as the dust formation and conversion from atomic to molecular gas are enhanced in interacting galaxies (e.g. Sanders & Mirabel 1996; Nakanishi et al. 2006; Kaneko et al. 2017), it is possible that the small interactions and consequent infall of cold gas is enhancing the conversion to molecular gas.
The nature of the redshifted component of the H I absorption remains puzzling. The modelled circum-nuclear disk shown in Fig. 7 does not reproduce its velocities. The molecular disk shows several clouds with small (within the rotational velocity of the galaxy) deviations from regular rotation, some of which are outflowing while others may be fuelling the AGN (see Ruffa et al. 2022). It is possible that the redshifted H I feature traces the neutral phase of some of these clouds. Given its location in front of the radio source and its redshifted velocities, this feature may trace H I clouds that are directed towards the central SMBH and therefore contributing to its fuelling. Another possibility is that the redshifted feature is tracing H I clouds currently falling onto the disk as a consequence of the recent minor interactions between NGC 3100 and its satellites. Observations of higher sensitivity and resolution are required to discriminate between the two possibilities. Such observations would also enable us to connect the H I detected in absorption with that detected in emission in the outskirts of our target, allowing us to fully determine its origin and role in powering the nuclear activity of this galaxy.
7. Summary and future prospects
Deep ATCA 1.4 GHz observations of the NGC 3100 loose group show, for the first time, that several satellites of NGC 3100 have significant amounts of neutral hydrogen. Most H I disks have asymmetric morphologies, with low-column-density tails in their outskirts (Sect. 4 and Fig. 1). This, along with the projected location of the group members (Sect. 6.1 and Fig. 5), suggests that recent minor interactions occurred between NGC 3100 and its two closest satellites (NGC 3095 and DwN), likely channelling relatively large amounts of cold gas and dust in its centre. These interactions must have been weak so as not to significantly deplete the satellites of gas but only unsettle the outer regions of their H I disks, as suggested by the H I-to-stellar mass ratio of their group members (Fig. 6). This scenario is also supported by the deep optical photometry of the group presented in this paper (and acquired as part of the VEGAS project), which shows that the stellar bodies of these galaxies are not disturbed and tidal stellar streams are not detected (Fig. 4).
We detect a diffuse dark cloud between NGC 3100 and its companion, NGC 3095. The combination of the ATCA and VEGAS observations allows us to determine that the cloud does not have a stellar counterpart (see Fig. 4). This cloud could be the remnant of an interaction between NGC 3095 or DwN, and NGC 3100. The dark cloud could also form an H I reservoir in the outskirts of NGC 3100 that may replenish its central regions of cold gas. Deeper and higher resolution observations are needed to further investigate our hypotheses. The H I absorption complex detected for the very first time in NGC 3100 indicates that the circum-nuclear ISM of this LERG has both a molecular (e.g. Ruffa et al. 2019a) and a neutral component (Sect. 5). In particular, most of the H I seems to be distributed in the same circum-nuclear disk as the molecular gas (Sect. 6.2). The redshifted component of the H I absorption line may trace H I clouds that are deviating from the regular kinematics of the disc. These could be the neutral counterpart of the molecular gas clouds that may be fuelling the nuclear activity (Ruffa et al. 2022). Nevertheless, the nature of this component remains puzzling and how the nuclear activity is being sustained remains unclear.
The ATCA observations of the NGC 3100 group combined with the new deep optical images from VEGAS presented in this paper allow us to determine that the cold gas at the centre of NGC 3100 likely originates from minor interactions with its satellites. Clarifying how the gas is then funnelled onto the circum-nuclear regions and the exact mechanism powering the AGN requires deeper and higher-resolution H I observations. These would enable us to connect the H I detected in emission in the outskirts of NGC 3100 with that detected in absorption in its centre. A major step forward in the study of nearby AGN has now been made thanks to the novel radio interferometer MeerKAT (Camilo et al. 2018; Mauch et al. 2020). This telescope has a unique combination of long baselines enabling high-resolution observations (∼10″) over a large field of view (∼1.5 deg2). Moreover, the dense core of MeerKAT, along with its 64 antennas, enables high-resolution observations of the diffuse H I (NHI ∼ 1019 cm−2), which is typically found in the circum-nuclear regions of AGN (as in NGC 3100). For example, MeerKAT L-band observations revealed for the very first time a massive (2 × 10⁸ M⊙) low-column-density (NHI ∼ 1019 cm−2) reservoir of H I in the centre and several filaments in the outskirts of the nearby LERG Fornax A (NGC 1316; Serra et al. 2019; Kleiner et al. 2021). By combining the H I information with the molecular and ionised gas observed in the same central regions of this radio galaxy, Maccagni et al. (2020, 2021) revealed the co-existence of AGN feeding and feedback mechanisms involving the multi-phase circum-nuclear ISM and determined how chaotic cold accretion may sustain the rapid flickering of the AGN.
Up-coming MeerKAT observations of NGC 3100 will allow us to further investigate the H I in its group and the nature of its absorption complex. Similarly to Fornax A, we will be able to combine the H I and CO observations, and put more solid constraints on the feeding mechanism of this LERG and the effects of the expansion of its radio jets. Thanks to the sensitivity (∼3 × 1018 cm−2) and high resolution (≲20″, Δv ∼ 1.4 km s−1) of MeerKAT, we will likely connect the H I in the centre of NGC 3100 with that in the outskirts and in the group, and fully determine the origin of the dark cloud.
Throughout this work, we assume a standard ΛCDM cosmology with H0 = 70 km s−1 Mpc−1, ΩΛ = 0.7 and ΩM = 0.3. This gives a scale of 182 pc/″, at the redshift of NGC 3100 (z = 0.008; Ruffa et al. 2019a).
Using the open-source software https://github.com/Fil8/MoDAbS
Acknowledgments
The authors thank the anonymous referee for the useful comments and suggestions. This project has received funding from the European Research Council (ERC) under the European Union’s Horizon 2020 research and innovation programme (grant agreement no. 679627 and grant agreement no. 882793). I.P. acknowledges support from the INAF SKA/CTA PRIN “FORECaST” project and from the PRIN MIUR project “Black Hole winds and the Baryon Life Cycle of Galaxies: the stone-guest at the galaxy evolution supper”, contract 2017PH3WAT. The Australia Telescope Compact Array is part of the Australia Telescope which is funded by the Commonwealth of Australia for operation as a National Facility managed by CSIRO.
References
- Babyk, I. V., McNamara, B. R., Tamhane, P. D., et al. 2019, ApJ, 887, 149 [NASA ADS] [CrossRef] [Google Scholar]
- Best, P. N., & Heckman, T. M. 2012, MNRAS, 421, 1569 [NASA ADS] [CrossRef] [Google Scholar]
- Boselli, A., Cortese, L., & Boquien, M. 2014, A&A, 564, A65 [NASA ADS] [CrossRef] [EDP Sciences] [Google Scholar]
- Camilo, F., Scholz, P., Serylak, M., et al. 2018, ApJ, 856, 180 [Google Scholar]
- Capaccioli, M., Spavone, M., Grado, A., et al. 2015, A&A, 581, A10 [NASA ADS] [CrossRef] [EDP Sciences] [Google Scholar]
- Catinella, B., Saintonge, A., Janowiecki, S., et al. 2018, MNRAS, 476, 875 [NASA ADS] [CrossRef] [Google Scholar]
- Ching, J. H. Y., Croom, S. M., Sadler, E. M., et al. 2017, MNRAS, 469, 4584 [NASA ADS] [CrossRef] [Google Scholar]
- Choi, E., Ostriker, J. P., Naab, T., Oser, L., & Moster, B. P. 2015, MNRAS, 449, 4105 [CrossRef] [Google Scholar]
- Cortese, L., Bekki, K., Boselli, A., et al. 2016, MNRAS, 459, 3574 [Google Scholar]
- Curran, S. J., & Duchesne, S. W. 2018, MNRAS, 476, 3580 [NASA ADS] [CrossRef] [Google Scholar]
- Davis, T. A., Greene, J. E., Ma, C.-P., et al. 2019, MNRAS, 486, 1404 [NASA ADS] [CrossRef] [Google Scholar]
- D’Onofrio, M., Marziani, P., & Chiosi, C. 2021, Front. Astron. Space Sci., 8, 157 [Google Scholar]
- Ekers, R. D., Wall, J. V., Shaver, P. A., et al. 1989, MNRAS, 236, 737 [NASA ADS] [Google Scholar]
- Emonts, B. H. C., Morganti, R., Oosterloo, T. A., et al. 2008, MNRAS, 387, 197 [CrossRef] [Google Scholar]
- Espada, D., Matsushita, S., Miura, R. E., et al. 2017, ApJ, 843, 136 [NASA ADS] [CrossRef] [Google Scholar]
- Gaspari, M., Brighenti, F., & Temi, P. 2015, A&A, 579, A62 [NASA ADS] [CrossRef] [EDP Sciences] [Google Scholar]
- Gaspari, M., Temi, P., & Brighenti, F. 2017, MNRAS, 466, 677 [Google Scholar]
- Geréb, K., Maccagni, F. M., Morganti, R., & Oosterloo, T. A. 2015, A&A, 575, A44 [CrossRef] [EDP Sciences] [Google Scholar]
- Hardcastle, M. 2018, Nat. Astron., 2, 273 [NASA ADS] [CrossRef] [Google Scholar]
- Hardcastle, M. J., Evans, D. A., & Croston, J. H. 2007, MNRAS, 376, 1849 [NASA ADS] [CrossRef] [Google Scholar]
- Harrison, C. M., Costa, T., Tadhunter, C. N., et al. 2018, Nat. Astron., 2, 198 [Google Scholar]
- Hau, G. K. T., Bower, R. G., Kilborn, V., et al. 2008, MNRAS, 385, 1965 [NASA ADS] [CrossRef] [Google Scholar]
- Ineson, J., Croston, J. H., Hardcastle, M. J., et al. 2015, MNRAS, 453, 2682 [Google Scholar]
- Iodice, E., Spavone, M., Raj, M. A., et al. 2021, ArXiv e-prints [arXiv:2102.04950] [Google Scholar]
- Jaffé, Y. L., Smith, R., Candlish, G. N., et al. 2015, MNRAS, 448, 1715 [Google Scholar]
- Jaffé, Y. L., Verheijen, M. A. W., Haines, C. P., et al. 2016, MNRAS, 461, 1202 [Google Scholar]
- Kaneko, H., Kuno, N., Iono, D., et al. 2017, PASJ, 69, 66 [NASA ADS] [CrossRef] [Google Scholar]
- Kleiner, D., Serra, P., Maccagni, F. M., et al. 2021, A&A, 648, A32 [NASA ADS] [CrossRef] [EDP Sciences] [Google Scholar]
- Kourkchi, E., & Tully, R. B. 2017, ApJ, 843, 16 [NASA ADS] [CrossRef] [Google Scholar]
- Kreckel, K., Platen, E., Aragón-Calvo, M. A., et al. 2012, AJ, 144, 16 [Google Scholar]
- Kuijken, K. 2011, The Messenger, 146, 8 [NASA ADS] [Google Scholar]
- Laurikainen, E., Salo, H., Buta, R., et al. 2006, AJ, 132, 2634 [NASA ADS] [CrossRef] [Google Scholar]
- Loni, A., Serra, P., Kleiner, D., et al. 2021, A&A, 648, A31 [NASA ADS] [CrossRef] [EDP Sciences] [Google Scholar]
- Maccagni, F. M. 2017, Ph.D. Thesis, University of Groningen, The Netherlands [Google Scholar]
- Maccagni, F. M., Morganti, R., Oosterloo, T. A., & Mahony, E. K. 2014, A&A, 571, A67 [NASA ADS] [CrossRef] [EDP Sciences] [Google Scholar]
- Maccagni, F. M., Santoro, F., Morganti, R., et al. 2016, A&A, 588, A46 [NASA ADS] [CrossRef] [EDP Sciences] [Google Scholar]
- Maccagni, F. M., Morganti, R., Oosterloo, T. A., Geréb, K., & Maddox, N. 2017, A&A, 604, A43 [NASA ADS] [CrossRef] [EDP Sciences] [Google Scholar]
- Maccagni, F. M., Morganti, R., Oosterloo, T. A., Oonk, J. B. R., & Emonts, B. H. C. 2018, A&A, 614, A42 [NASA ADS] [CrossRef] [EDP Sciences] [Google Scholar]
- Maccagni, F. M., Murgia, M., Serra, P., et al. 2020, A&A, 634, A9 [NASA ADS] [CrossRef] [EDP Sciences] [Google Scholar]
- Maccagni, F. M., Serra, P., Gaspari, M., et al. 2021, A&A, 656, A45 [NASA ADS] [CrossRef] [EDP Sciences] [Google Scholar]
- Mauch, T., Cotton, W. D., Condon, J. J., et al. 2020, ApJ, 888, 61 [Google Scholar]
- McCoy, M., Ott, J., Meier, D. S., et al. 2017, ApJ, 851, 76 [NASA ADS] [CrossRef] [Google Scholar]
- McFarland, J. P., Verdoes-Kleijn, G., Sikkema, G., et al. 2013, Exp. Astron., 35, 45 [Google Scholar]
- Meyer, M. J., Zwaan, M. A., Webster, R. L., et al. 2004, MNRAS, 350, 1195 [Google Scholar]
- Meyer, M., Robotham, A., Obreschkow, D., et al. 2017, PASA, 34, 52 [Google Scholar]
- Miraghaei, H., & Best, P. N. 2017, MNRAS, 466, 4346 [NASA ADS] [Google Scholar]
- Molnár, D. C., Serra, P., van der Hulst, T., et al. 2022, A&A, 659, A94 [NASA ADS] [CrossRef] [EDP Sciences] [Google Scholar]
- Morganti, R. 2010, PASA, 27, 463 [NASA ADS] [CrossRef] [Google Scholar]
- Morganti, R., & Oosterloo, T. 2018, A&ARv, 26, 4 [Google Scholar]
- Morganti, R., Oosterloo, T. A., Tadhunter, C. N., et al. 2001, MNRAS, 323, 331 [NASA ADS] [CrossRef] [Google Scholar]
- Morokuma-Matsui, K., Serra, P., Maccagni, F. M., et al. 2019, PASJ, 71, 85 [NASA ADS] [CrossRef] [Google Scholar]
- Nagai, H., Onishi, K., Kawakatu, N., et al. 2019, ApJ, 883, 193 [NASA ADS] [CrossRef] [Google Scholar]
- Nakanishi, H., Kuno, N., Sofue, Y., et al. 2006, ApJ, 651, 804 [NASA ADS] [CrossRef] [Google Scholar]
- Negri, A., Posacki, S., Pellegrini, S., & Ciotti, L. 2014, MNRAS, 445, 1351 [CrossRef] [Google Scholar]
- Ocaña Flaquer, B., Leon, S., Combes, F., & Lim, J. 2010, A&A, 518, A9 [Google Scholar]
- O’Dea, C. P., & Saikia, D. J. 2021, A&ARv, 29, 3 [Google Scholar]
- Odekon, M. C., Koopmann, R. A., Haynes, M. P., et al. 2016, ApJ, 824, 110 [NASA ADS] [Google Scholar]
- Oosterloo, T. A., Morganti, R., Sadler, E. M., Vergani, D., & Caldwell, N. 2002, AJ, 123, 729 [NASA ADS] [CrossRef] [Google Scholar]
- Oosterloo, T., Morganti, R., Crocker, A., et al. 2010, MNRAS, 409, 500 [NASA ADS] [CrossRef] [Google Scholar]
- Poggianti, B. M., Jaffé, Y. L., Moretti, A., et al. 2017, Nature, 548, 304 [Google Scholar]
- Prandoni, I., Laing, R. A., de Ruiter, H. R., & Parma, P. 2010, A&A, 523, A38 [NASA ADS] [CrossRef] [EDP Sciences] [Google Scholar]
- Pulido, F. A., McNamara, B. R., Edge, A. C., et al. 2018, ApJ, 853, 177 [NASA ADS] [CrossRef] [Google Scholar]
- Ragusa, R., Iodice, E., Spavone, M., et al. 2023, A&A, 670, L20 [NASA ADS] [CrossRef] [EDP Sciences] [Google Scholar]
- Ramos Almeida, C., Bessiere, P. S., Tadhunter, C. N., et al. 2012, MNRAS, 419, 687 [NASA ADS] [CrossRef] [Google Scholar]
- Rhee, J., Smith, R., Choi, H., et al. 2017, ApJ, 843, 128 [Google Scholar]
- Ruffa, I., Davis, T. A., Prandoni, I., et al. 2019a, MNRAS, 489, 3739 [NASA ADS] [CrossRef] [Google Scholar]
- Ruffa, I., Prandoni, I., Laing, R. A., et al. 2019b, MNRAS, 484, 4239 [NASA ADS] [CrossRef] [Google Scholar]
- Ruffa, I., Laing, R. A., Prandoni, I., et al. 2020, MNRAS, 499, 5719 [NASA ADS] [CrossRef] [Google Scholar]
- Ruffa, I., Prandoni, I., Davis, T. A., et al. 2022, MNRAS, 510, 4485 [NASA ADS] [CrossRef] [Google Scholar]
- Sabater, J., Best, P. N., & Heckman, T. M. 2015, MNRAS, 447, 110 [NASA ADS] [CrossRef] [Google Scholar]
- Sanders, D. B., & Mirabel, I. F. 1996, ARA&A, 34, 749 [Google Scholar]
- Sault, R. J., Teuben, P. J., & Wright, M. C. H. 1995, ASP Conf. Ser., 77, 433 [NASA ADS] [Google Scholar]
- Sault, R. J., Teuben, P., & Wright, M. C. H. 2011, Astrophysics Source Code Library [record ascl:1106.007] [Google Scholar]
- Serra, P., Trager, S. C., Oosterloo, T. A., & Morganti, R. 2008, A&A, 483, 57 [NASA ADS] [CrossRef] [EDP Sciences] [Google Scholar]
- Serra, P., Oosterloo, T., Morganti, R., et al. 2012, MNRAS, 422, 1835 [Google Scholar]
- Serra, P., Westmeier, T., Giese, N., et al. 2015, MNRAS, 448, 1922 [Google Scholar]
- Serra, P., Maccagni, F. M., Kleiner, D., et al. 2019, A&A, 628, A122 [NASA ADS] [CrossRef] [EDP Sciences] [Google Scholar]
- Smith, R., Sánchez-Janssen, R., Beasley, M. A., et al. 2015, MNRAS, 454, 2502 [Google Scholar]
- Struve, C., Oosterloo, T. A., Morganti, R., & Saripalli, L. 2010, A&A, 515, A67 [NASA ADS] [CrossRef] [EDP Sciences] [Google Scholar]
- Tamhane, P. D., McNamara, B. R., Russell, H. R., et al. 2022, MNRAS, 516, 861 [NASA ADS] [CrossRef] [Google Scholar]
- Temi, P., Gaspari, M., Brighenti, F., et al. 2022, ApJ, 928, 150 [NASA ADS] [CrossRef] [Google Scholar]
- Theureau, G., Bottinelli, L., Coudreau-Durand, N., et al. 1998, A&AS, 130, 333 [NASA ADS] [CrossRef] [EDP Sciences] [Google Scholar]
- Thomas, N., Davé, R., Jarvis, M. J., & Anglés-Alcázar, D. 2021, MNRAS, 503, 3492 [NASA ADS] [CrossRef] [Google Scholar]
- Tremblay, G. R., Combes, F., Oonk, J. B. R., et al. 2018, ApJ, 865, 13 [NASA ADS] [CrossRef] [Google Scholar]
- Venhola, A., Peletier, R., Laurikainen, E., et al. 2017, A&A, 608, A142 [NASA ADS] [CrossRef] [EDP Sciences] [Google Scholar]
- Venhola, A., Peletier, R., Laurikainen, E., et al. 2018, A&A, 620, A165 [NASA ADS] [CrossRef] [EDP Sciences] [Google Scholar]
- Zwaan, M. A., Meyer, M. J., Webster, R. L., et al. 2004, MNRAS, 350, 1210 [NASA ADS] [CrossRef] [Google Scholar]
All Tables
All Figures
|
Fig. 1. Multi-wavelength view of the group of NGC 3100 and of its circum-nuclear regions. Left panel: Primary beam-corrected H I contours overlaid on a r-band image from VEGAS of the NGC 3100 group. The contour levels are 5σ × 2n Jy km s−1. The lowest contour corresponds to 1.1 × 1019 cm−2. Right panel: VEGAS r-band map zoomed onto the inner 15″ × 15″ (≈2.5 × 2.5 kpc2). The colour scale is inverted compared to the left panel. ALMA CO(2–1) integrated intensity contours from Ruffa et al. (2019b), and radio continuum contours from JVLA data at 10 GHz (Ruffa et al. 2020) are overlaid in blue and red contours, respectively. Contours are drawn at 1, 3, 9, etc. times the 3σ rms noise level. The H I (left panel), CO, and radio continuum (right panel) Gaussian restoring beams are shown in the bottom-left corners. A scale bar is shown in the bottom-right corner of each panel. |
| In the text | |
|
Fig. 2. Velocity field of the H I detected in the group of NGC 3100 (whose location is marked by a green cross, vsys = 2641 km s−1). Contour levels are as in Fig. 1. |
| In the text | |
|
Fig. 3. H I absorption detected in the centre of NGC 3100 (with a PSF of 21″×19″) against the unresolved radio continuum emission of the AGN (S1.4 GHz ∼ 490 mJy). The dashed-dotted vertical line marks the systemic velocity of the source (vsys = 2641 km s−1), and the grey shaded area shows the average noise across in the datacube. |
| In the text | |
|
Fig. 4. VEGAS image of the north of NGC 3100. The deep photometric observations show the absence of a galaxy at the location of the H I cloud detected by the ATCA observations. H I contours are as in Fig. 1. |
| In the text | |
|
Fig. 5. Phase-space diagram of the NGC 3100 group. NGC 3100 is shown in red, while H I detections are shown in blue, and non-detections in grey. Triangles indicate group members from the Kourkchi & Tully (2017) catalogue that are located outside the field of view of ATCA. The dotted line shows the caustic curve defined by the escape velocity of the group. Interestingly, most H I detections are located within the virialised region of the group (dashed-dotted line). The proximity of NGC 3095 and DwN suggests a recent interaction with NGC 3100. |
| In the text | |
|
Fig. 6. H I vs. stellar mass content of the sources in the NGC 3100 group and of galaxies in different comparison samples. Left panel: H I fraction vs. the stellar mass of the galaxies in the NGC 3100 group (red + blue markers) compared with non-cluster galaxies from VSG+HRS (grey circles, Kreckel et al. 2012; Boselli et al. 2014). Red and blue colours show H I-deficient and normal galaxies, respectively. We show the xGASS scaling relation with a black solid line (Catinella et al. 2018). The black dashed line is the linear extrapolation of this trend for M⋆ < 1.4 × 10⁹ M⊙. Right panel: Similar to the left panel. Here we show the comparison between the H I mass fraction of the galaxies in the NGC 3100 group with that of Virgo cluster galaxies from HRS (light purple circles). Dark purple circles show the average scaling relation obtained from Virgo cluster galaxies (Cortese et al. 2016). |
| In the text | |
|
Fig. 7. Kinematical model of a circum-nuclear disk reproducing the observed H I absorption line. Left panel: Best-fit H I absorption generated by a disk in front of the radio continuum, overlaid with the observed line. Residuals are shown in the bottom panel. Right panel: Orientation of the H I disk generating the line in the left panel in the plane of the sky. The absorbed part of the disk is against the core and the southern jet is shown in green. The radio continuum is shown in the background. The colour scale shows the rotation velocity of the disk relative to systemic. The inclination and position angle of the disk best reproducing the observed H I are the same as those of the CO disk resolved by ALMA (see e.g. the zoomed-in image panel of Fig. 1 or Fig. 7 of Ruffa et al. 2019b). |
| In the text | |
Current usage metrics show cumulative count of Article Views (full-text article views including HTML views, PDF and ePub downloads, according to the available data) and Abstracts Views on Vision4Press platform.
Data correspond to usage on the plateform after 2015. The current usage metrics is available 48-96 hours after online publication and is updated daily on week days.
Initial download of the metrics may take a while.