Fig. 5.

Download original image
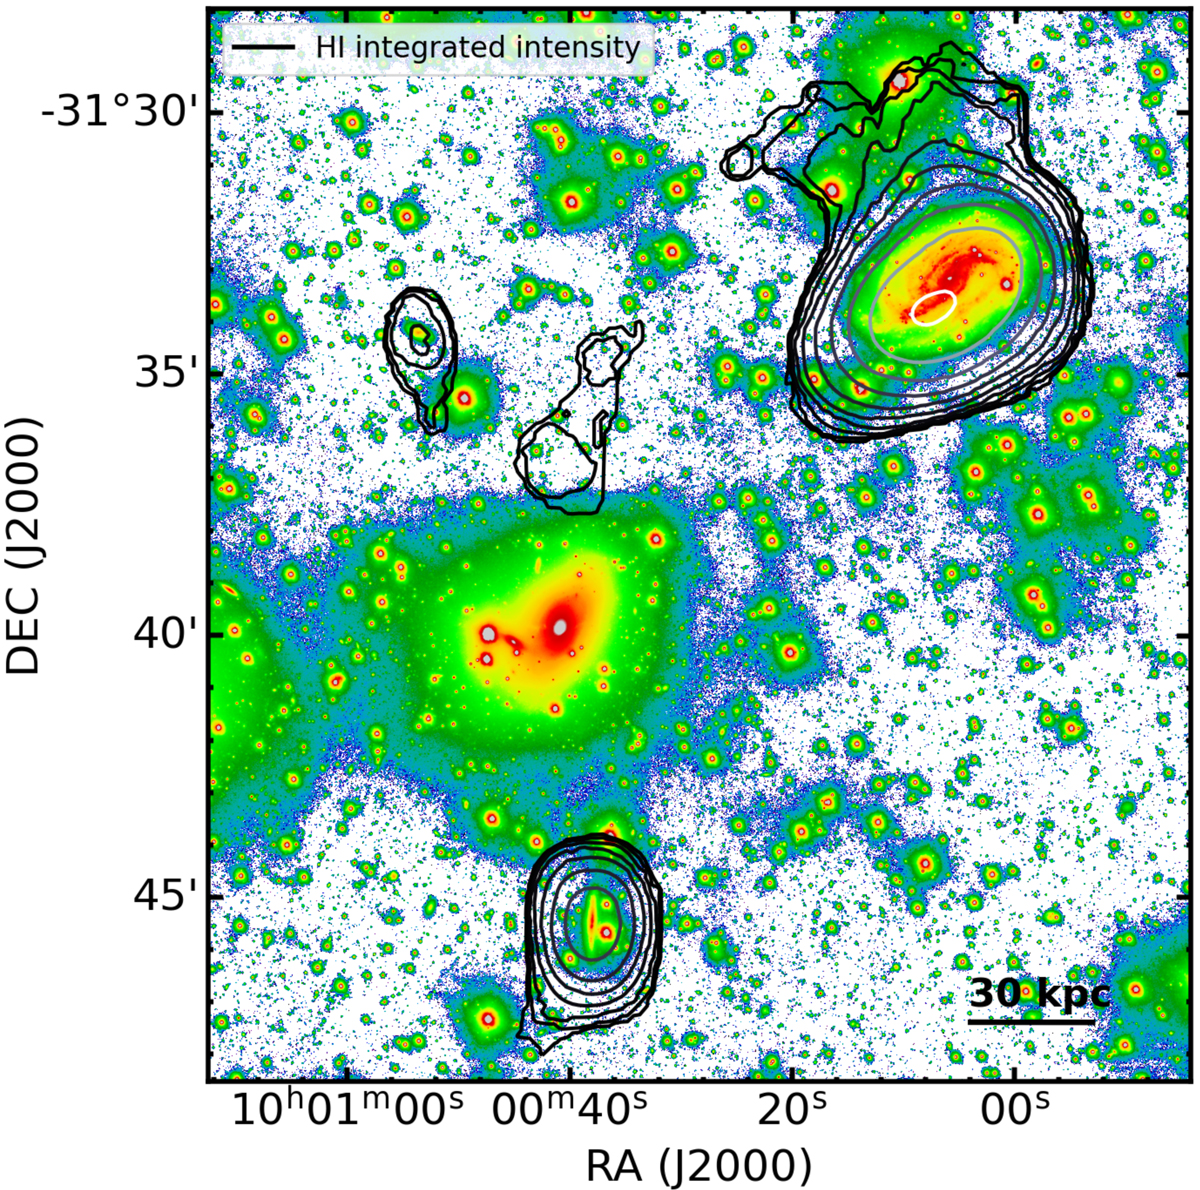
Phase-space diagram of the NGC 3100 group. NGC 3100 is shown in red, while H I detections are shown in blue, and non-detections in grey. Triangles indicate group members from the Kourkchi & Tully (2017) catalogue that are located outside the field of view of ATCA. The dotted line shows the caustic curve defined by the escape velocity of the group. Interestingly, most H I detections are located within the virialised region of the group (dashed-dotted line). The proximity of NGC 3095 and DwN suggests a recent interaction with NGC 3100.
Current usage metrics show cumulative count of Article Views (full-text article views including HTML views, PDF and ePub downloads, according to the available data) and Abstracts Views on Vision4Press platform.
Data correspond to usage on the plateform after 2015. The current usage metrics is available 48-96 hours after online publication and is updated daily on week days.
Initial download of the metrics may take a while.


