Open Access
Fig. 3.
Download original image
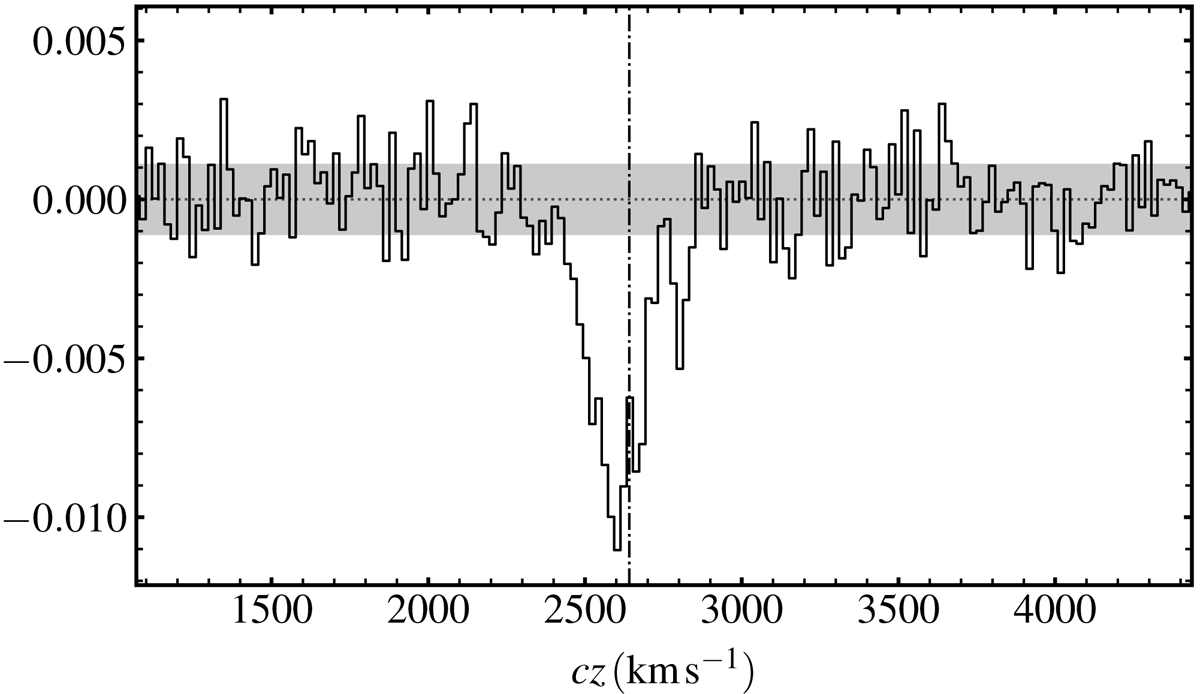
H I absorption detected in the centre of NGC 3100 (with a PSF of 21″×19″) against the unresolved radio continuum emission of the AGN (S1.4 GHz ∼ 490 mJy). The dashed-dotted vertical line marks the systemic velocity of the source (vsys = 2641 km s−1), and the grey shaded area shows the average noise across in the datacube.
Current usage metrics show cumulative count of Article Views (full-text article views including HTML views, PDF and ePub downloads, according to the available data) and Abstracts Views on Vision4Press platform.
Data correspond to usage on the plateform after 2015. The current usage metrics is available 48-96 hours after online publication and is updated daily on week days.
Initial download of the metrics may take a while.