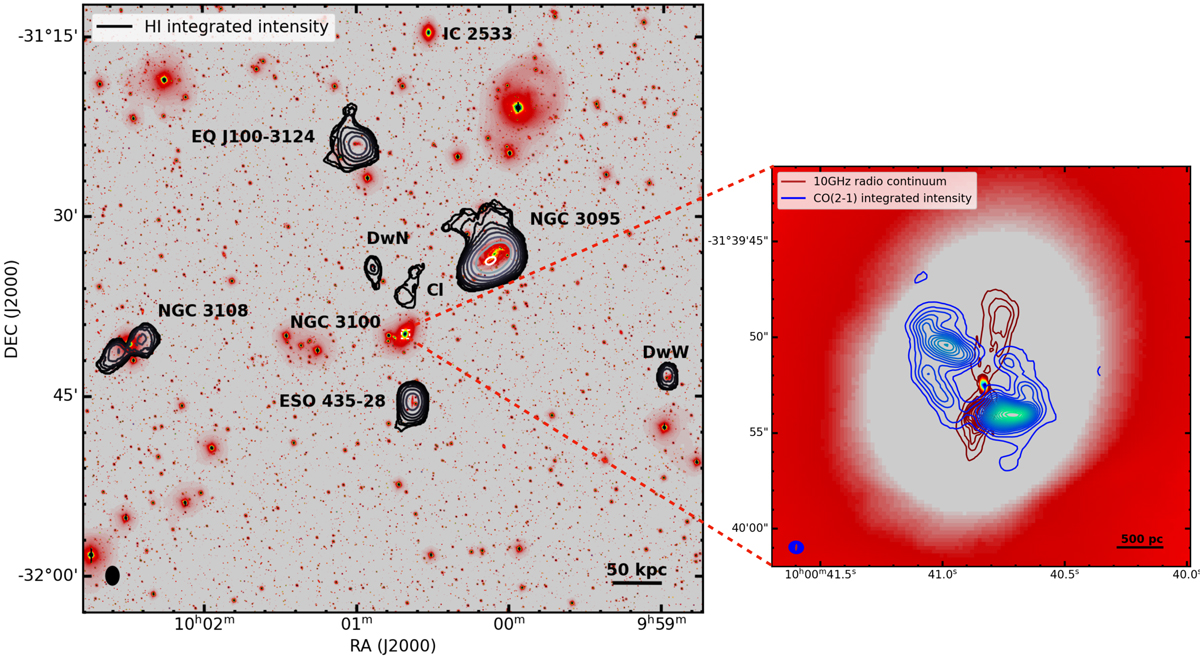
Fig. 1.
Download original image
Multi-wavelength view of the group of NGC 3100 and of its circum-nuclear regions. Left panel: Primary beam-corrected H I contours overlaid on a r-band image from VEGAS of the NGC 3100 group. The contour levels are 5σ × 2n Jy km s−1. The lowest contour corresponds to 1.1 × 1019 cm−2. Right panel: VEGAS r-band map zoomed onto the inner 15″ × 15″ (≈2.5 × 2.5 kpc2). The colour scale is inverted compared to the left panel. ALMA CO(2–1) integrated intensity contours from Ruffa et al. (2019b), and radio continuum contours from JVLA data at 10 GHz (Ruffa et al. 2020) are overlaid in blue and red contours, respectively. Contours are drawn at 1, 3, 9, etc. times the 3σ rms noise level. The H I (left panel), CO, and radio continuum (right panel) Gaussian restoring beams are shown in the bottom-left corners. A scale bar is shown in the bottom-right corner of each panel.
Current usage metrics show cumulative count of Article Views (full-text article views including HTML views, PDF and ePub downloads, according to the available data) and Abstracts Views on Vision4Press platform.
Data correspond to usage on the plateform after 2015. The current usage metrics is available 48-96 hours after online publication and is updated daily on week days.
Initial download of the metrics may take a while.